Japanese Yen Weekly Forecast: Bullish Triangle or Double Top for USD/JPY?

Japanese Yen Weekly Forecast: Bullish Triangle or Double Top for USD/JPY?

The Japanese yen is at an important crossroads against the US dollar ahead of the release of key Japan inflation data.

Japan inflation is due to be released on Friday – core inflation for March is expected to have softened to 3.2% on-year from 3.3% in February, according to Bloomberg, albeit still away from BOJ’s 2% target. Ahead of the data, USD/JPY appears to be well bid after Japan’s new central bank governor Kazuo Ueda, at his inaugural press conference last week, stressed they are in no rush to alter the ultra-accommodative policy settings, including yield curve control.

USD/JPY 240-minute Chart

image1.png

Chart Created by Manish Jaradi Using TradingView


Ueda said big changes to YCC should be decided by looking at economic, price, and financial trends. At the same time, he said the BOJ should avoid being too late in normalizing monetary policy, and leave the door open for some adjustments sooner rather than later. For now, though, the new governor’s dovish tone is likely to provide some support for USD/JPY in the near term, especially amid rising expectations of one more US Fed rate hike at the May meeting. For more discussion on this see “Gold Weekly Forecast: Is it Time to Turn Cautious on XAU/USD?”, published April 16.

USD/JPY Daily Chart

image2.png

Chart Created Using TradingView

Meanwhile, technical charts suggest the broader picture for USD/JPY remains bearish.As highlighted in recent updates, USD/JPY trend on the daily charts is down. See color-coded candlestick charts based on trend/momentum indicators.

USD/JPY Daily Chart

image3.png

Chart Created by Manish Jaradi Using TradingView

Most recently, though, USD/JPY has been stuck in a narrow range, with two potential price patterns unfolding on the 240-minute charts. One appears to be an ascending (bullish) triangle forming since late March. The other one seems to be a minor double top (the April 12 and April 17 highs). While not a done deal yet – the price action is still unfolding – the implications for the subsequent trend could differ.

A decisive break above a horizontal trendline from early April at about 134.00 would trigger the bullish ascending triangle, with a potential price objective of around 137.00-138.00. On the other hand, a failure to rise above the horizontal trendline at 134.00 would raise the risk of a drop toward the last week’s low of 132.00. Any fall below 132.00 would trigger the bearish double-top pattern, exposing downside risks toward 130.00.

USD/JPY Weekly Chart

image4.png

Chart Created by Manish Jaradi Using TradingView

Zooming out on the daily and the weekly charts, USD/JPY has quite strong converged support at the January low of 127.20, coinciding with the lower edge of the Ichimoku cloud on the weekly charts and the May 2022 low of 126.35. On the upside, above 134.00, there is a tough ceiling at the March high of 137.90, roughly coinciding with a stronger barrier on the 200-DMA (now at about 137.10).

British Pound Price Setup: GBP/USD Rally Due for a Minor Pause?

British Pound Price Setup: GBP/USD Rally Due for a Minor Pause?

A negative divergence on the daily charts suggests the British pound‘s rally against the US dollar is losing steam in the short term, pointing to the possibility of a consolidation/minor retreat ahead of key UK data due this week.

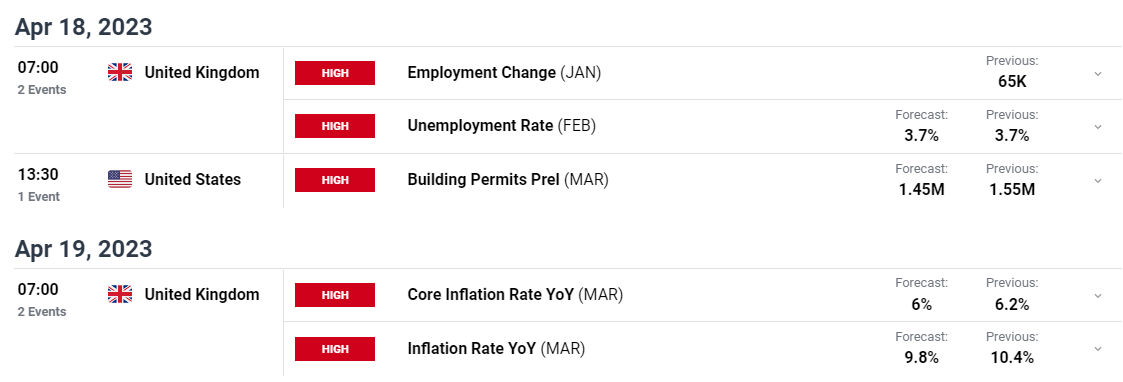
A raft of UK data is due this week, starting with jobs data on Tuesday; inflation data on Wednesday; Gfk consumer confidence, retail sales, and April flash PMIs on Friday. UK core inflation is expected to have softened to 0.6% on-month in March from 1.2% in February, while headline inflation is forecast to have eased to 9.8% on-year last month from 10.4% in February. Moreover, if there are signs of rapid wage growth could keep inflationary pressures intact.

GBP/USD 240-Minute Chart

image1.png

Chart Created Using TradingView

The Bank of England raised hiked the Bank Rate by 25bps in March and left the door open for further hikes if inflation showed signs of “persistence”. Hence this week’s data will be key in determining whether BoE decides to pause or proceed with one more rate hike. The market is pricing in a 67% chance of a 25-bps hike at the May 11 meeting.

GBP/USD Weekly Chart

image2.png

Chart Created Using TradingView

Meanwhile, the colour-coded candlestick charts based on trend/momentum indicators show GBP/USD remains in a bullish phase on the daily charts. However, as noted in the previous update, see “British Pound Price Setup: GBP/USD, EUR/GBP, GBP/JPY”, published March 29, GBP/USD has been weighed by a tough converged barrier at the top end of a sideways channel since end 2022.

GBP/USD Daily Chart

image3.png

Chart Created by Manish Jaradi Using TradingView

The upper edge is a horizontal trendline at about 1.2450, while the lower edge is a similar trendline at about 1.1850. Any break above the top end of the range would trigger a bullish break from the channel, potentially opening the door for a move toward 1.3000.

However, GBP/USD’s rally is showing some signs of fatigue, suggesting the pair may not yet be ripe for a bullish break just yet (even though the broader trend is up). On the 4-hourly charts, the fall below a minor uptrend channel since mid-March confirms that the upward pressure could be easing. In this regard, key support is at the April 10 low of 1.2345.

GBP/USD Daily Chart

image4.png

Chart Created Using TradingView

Any break below would trigger a minor double top (this month’s highs), opening the way toward 1.2200. Nonetheless, there is a fairly strong cushion on the 89-day moving average, 200-day moving average, and the lower edge of the sideway channel that could restrict any downside.

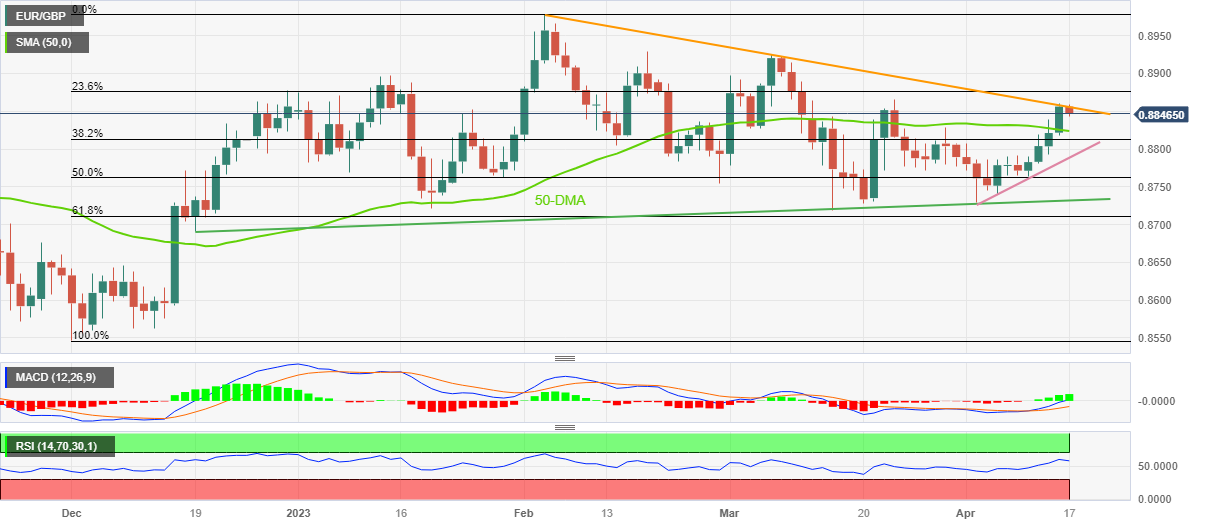
EUR/GBP Price Analysis: Reverses from 10-week-old resistance line, snaps four-day uptrend near 0.8850

EUR/GBP Price Analysis: Reverses from 10-week-old resistance line, snaps four-day uptrend near 0.8850

EUR/GBP bears are back in the race during early Monday as the quote drops to 0.8845 amid the initial hours of the European session, after being absent in the last four days.

In doing so, the cross-currency pair retreats from a three-week high while snapping a four-day winning streak.

That said, a downward-sloping resistance line from early February, around 0.8860 by the press time, triggers the latest pullback in the EUR/GBP prices. However, the pair’s downside appears limited as the 50-DMA level of 0.8823 puts a short-term floor under the price.

Following that, a fortnight-long ascending support line near 0.8790 can check the EUR/GBP bears before directing them to the key trend line support stretched from December 19, 2022, around 0.8730 at the latest.

It’s worth noting that the bullish MACD signals and the rising RSI (14) line, not overbought, keep the pair buyers hopeful.

Meanwhile, a clear upside break of the aforementioned resistance line from early February, close to 0.8860 can quickly propel the prices toward the 0.8900 round figure.

In a case where the EUR/GBP bulls keep the reins past 0.8900, the previous monthly high of around 0.8925 holds the key to the pair’s further advances towards the yearly high marked in February near 0.8980.

Should the quote remains firmer past 0.8980, the 0.9000 round figure acts as an extra filter towards the north.

EUR/GBP: Daily chart


EUR/USD remains pressured below 1.1000 ahead of Lagarde

EUR/USD remains pressured below 1.1000 ahead of Lagarde

EUR/USD remains pressured below 1.0100, consolidating Friday’s retreat from a one-year high early Monday. The US Dollar sticks to its recovery mode at the start of the week despite a better market mood and sluggish US Treasury bond yields. ECBspeak eyed.

From a technical perspective, any meaningful slide below the Asian session low, around the 1.0960-1.0950 area, is likely to find decent support near the 1.0920-1.0915 region. This is closely followed by the 1.0900 mark, below which the corrective slide could drag the EUR/USD pair towards the 1.0850 intermediate support. Spot prices could eventually slide further below the 1.800 round figure and challenge the 50-day Simple Moving Average (SMA), currently around the 1.0745 zone.

On the flip side, momentum back above the 1.1000 psychological mark now seems to face some resistance near the 1.1040 area and the YTD peak, around the 1.1075 region. Some follow-through buying will be seen as a fresh trigger for bullish traders and push the EUR/USD pair beyond the 1.1100 mark, towards testing the next relevant hurdle near the 1.1160-1.1170 horizontal zone.

The markets are pricing in a greater chance of another 25 bps lift-off at the next FOMC meeting in May and the bets were lifted by a rise in short-term inflation expectations. The University of Michigan’s preliminary report showed that Consumer Sentiment Index inched up from 62.0 to 63.5 in April and one-year inflation expectations rose to 4.6% from 3.6% in March. This, in turn, remains supportive of elevated US Treasury bond yields and continues to underpin the Greenback.

Apart from this, impressive bank earnings further eased concerns about a banking crisis that unfolded in March. This, along with resilience in US core retail sales, suggested that the US economy is not so bad. Moreover, the gains in January and February put consumer spending firmly on track to accelerate in the first quarter. That said, weaker headline sales set consumer spending on a lower growth path heading into the second quarter and reaffirmed that the Fed’s year-long interest rate hiking campaign is cooling domestic demand. Adding to this, the anticipated pause in the Fed’s policy tightening cycle in June might hold back the USD bulls from placing aggressive bets. This makes it prudent to wait for strong follow-through selling before confirming that the EUR/USD pair has formed a near-term top and positioning for deeper losses.

There isn’t any relevant market-moving macro data due from the Eurozone on Monday, while the US economic docket features the release of the Empire State Manufacturing Index later during the early North American session. Apart from this, the US bond yields, might influence the USD price dynamics and provide some impetus to the EUR/USD pair. Traders will further take cues from a scheduled speech by the European Central Bank (ECB) President Christine Lagarde, which will drive the shared currency and contribute to producing short-term opportunities around the major.

Pound Sterling Forecast: UK Fundamental Data Fails to Inspire, CPI Next

Pound Sterling Forecast: UK Fundamental Data Fails to Inspire, CPI Next

UK Economic Data Fails to Inspire – GDP Growth Remains Sluggish

This week, continuing disinflation in the US (headline, not core inflation) saw markets continue to sell dollars which spurred cable to a new yearly high. However, when you look elsewhere, like GBP/CHF or EUR/CHF, the ‘mixed’ performance of sterling is clearer to see.

Chatter from monetary policy committee (MPC) members within the Bank of England (BoE) this week referenced the UK lending conditions, bumpier than expected inflation, and not so exciting fundamental data – UK GDP.

UK GDP showed a modest improvement year on year but the UK economy failed to grow in the month of March but at the same time avoided a contraction, coming in at 0%. The BoE’s Chief Economist Huw Pill mentioned that lending conditions were observed to have “slowed only slightly”, while the MPC remain confident that inflation will be lower in Q2 despite last months failed attempt to bring inflation below double digits.

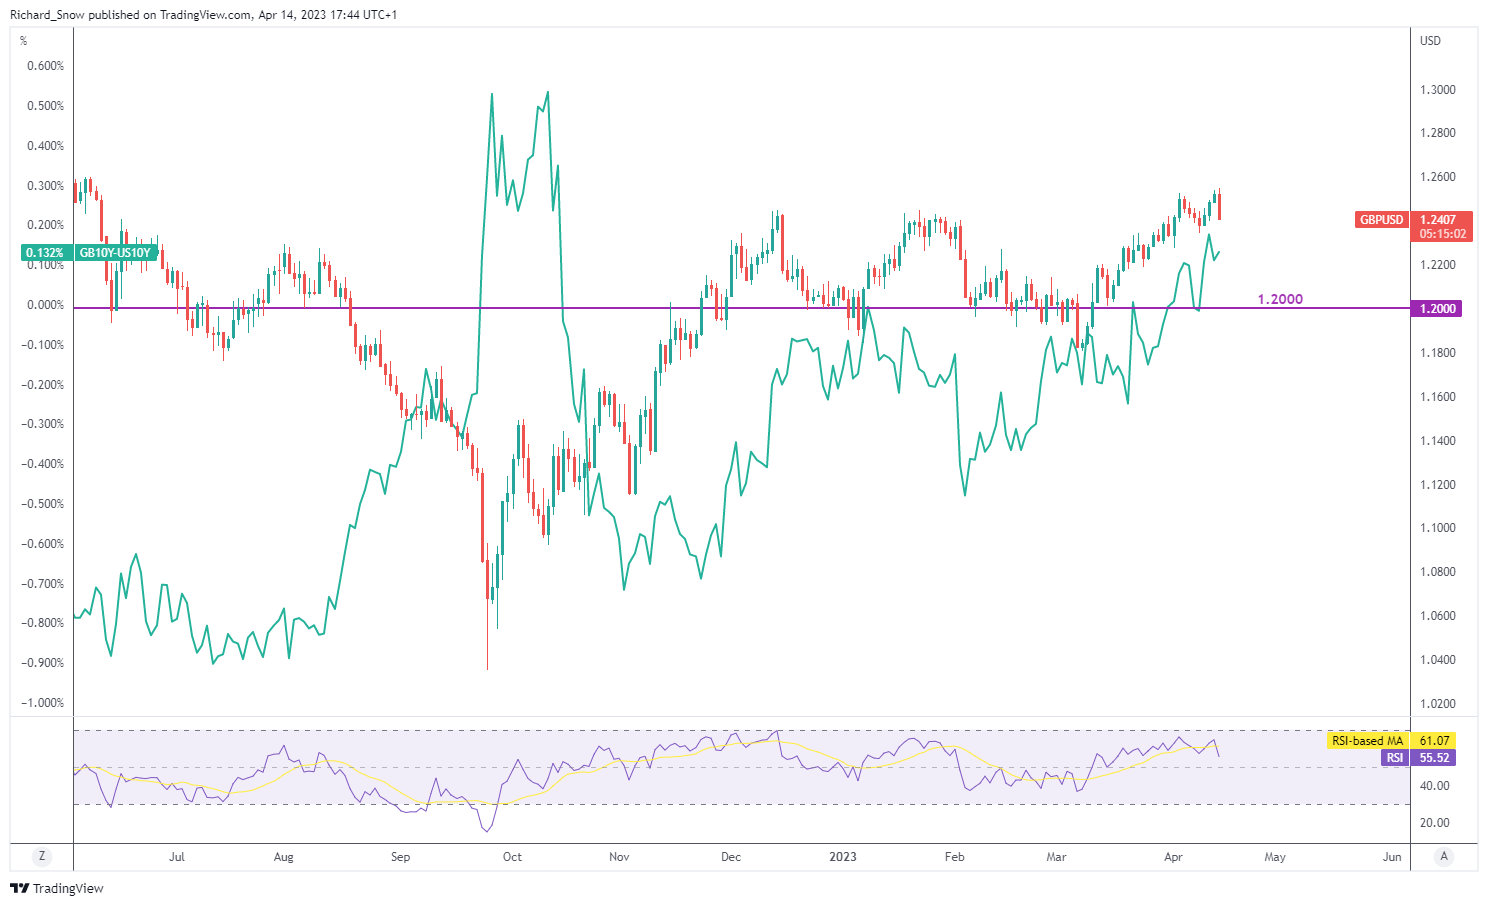
One thing the pound has going for it is a positive and rising interest rate differential against the US. Stronger levels appear to be supporting cable higher at the same time markets are dumping the dollar.

GBP/USD Daily Chart with Interest Rate Differential (Green line)

image1.png

Source: TradingView, prepared by Richard Snow

Markets Favour a 25 bps Hike in May

The BoE has another difficult decision to make next month as it considers another potential rate hike, although, the recent stability in the banking sector may have afforded the MPC more room to hike. Dovish BoE member Tenreyro mentioned on Friday that “we need to be patient over the impact of past rate rises on inflation”, signaling that we could see another split vote come May.

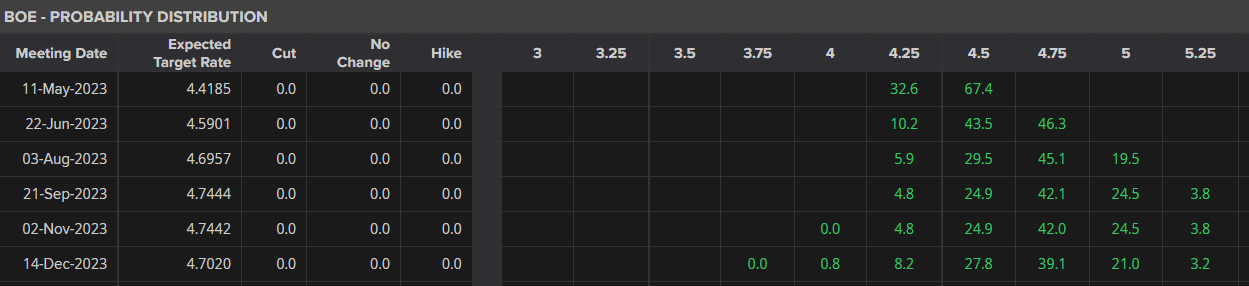
Implied market probabilities reveal a growing expectation of a 25-bps hike in May (67% implied probability).

Bank of England Implied Rate Probabilities

image2.png

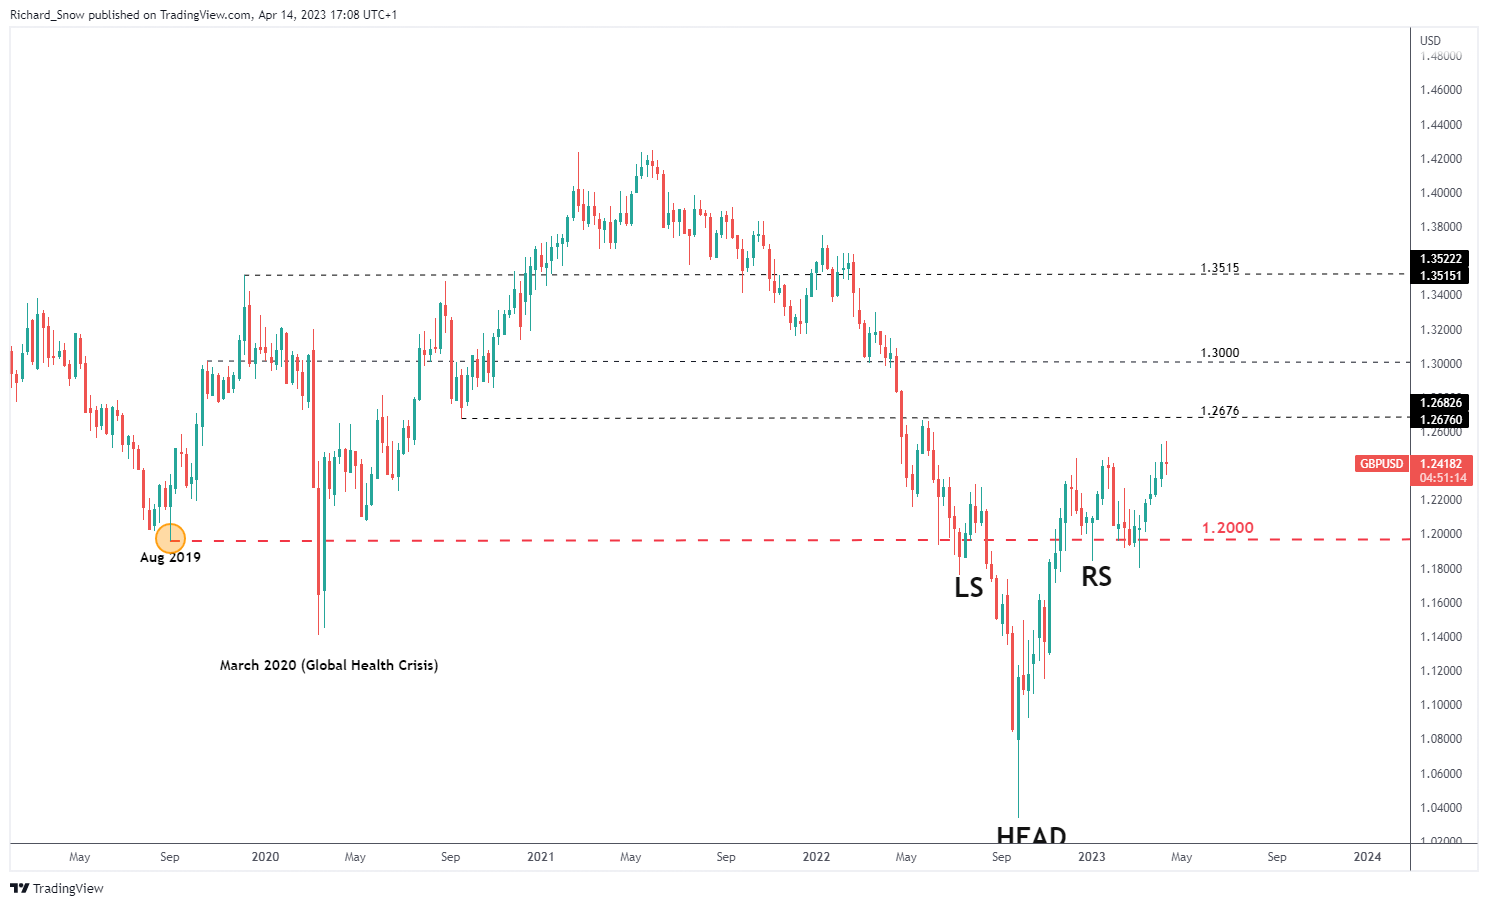
Cable is showing signs of bullish fatigue on a weekly basis as a fairly long upper wick has developed towards the end of the week. GBP/USD bulls will be looking for continuation setups that see resistance around 1.2676, followed by the psychological level all the way at 1.3000. In the event the pair is due for a move lower, support rests at 1.2000.

GBP/USD Weekly Chart

image3.png

Source: TradingView, prepared by Richard Snow

Scheduled Risk Events Ahead

Next week the economic calendar shifts from prior USD data dependence to a more UK centric approach. UK employment data becomes due and later in the week the all-important inflation data for March will reveal if stubbornly high UK prices have cooled below double digits.

image4.png

Another mention is to look out for major US earnings next week from major banks like Goldman Sachs to tech heavyweights like Netflix and Tesla which can all have an impact on the dollar. Stay up to date with the latest releases via our new earnings calendar.

ECB’s Lagarde: Inflation to continue to fall as lagged price pressures fade out

ECB’s Lagarde: Inflation to continue to fall as lagged price pressures fade out

European Central Bank (ECB) President Christine Lagarde said on Friday that she expects inflation in the Euro area to continue to fall with lagged price pressure fading out, as reported by Reuters.

“Historically high wage growth, related to tight labour markets and compensation for high inflation, will support core inflation over the projection horizon, as it gradually returns to rates around our target,” Lagarde further noted in her prepared statement delivered at the IMF spring event.

Market reaction

The EUR/USD pair showed no immediate reaction to these comments and it was last seen rising 0.1% on a daily basis at 1.1060.

EUR/USD Prints New Yearly High on Rate Differentials and Hawkish ECB

EUR/USD Prints New Yearly High on Rate Differentials and Hawkish ECB

EUR/USD News and Analysis

Magnitude of ECB Hike May Depend on EU Lending Survey

ECB policymaker Pierre Wunsch highlighted the urgency for the ECB to continue its rate hiking endeavors while doing more to reduce its massive 3.2 trillion-euro balance sheet.

Wunsch identified a scenario where we could see a 50 bps hike, a proposition that would gain traction should core inflation provide a welcome surprise alongside positive data from the ECB’s quarterly lending survey. With a sense of calm returning to the EU and US banking sectors, markets will turn their focus to the willingness of banks to extend credit during this time of rising interest rates and recent instability as a reduced appetite is essentially an extension of tighter monetary policy even if not directly set into motion by the ECB.

EUR/USD Technical Considerations

EUR/USD has breached the 1.1000 level identified previously and as of the mid-morning London session, trades above the yearly high of 1.1033. The yellow line on the daily chart represents the interest rate differential between the German 10 year bund yield and the US 10 year treasury yield which helps to explain the recent bullish move. The increasing differential continues to support the euro while market expectations of US rate cuts in the second half of the year, and US disinflation, continue to deepen dollar declines.

The 61.8% Fibonacci level of 1.1205 becomes the next upside level of resistance with the next zone of resistance all the way at 1.1500. However, the threat of declining earnings growth ahead of the US earnings season could see some much-needed support for the safe-haven that is the US dollar, as recession fears could make a comeback. Look out for mentions of ‘recession’ in earnings statements particularly as the minutes of the March Fed meeting pointed to the possibility that the US could enter into a recession towards the end of the year. Support rests at the prior high of 1.1033 before 1.0767.

EUR/USD Daily Chart

image1.png


Australian Dollar Fundamental Outlook: RBA Pauses with CPI Ahead

Australian Dollar Fundamental Outlook: RBA Pauses with CPI Ahead

Australian Dollar Fundamental Outlook: RBA Pauses with CPI Ahead

The Australian Dollar finished the first quarter not far from where it started after trading in a wide range of 0.6565 – 0.7158 through the first three months of 2023.

It initially ran to the early February peak on the back of US Dollar weakness. When the greenback turned around and strengthened, AUD/USD visited the mid-March low of the quarter.

 Monetary Policy Matters

All this price action was led by perceptions of what the Federal Reserve had planned for their rate path. Going into the end of the first quarter, the banking crisis began to unfold. The Fed is left with the dilemma of fighting inflation while not smoking the financial system. This dichotomy has the potential to be a driving force for the Aussie Dollar going forward.

It is important to note that there are two types of issues unfolding for failing banks. Firstly, there are those banks that have had weak balance sheets for some time and have been exposed to the tightening of monetary conditions. Secondly, there are banks that have mismanaged their balance sheet by having a mismatch of assets to liabilities.

Credit Suisse and Republic Bank fall into the former category, while Siilvergate Bank, SVB Financial and Signature Bank belong in the latter category.

Overall, this might suggest that the problems are not systemic per se, but that more banks could be exposed for failing in either category through the second quarter. Corporates that have weak balance sheets and need to go back to the market to raise capital might also find tough conditions for doing so.

With this in mind, AUD/USD is viewed by the market as a high beta currency making it more susceptible to sways in investor and risk sentiment than other major currencies.

If the banking upheaval continues, then financial conditions could further tighten, and this may see confidence in global markets undermined. This environment might see AUD come under pressure.

Conversely, if conditions stabilise, then the focus could return to how hawkish the Fed will need to be to get inflation down to its target of 2% from the last read of 6% year-on-year to the end of February.

Easy Does it for the RBA

Domestically, the RBA have played their hand and backed away from further tightening according to the April monetary policy meeting minutes. First quarter CPI will be released the day after ANZAC day on April 26th. The RBA has cited the slowing in the monthly inflation gauge as re-assuring their dovish posture. The more accurate quarterly figure will be closely watched to see if they are off the hook or not.

The RBA has raised the cash rate by 350 basis points since last May 2022. In October 2021 the Australian Prudential Regulation Authority (APRA) released this statement.

“APRA has told lenders it expects they will assess new borrowers’ ability to meet their loan repayments at an interest rate that is at least 3.0 percentage points above the loan product rate.”

Much has been made of the so-called ‘mortgage cliff’ where borrowers will need to refinance their debt of the last few years at current levels. These debts appear to be at the upper end of APRA’s expectation of appropriate lending. This might go some way to explain why the RBA is hesitating to tighten monetary policy while CPI remains much higher than its target of 2–3%.

All of this stacks up to potential headwinds for the Australian Dollar. The bright side is that a low exchange rate contributes to the trade surplus that continues to deliver prosperity to the local economy. It is consistently running at over AUD 10 billion a month.

Meanwhile, bond spreads continue to play a role in the background and could be a contributing factor for AUD/USD should there be a large move in the spreads.

AUD/USD Against AU-US 3 and10 Year Bond Spread

image1.png


USD/JPY now faces some near-term consolidation – UOB

USD/JPY now faces some near-term consolidation – UOB

USD/JPY is likely to navigate within the 131.20-133.70 range in the next weeks, note Markets Strategist Quek Ser Leang and Senior FX Strategist Peter Chia at UOB Group.

Key Quotes

24-hour view: “We expected USD to trade in a range of 132.60/133.70 yesterday. However, USD dropped sharply to 132.01 and then rebounded. Despite the rebound, the weakness in USD has not stabilized. USD has scope to test 132.00 again before a sustained recovery is likely. On the upside, a breach of 133.25 (minor resistance at 132.90) would indicate that the weakness has stabilized.”

Next 1-3 weeks: “Yesterday (13 Apr, spot at 133.10), we noted that ‘upward momentum is beginning to fade and the odds of USD rising to 134.40 are diminishing’. We added, ‘only a break of 132.20 would indicate that USD is not strengthening further’. USD dropped to a low of 132.01 in NY trade. The breach of the ‘strong support’ at 132.20 indicates that the USD strength that started early this week has ended. USD appears to have moved into a consolidation phase and is likely to trade between 131.20 and 133.70 for now.”

USD/CAD consolidates its recent losses to two-month low, holds above 1.3300 mark

USD/CAD consolidates its recent losses to two-month low, holds above 1.3300 mark

The USD/CAD pair enters a bearish consolidation phase and oscillates in a narrow range near a fresh two-month low touched earlier this Friday. The pair trades around the 1.3325-1.3330 region through the first half of the European session and remains in the negative territory for the fifth successive day.

The US Dollar (USD) drops to a one-year low amid growing acceptance that the Federal Reserve (Fed) is nearly done with its rate-hiking cycle and turns out to be a key factor exerting some pressure on the USD/CAD pair. In fact, the markets now seem convinced that the US central bank will pause after hiking one last time next month. The bets were lifted by the incoming US macro data, which pointed to signs of easing inflationary pressures.

Moreover, the March FOMC meeting minutes released on Wednesday showed that several policymakers considered pausing interest rate increases after the failure of two regional banks. This continues to act as a headwind for the US Treasury bond yields and is seen weighing on the Greenback. That said, a generally weaker tone around the equity markets helps limit losses for the safe-haven buck and lends some support to the USD/CAD pair.

The International Monetary Fund (IMF) earlier this week trimmed its 2023 global growth outlook, citing the impact of higher interest rates. This, along with worries that the post-COVID recovery in China is losing steam, raised recession fears and keep a lid on the optimism witnessed since the beginning of this week. Apart from this, softer Crude Oil prices undermine the commodity-linked Loonie and act as a tailwind for the USD/CAD pair.

Investors remain concerned that a deeper global economic downturn will dent fuel demand, which, in turn, drags Oil prices away from a fresh YTD peak touched on Wednesday. That said, a surprise decision last week by OPEC+ to cut output lends some support to the black liquid. This, along with the Bank of Canada’s (BoC) readiness to raise borrowing costs again if needed to restore price stability, limits losses for the Canadian Dollar.

The aforementioned fundamental backdrop suggests that the path of least resistance for the USD/CAD pair is to the downside. The negative outlook is reinforced by the overnight breakdown through a multi-month-old ascending trend-line support and a technically significant 200-day Simple Moving Average (SMA). Hence, any attempted recovery might still be seen as a selling opportunity and runs the risk of fizzling out rather quickly.

Market participants now look forward to the US economic docket, featuring the release of monthly Retail Sales figures and the Preliminary Michigan Consumer Sentiment Index later during the early North American session. This, along with the US bond yields, will drive the USD demand and provide some impetus to the USD/CAD pair. Apart from this, traders will take cues from Oil price dynamics to grab short-term opportunities.