EUR/USD consolidates below 1.1100 amid persistent USD weakness

EUR/USD consolidates below 1.1100 amid persistent USD weakness

EUR/USD is consolidating gains below 1.1100 amid a risk-on mood in the European session. The US Dollar remains vulnerable amid expectations that the Fed is on track to end its tightening cycle, following soft US inflation data. US Retail Sales data is awaited.

EUR/USD climbed out of the ascending regression channel and the Relative Strength Index (RSI) indicator on the four-hour chart rose toward 80, pointing to overbought conditions.

In case the pair stages a correction and returned within the ascending channel, 1.1020 (mid-point of the channel), 1.1000 (psychological level, static level) and 1.0970 (20-period Simple Moving Average (SMA)) align as support levels.

On the upside, 1.1100 (psychological level) aligns as the next bullish target ahead of 1.1150 (static level from March 2022).

Fundamental Overview

GMT
Event
Vol.
Actual
Consensus
Previous
Thursday, Apr 13
24h
Friday, Apr 14
07:00
3.1%
3.1%
3.1%
07:00
1.1%
1.1%
1.1%
12:30
-0.3%
-0.1%
12:30
0.6%
0.5%
12:30
-0.4%
-0.4%
12:30
-0.1%
-0.1%
12:30
-0.1%
0.2%
12:30
-3.7%
-1.1%
12:30
-2.7%
4.1%

EUR/USD has gathered further bullish momentum and climbed to its highest level in over a year above 1.1070. The pair’s near-term technical outlook shows overbought conditions as investors move to the sidelines ahead of the last data releases of the week from the US.

On Thursday, the US Bureau of Labor Statistics reported that the Producer Price Index (PPI) declined to 2.7% in March from 4.9% in February. On a monthly basis, the PPI and the Core PPI came in at -0.5% and -0.1%, respectively. Moreover, the US Department of Labor’s weekly data showed that the Initial Jobless Claims rose to 239K from 228K. In turn, the US Dollar (USD), which had suffered large losses on soft Consumer Price Index (CPI) data on Wednesday, continued to weaken against its rivals.

Meanwhile, European Central Bank (ECB) Governing Council members Bostjan and Vasle Pierre Wunsch said on Thursday that they could either opt for a 25 basis points or a 50 basis points rate hike at the May meeting. These comments provided an additional boost to the Euro.

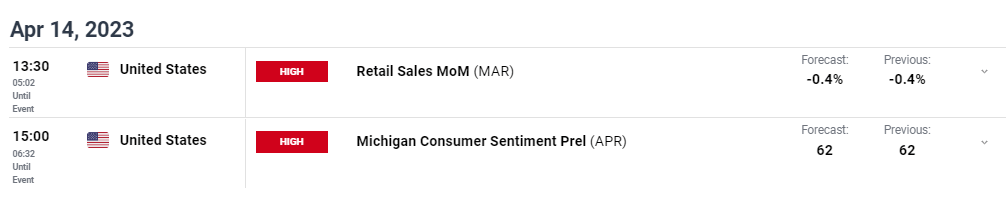
Early Friday, EUR/USD stays relatively quiet as investors await the US data releases. Retail Sales are expected to decline by 0.4% on a monthly basis in March. Earlier in the week, NY Fed President John Williams said they will look at the sales data to see the impact of restrictive policy on the activity. In case there is a bigger-than-expected decline in Retail Sales, the USD could have a hard time finding demand ahead of the weekend and vice versa.

March Industrial Production and the University of Michigan’s preliminary Consumer Sentiment Survey for April will also be featured in the US economic docket.

US Dollar Continues to Get Punished as Traders Feel No Need for Safety as Stocks Soar

US Dollar Continues to Get Punished as Traders Feel No Need for Safety as Stocks Soar

Asia-Pacific Market Briefing – US Dollar Bracing for More Pain?

The haven-linked US Dollar was crushed over the past 24 hours, extending the most recent slide since early March. Meanwhile, the sentiment-linked Australian and New Zealand Dollars outperformed their major counterparts. The DXY Dollar index is down over 1% this week so far. If losses are sustained, this would be the worst 5-day period since early January. Gold soared, approaching record highs.

The Greenback’s decline this week can be traced back to the latest US inflation report. The headline CPI gauge unexpectedly fell to 5.0% y/y compared to the 5.1% estimate. But, the core gauge rose to 5.6% from 5.5% prior. Meanwhile, over the past 24 hours, US wholesale inflation figures broadly missed expectations.

Dampening inflation continues to underscore what may be the last rate hike from the Federal Reserve in this tightening cycle come May. Meanwhile, a resilient labor market likely has traders clinging to a scenario where the economy can withstand the shock of the most aggressive tightening in decades. Markets also continue to hold onto bets that the central bank will cut rates later this year.

With that in mind, what lies ahead for the US Dollar as the week wraps up? Friday’s Asia-Pacific trading session is lacking notable economic event risk. That may place the focus on sentiment for traders. As such, if regional indices extend Wall Street’s rosy trading session (where the S&P 500, Nasdaq 100, and Dow Jones soared), that may continue dampening demand for the haven-linked US Dollar.

US Dollar Technical Analysis

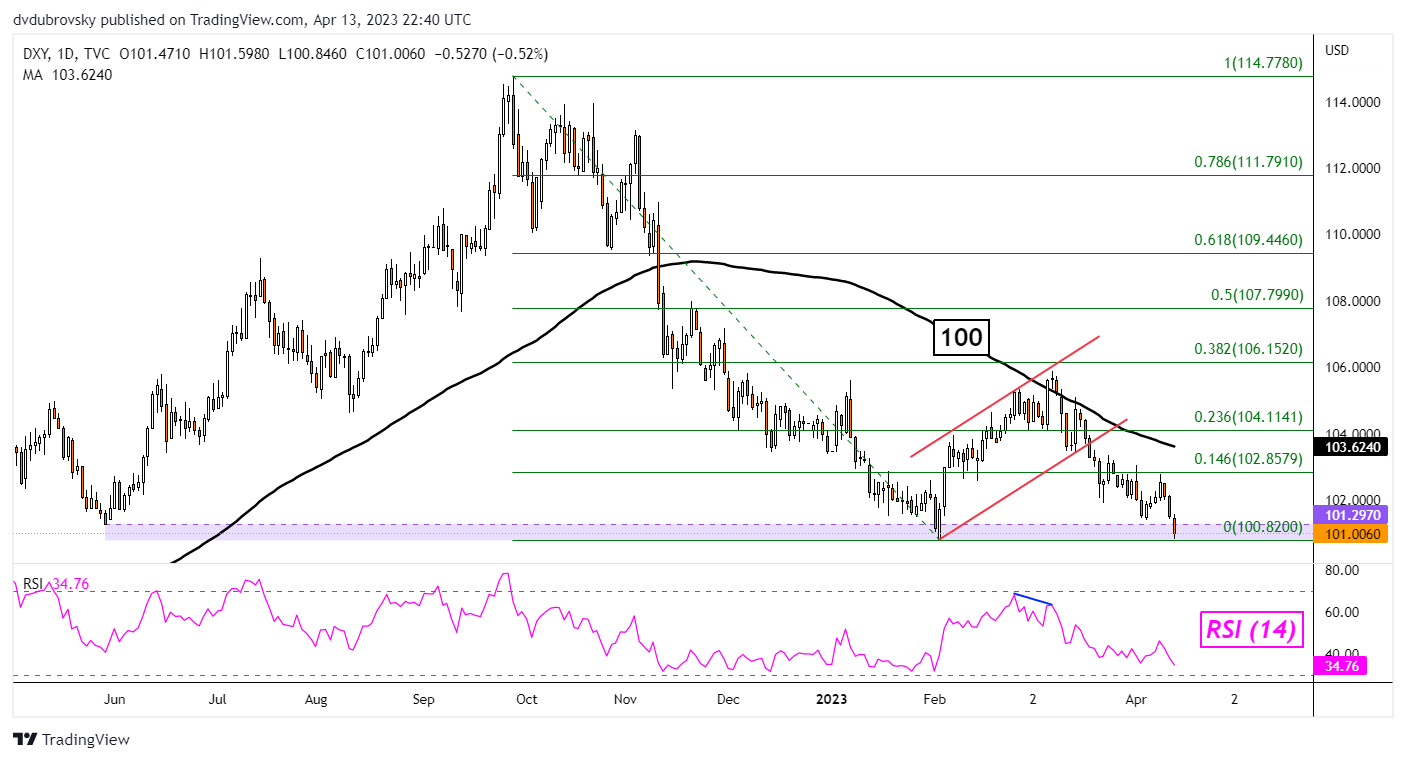
From a technical standpoint, the US Dollar is at a critical juncture if we are talking about the DXY’s peak back in September. Prices are sitting squarely on the 101 – 101.297 support zone. This area kept prices from extending losses in February, reinforcing the range. A confirmatory breakout here opens the door to the US Dollar to continue its broader downward journey.

DXY Daily Chart

DXY Daily Chart

Australian Dollar Flies High with Kiwi on Sinking US Dollar. Where to for AUD/USD?

Australian Dollar Flies High with Kiwi on Sinking US Dollar. Where to for AUD/USD?

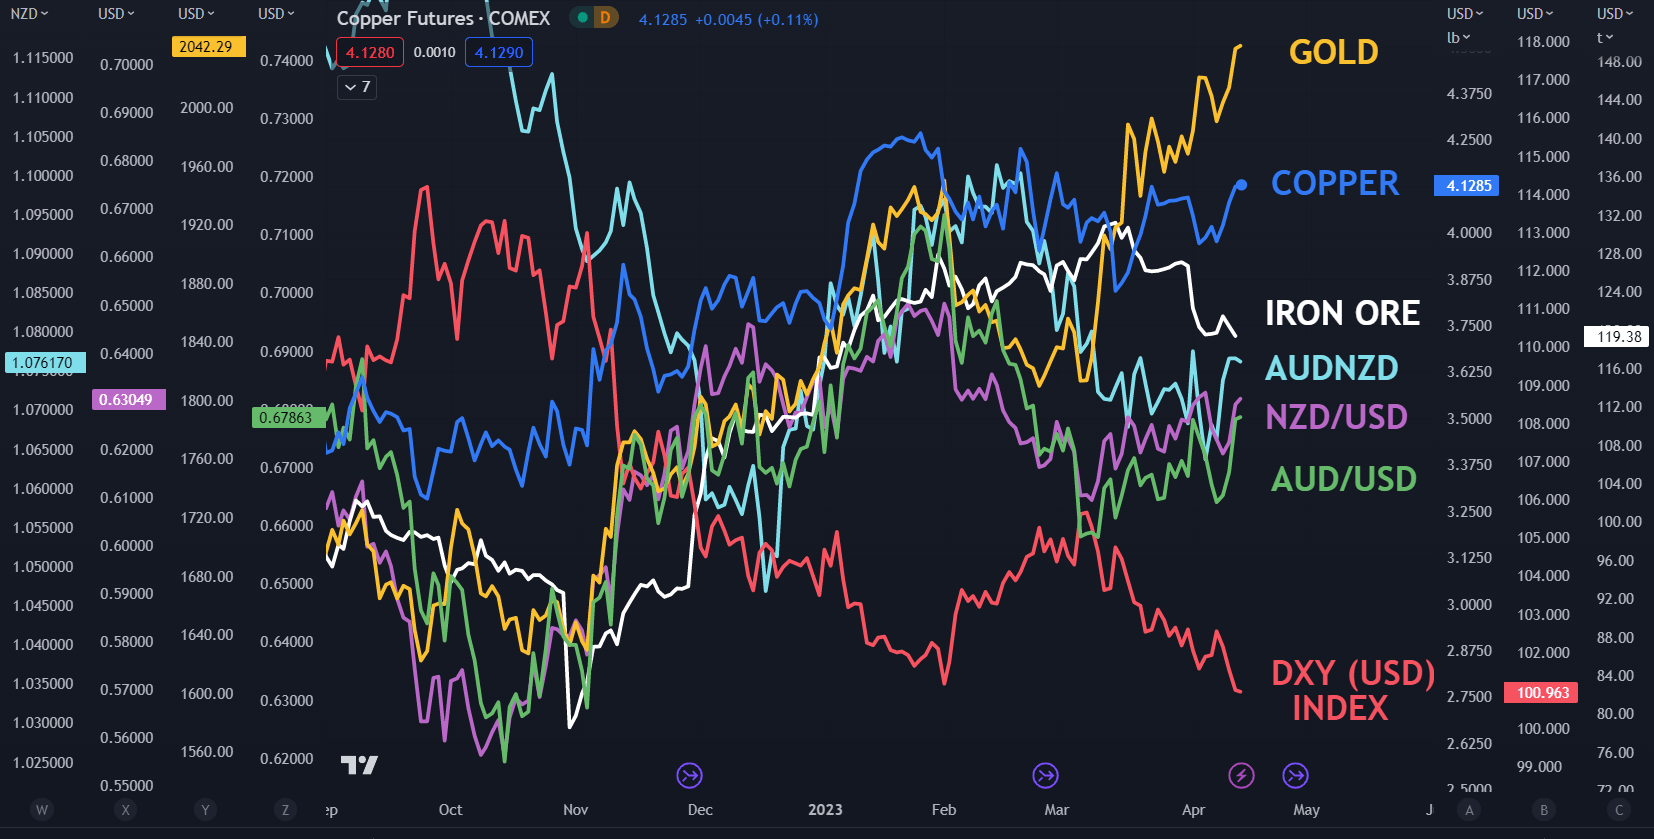
The Australian Dollar leapt higher again overnight after US PPI sent markets into a tailspin that saw the US Dollar face renewed pressure to the downside. The Aussie and the Kiwi Dollars were the biggest beneficiaries with the commodity complex also soaring.

To recap, US PPI final demand was below estimates at 2.7% year-on-year to the end of March rather than the 3.0% anticipated and 4.6% previously. The March month-on-month read was -0.5% instead of a flat number forecast and -0.1% prior.

While equity indices, commodities and high beta currencies such as the Aussie and Kiwi got a boost, Treasury yields lingered near current levels. Although the back end of the curve ended the day a handful of basis points (bps) higher.

The interest rate market barely changed its view of the probability of the Federal Reserve hiking rates in early May by 25 bps and it remains near 70%.

From a macro perspective, with PPI slipping further below CPI, this opens the possibility for companies to either cash in wider profit margins or pass on lower prices to consumers. Either way, Wall Street liked it.

The positive sentiment spread to commodity markets with gold and silver printing fresh highs, as did most industrial metals, although iron ore struggled.

AUD and NZD are viewed by the market as being sensitive to the global growth cycle and with stocks and commodities sailing north, so did they.

AUD/NZD had a look above 1.0800 but was unable to maintain the gain and the struggle might reflect the disparity in monetary policy between the RBA and the RBNZ. The latter is expected to hike 25 bp in late May by the interest rate market, while the RBA is anticipated to be on hold at its meeting in early May.

Both central banks will get CPI updates in the coming weeks, and these could be crucial for the direction in AUD/NZD. The RBNZ’s official rate is 165 bp above the RBA at 5.25%, despite Australia’s last quarterly CPI print being above New Zealand’s.

The RBA has been citing the less accurate monthly inflation gauge as reassurance for their relatively dovish stance. A benign quarterly CPI number on April 26th will support their bearing but another hot read to the topside may force them to reassess their current posture.

AUD/USD, NZD/USD, AUD/NZD, DXY (USD) INDEX, GOLD, COPPER, IRON ORE

image1.png


Hoping For an Early Fed Pivot Does Not Mean We Will Get One

Hoping For an Early Fed Pivot Does Not Mean We Will Get One

Every economic age has its dominant phrase. Think of the ‘irrational exuberance’ which then-Federal Reserve Chair Alan Greenspan fretted about during the 1990’s dot-com bubble. If that’s too far back for you, what about European Central Bank chief Mario Draghi in 2012 promising skeptical markets that he’d do ‘whatever it takes’ to save the Euro?

The buzzword of this inflation-ravaged era is more succinct. In fact, it’s just one word – ‘pivot.’

For our purposes it means the point at which the United States Federal Reserve will feel it can stop raising interest rates and begin to offer the possibility that they could start to go down.
image1.png

It’s easy to see why that word dominates. 2022 brought, among other dark things, interest rate rises unprecedented in the working lives of many people now engaged with financial markets. The US central bank has hit the monetary brakes no fewer than seven times, pushing the benchmark rate up to a target range of 4.25-4.5%. That’s the highest rate in fifteen years. Moreover, while there are clear rhetorical signs that the Fed is now more cautious about raising rates than it was back in the summer, there are equally clear signals that borrowing costs will go higher yet and that it may not top out below 5%.

Given that the Fed Funds rate spent much of the time between 2009 and 2021 barely above zero, the scale of the turnaround has been astonishing.

And given that so many market participants cut their teeth in a long era of docile inflation, cheap money and ever-flowing credit, it’s no wonder that so many should be keen that the Fed does indeed pivot as soon as possible. The thing about Golden Ages is that people always want them back.

But that doesn’t mean they come back. Of course, the key to whether or not the Fed will, in fact, pivot, will be found in the inflation data. And the picture there is still very unclear.

Boosted by a number of factors, from the war in Ukraine through to Covid’s supply-chain havoc and a general rethink of the previously dominant trend toward ever-more globalization, prices surged in 2022 by measures not seen for fully 40 years. The US was not alone in facing this gale, of course. Other countries did so too, and some had it a lot worse. Inflation has run hotter in Europe thanks among other factors to its energy dependence on Russia.

Even Japan has seen a resurgence of pricing power, where inflation has been thought dead for decades.
image2.png

But the US still runs the table, and it’s the success of the US response which will matter most. And there are some encouraging signs. The Fed’s preferred measure of inflation continued to slacken in November, providing another indicator that price pressures may indeed have peaked earlier in the year.

The Personal Consumption Expenditures price index, or PCE, rose 5.5% on the year, well below the 6.1% rise seen just a month earlier. The core measure, which cuts out the volatile effects of food and energy costs, was up by a more reassuring 4.7% annualized. Both readings were at their lowest since October 2021.

The release chimes with official Consumer Price Index data for the same month, which showed a similar slackening.

Nevertheless, price rises there still stand at 7.1%, which is a very long way indeed from the 2% rate targeted by the Fed. Moreover, the US central bank’s mandate is to promote stable prices and maximum employment. There may not be many active in the markets today who remember the inflationary pressures of the 1970s and early 1980s. However, there will be many in the Fed who do remember them, and how hard-won the victory was. The monetarist students at the US central bank will be only too aware that they can’t afford to end the rate rising process until inflation – and as importantly, inflation expectations – have been actually and obviously seen to be crushed.

Top Trading Opportunities in Q2

Top Trading Opportunities in Q2
Recommended by David Cottle
Get Your Free Top Trading Opportunities Forecast
Get My Guide

Hence, we see things like stocks falling despite robust Gross Domestic Product numbers. Investors are seeing everything through the inflation prism, and any sign that the Fed’s action has yet to clearly cool economic activity just has investors ever-more convinced that the pivot is not here yet.

5.5% inflation may be better than 6.1%, but it’s still outrunning the Fed’s target by a huge amount, and there’s simply no way policymakers are going to stop fighting while that’s the case. Chair Jerome Powell and the rest of the Open Market Committee well know that their success in getting inflation down will define their time.

Many commentators think we might get very close to pivot territory by the late spring of next year, but in truth we’d probably have to see a marked moderation in wage momentum and, probably, employment growth. Both have remained surprisingly strong despite the Fed’s actions.

Inflation also has a nasty tendency to get sticky. Faced with rising prices, employees demand higher wages, which only add to cost pressures at a time when there’s usually little option but to pass these on again to consumers. And so on…

The upshot of all this is that it could yet be a very long time before the Fed actually does ‘pivot,’ and any prognosis that such a thing could happen in the early part of 2023 depends on evidence of a pretty rapid economic slowdown coming soon. If the economic data don’t start to support this thesis unambiguously in the early months of the year, then the waiting for the pivot could prove a much longer game than many in the markets now hope it’ll be.

Gold (XAU/USD) Within Touching Distance of a New All-Time High

Gold (XAU/USD) Within Touching Distance of a New All-Time High

US dollar weakness and a growing realization that US interest rates have either peaked or are very close to their pinnacle continue to drive gold ever higher. A fresh all-time high is within reach and this will likely draw additional attention to the precious metal.

The US dollar is under pressure as traders continue to price in interest rate cut probabilities for later this year. The current Fed Fund rate of 475-500 is currently seen moving 25bps higher to 500-525 at the May FOMC meeting, staying at that level in June before rate cuts start in July. The latest CME Fed Fund projections predict that Fed Funds will be at 425-450 by the end of the year. This expected loosening of Fed monetary policy is weighing on the US dollar, especially against other currencies that are still in tightening mode. The Euro is one such currency and ECB chatter continues to suggest that the central bank will continue hiking rates to counter inflation. The Euro accounts for nearly 58% of the US dollar index – a basket of six currencies used to value the US dollar – and with the ECB still in tightening mode, the value of the greenback looks likely to fall further.

US Dollar Index Daily Price Chart – April 14, 2023

image1.png

Later in today’s session, we have two important US economic releases, retail sales, and Michigan consumer confidence. Retail sales data is an important gauge of high street activity, while the Michigan consumer sentiment report is an important measure of consumer expectations, prospects, and their economic outlook. Both can move the market if expectations are missed or beaten by a margin.

image2.png

For all market-moving data releases and events, see the DailyFX Economic Calendar

Pennant Patterns: Trading Bearish and Bullish Pennants

Gold currently changes hands just below $2,040/oz, up nearly $60/oz. from this week’s low print. In recent articles I have noted the formation of a bullish pennant pattern on the daily gold chart and this continues to drive technical price action. If this formation continues, then the all-time high at $2,075/0z. will come under pressure. Short-term support is seen at around $2,032/oz. before $2,009/oz.

Gold Price Daily Chart – April 14, 2023

image3.png

Charts via TradingView

US Dollar Price Forecast: US Jobless Claims and PPI May add to USD Weakness

US Dollar Price Forecast: US Jobless Claims and PPI May add to USD Weakness

US Disinflation Continues but Core Remains Sticky, Elevating Chances of a May Hike

Markets appeared to view yesterday’s CPI data with a myopic view, choosing only to see the massive progress on the headline print whilst ignoring the present issue that is core inflation. Headline inflation dropped an entire percentage point in the year-on-year print for March, but core actually rose 0.1% over the same comparative timeframe – highlighting the difficulty in taming widespread price pressures.

image1.png

USD (DXY) Technical Analysis

Markets appeared motivated to sell dollars, particularly at a time when the euro appears more favourable. The ECB contemplates whether to hike the policy rate by 25 or 50 basis points in May, supporting EUR/USD which makes up the majority of the US dollar basket.

DXY appears on track to test 101.30 – a level of relevance in April and May of last year, as well as February this year. With market expectations of at least one rate cut before year end, the dollar remains vulnerable to further downside and could even test the psychological level of 100.

The dollar does, however, have the added benefit of safe-haven appeal in the event of a return to instability in the banking sector or should recession risks gain pace. The Fed, according to the latest projections envisions the potential for a shallow recession in the second half of the year. Resistance lies all the way up at 103.00, with 105.63 the next level of resistance.

US Dollar Basket (DXY) Daily Chart

image2.png

Source: TradingView, prepared by Richard Snow

The weekly chart below helps to frame the current bear trend in the context of historical price action and helps to identify possible longer-term levels of support. Interestingly enough, before the 100 level, is a fair bit of support around 100.85 and then another level of support at 99.65.

US Dollar Basket (DXY) Weekly Chart

image3.png

Source: TradingView, prepared by Richard Snow

Implied Path of Fed Funds Rate Points Lower

Market expectations have evolved to show a likelihood of another 25 bps hike before the supposed cuts come into play later this year, despite the Fed suggesting there will be no rate cuts in 2023. The initial pessimism arose during the banking turmoil which has largely subsided.

Gold Q2 2023 Technical Forecast: Uncertainty Lies Ahead for XAU/USD

Gold Q2 2023 Technical Forecast: Uncertainty Lies Ahead for XAU/USD

The fundamental backdrop for gold as we head into Q2 of 2023 may be shifting by way of a less hawkish Federal Reserve. That being said, calling a dovish Fed may be too early to call with other economic factors creating a push/pull effect for the US central back, thus making their job that much harder to achieve price stability.

XAU/USD TECHNICAL ANALYSIS

SPOT GOLD WEEKLY CHART

image1.png

Chart prepared by Warren Venketas, IG

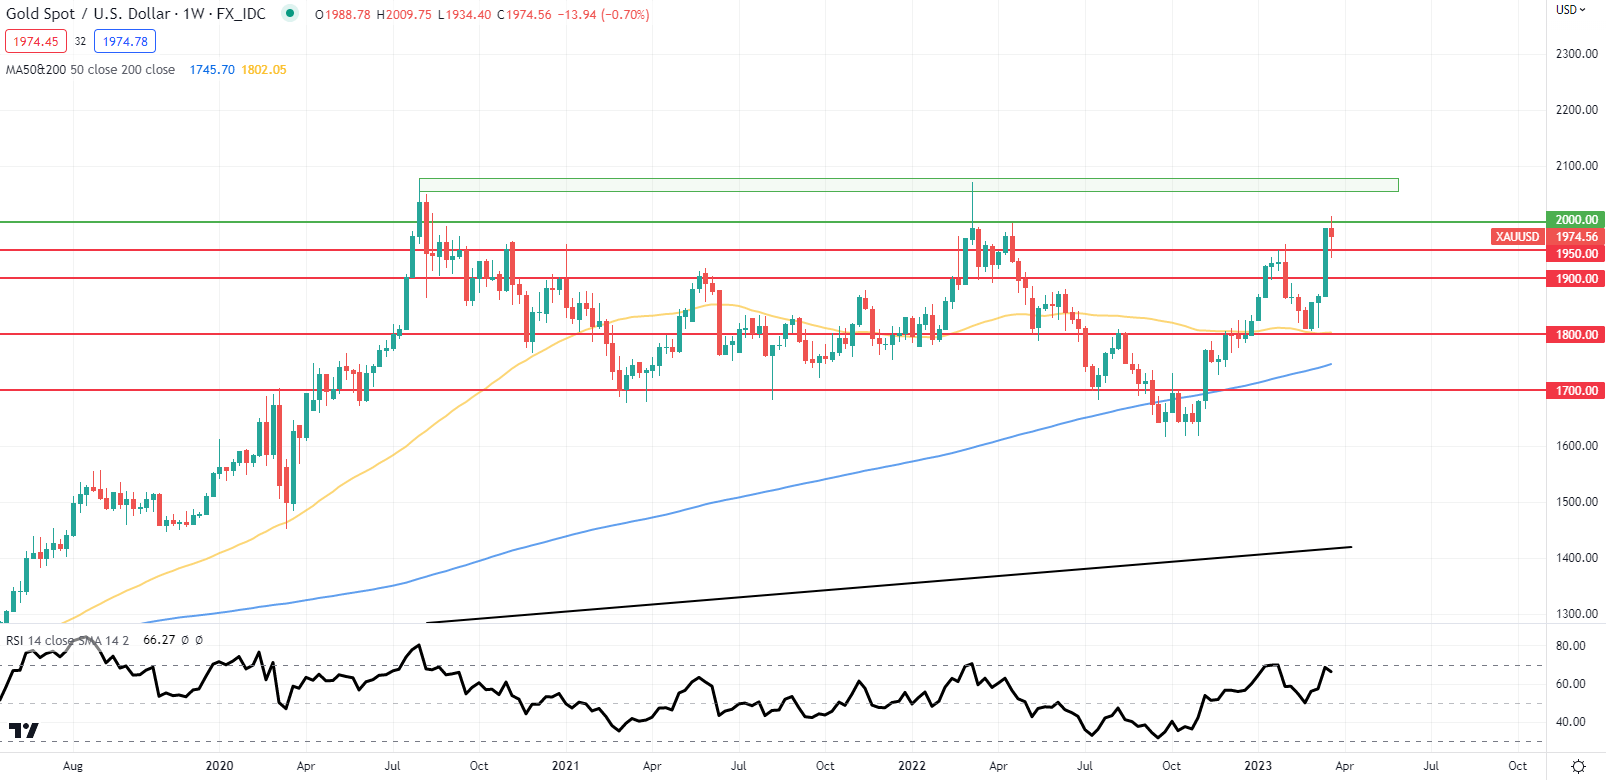
Looking at the longer-term weekly chart for gold, the 1950.00 resistance handle (now support) has been breached for the second time this year. With more conviction this tie round, a rally up towards the 2070 2075 zone (green) is not unlikely. If we look at the Relative Strength Index (RSI), there are signs of bearish divergence and could indicate a possible move lower as price action and the RSI extend their opposing travels. Although an initial move higher is on the cards, by the end of Q2 there may well be a pullback towards 1950 and beyond. The 50-day (yellow) and 200-day (blue) moving averages are quietly converging and may form a death cross in due course, once again exposing XAU/USD to further downside.

SPOT GOLD DAILY CHART

image2.png

Chart prepared by Warren Venketas, IG

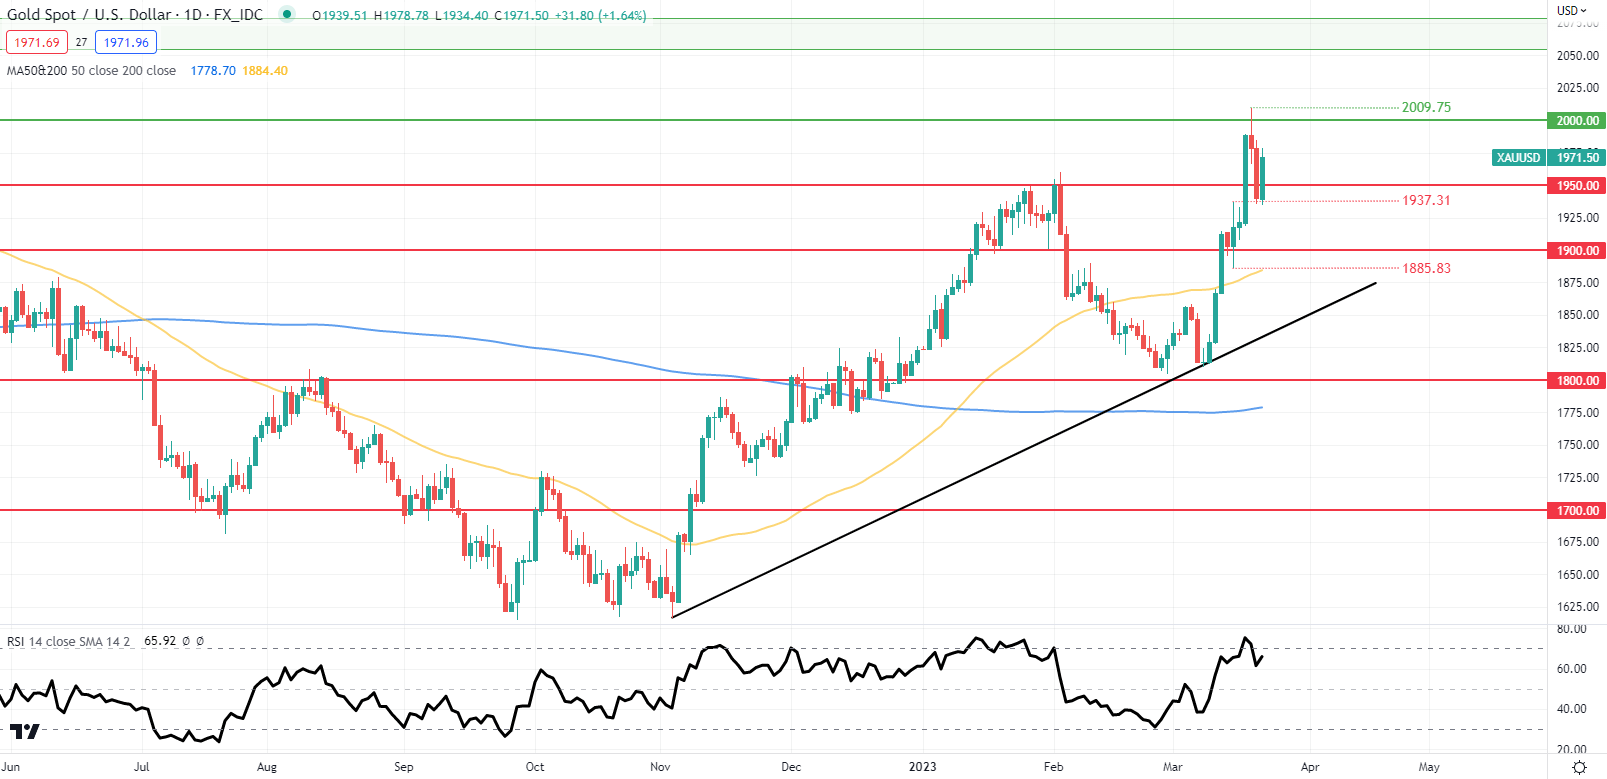
Focusing in on the daily chart above, the short-term bias remains firmly in favor of gold bears with the RSI in overbought territory. The difficulty lies in forecasting over a 3 month period and with so much impactful economic data to come, the long-term outlook can be blurry. Revising the technical analysis above periodically will ensure a fresh look as and when new data hits the market, giving a more accurate viewpoint. My personal view should see gold persist between the 1900 – 2100 zones leaving Q3 with the potential to move the needle in a more significant manner.

Key resistance levels:

-2070.00 – 2075.00

-2009.75

-2000.00

Key support levels:

-1950.00

-1937.31

-1900.00

-1885.83/50-day SMA

-Trendline support

IRS warns of deadline to claim $1.5B in 2019 tax refunds: These states are owed the most

IRS warns of deadline to claim $1.5B in 2019 tax refunds: These states are owed the most

The Internal Revenue Service estimates that there is almost $1.5 billion in unclaimed refunds from tax year 2019, but the deadline to secure that money is nearing.

Taxpayers have until July 17 to submit a tax return and get the money they are owed. The IRS said in a news release that the average median refund for that year is $893.

“The 2019 tax returns came due during the pandemic, and many people may have overlooked or forgotten about these refunds,” said IRS Commissioner Danny Werfel. “We want taxpayers to claim these refunds, but time is running out. People face a July 17 deadline to file their returns. We recommend taxpayers start soon to make sure they don’t miss out.”

The three years allotted for filing a tax return and collecting a refund were extended past the April tax deadline because of the COVID-19 pandemic. Any funds that aren’t claimed by the deadline will belong to the U.S. Treasury.

“The three year limit by itself isn’t anything new, but the IRS deadline has extra importance this year because tax year 2019 returns were filed right as the pandemic hit and shut down tax offices,” tax attorney Adam Brewer told Nexstar. “I suspect the IRS owes money to taxpayers in two camps – those that were so impacted by the pandemic that they never filed and those that filed paper returns that were never processed by the IRS. No matter what side you find yourself on, file a return by the deadline, send it certified so you can confirm it was received, and be persistent if you don’t hear back from the IRS.”

This year the IRS broke out the data to show which states have the highest potential refunds awaiting taxpayers:

The IRS also reminded taxpayers that they may have missed out on certain credits that they would have received had they filed, such as the Earned Income Tax Credit, which can be worth as much as $6,557. The credit is designed to aid individuals and families with income below a certain level.

“With the pandemic taking place when the 2019 tax returns were originally due, people faced extremely unusual situations. People may have simply forgotten about tax refunds with the deadline that year postponed all the way into July,” Werfel said. “We frequently see students, part-time workers and others with little income overlook filing a tax return and never realize they may be owed a refund. We encourage people to review their records and start gathering records now, so they don’t run the risk of missing the July deadline.”

US CPI, Fed Minutes to Weigh on US dollar: What’s Next For EUR/USD, GBP/USD, USD/JPY?

US CPI, Fed Minutes to Weigh on US dollar: What’s Next For EUR/USD, GBP/USD, USD/JPY?

Softening US price pressures could weigh on the US dollar even as the US Federal Reserve expects a recession this year as a fallout from the turmoil in the banking sector.

US CPI rose 0.1% on-month in March, down from a 0.4% increase in February, and 5.0% on-year last month compared with 6.0% in February. However, price pressures are not sufficiently weak, said Richmond Fed President Thomas Barkin, suggesting the Fed could proceed with one more hike in May. Barkin’s remarks were echoed by San Francisco Fed President Mary Daly on Wednesday that the Fed has “more work to do”.

US Dollar Index (DXY Index) Weekly Chart

image1.png

Chart Created Using TradingView

Furthermore, minutes from the FOMC meeting in March showed several policymakers considered pausing interest rate increases, but concluded high inflation needed to be tackled, even after a forecast from Fed staff showed that banking sector stress would tip the economy into a mild recession. Interest rate markets are pricing in about a 68% chance that the Fed will raise rates by an additional 25 basis points at its May 2-3 meeting, according to CME’s FedWatch tool.

EUR/USD Daily Chart

image2.png

Chart Created Using TradingView

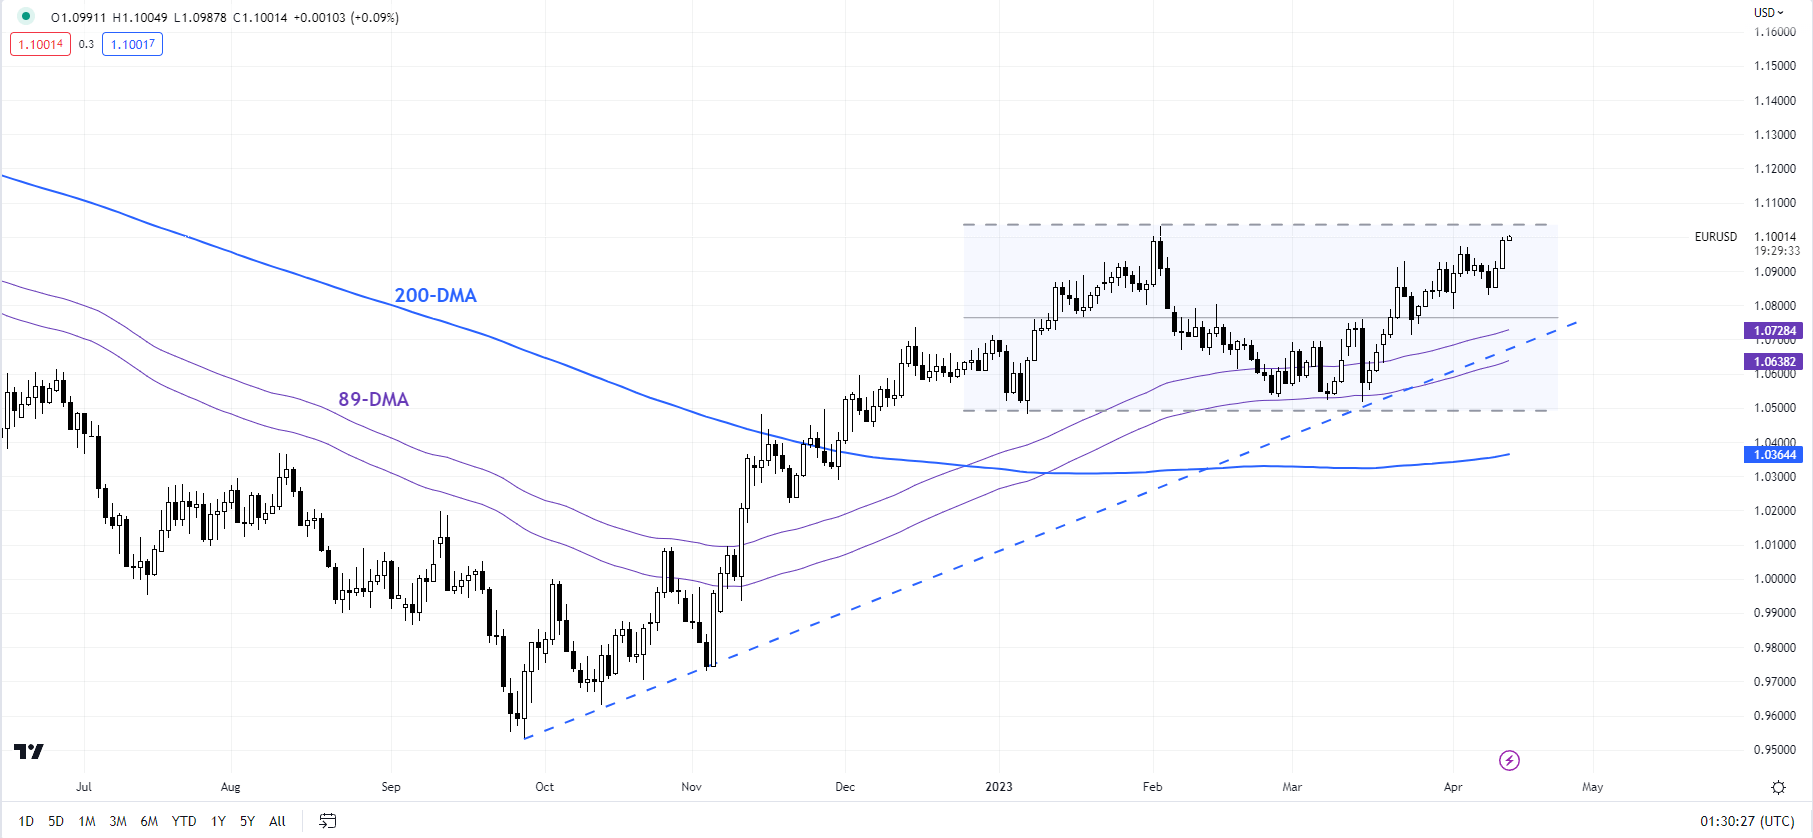
EUR: Flirts with key resistance at 1.10

Upward momentum is improving as EUR/USD tests a vital ceiling at the February high of 1.1035 – the ‘two-steps-forward-one-step-backward’ nature of the price action since late March is a sign of how important the resistance is. A break above the barrier could initially open the door toward the 200-week moving average (now at about 1.1200). As highlighted in the previous update, EUR/USD’s trend remains up after it in March held key support at the January low of 1.0480.

GBP/USD Daily Chart

image3.png

Chart Created Using TradingView

GBP: Slowly but surely

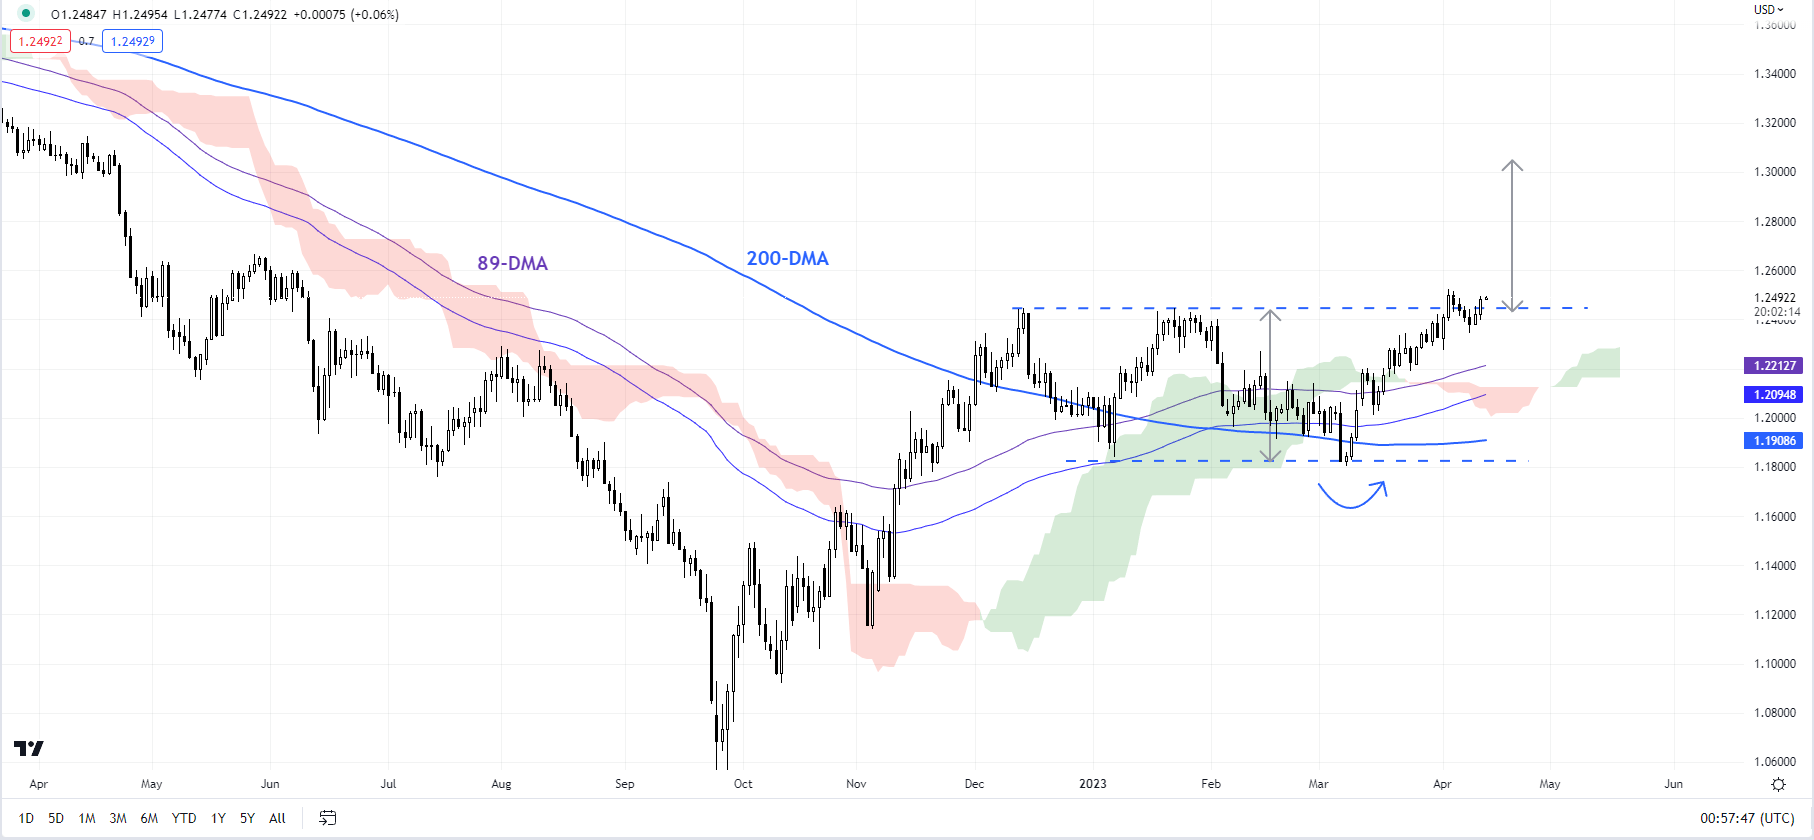
GBP/USD is once again flirting with the December high of 1.2450. A decisive break above the resistance would trigger a breakout from the sideway channel since December. The width of the channel would point to a move toward 1.3000. As the previous update highlighted, GBP/USD’s trend remains up following the rebound in March from a crucial floor at the January low of 1.1840, coinciding with the 200-day moving average.

USD/JPY Daily Chart

image4.png

Chart Created Using TradingView

USD/JPY: Struggles to extend gains

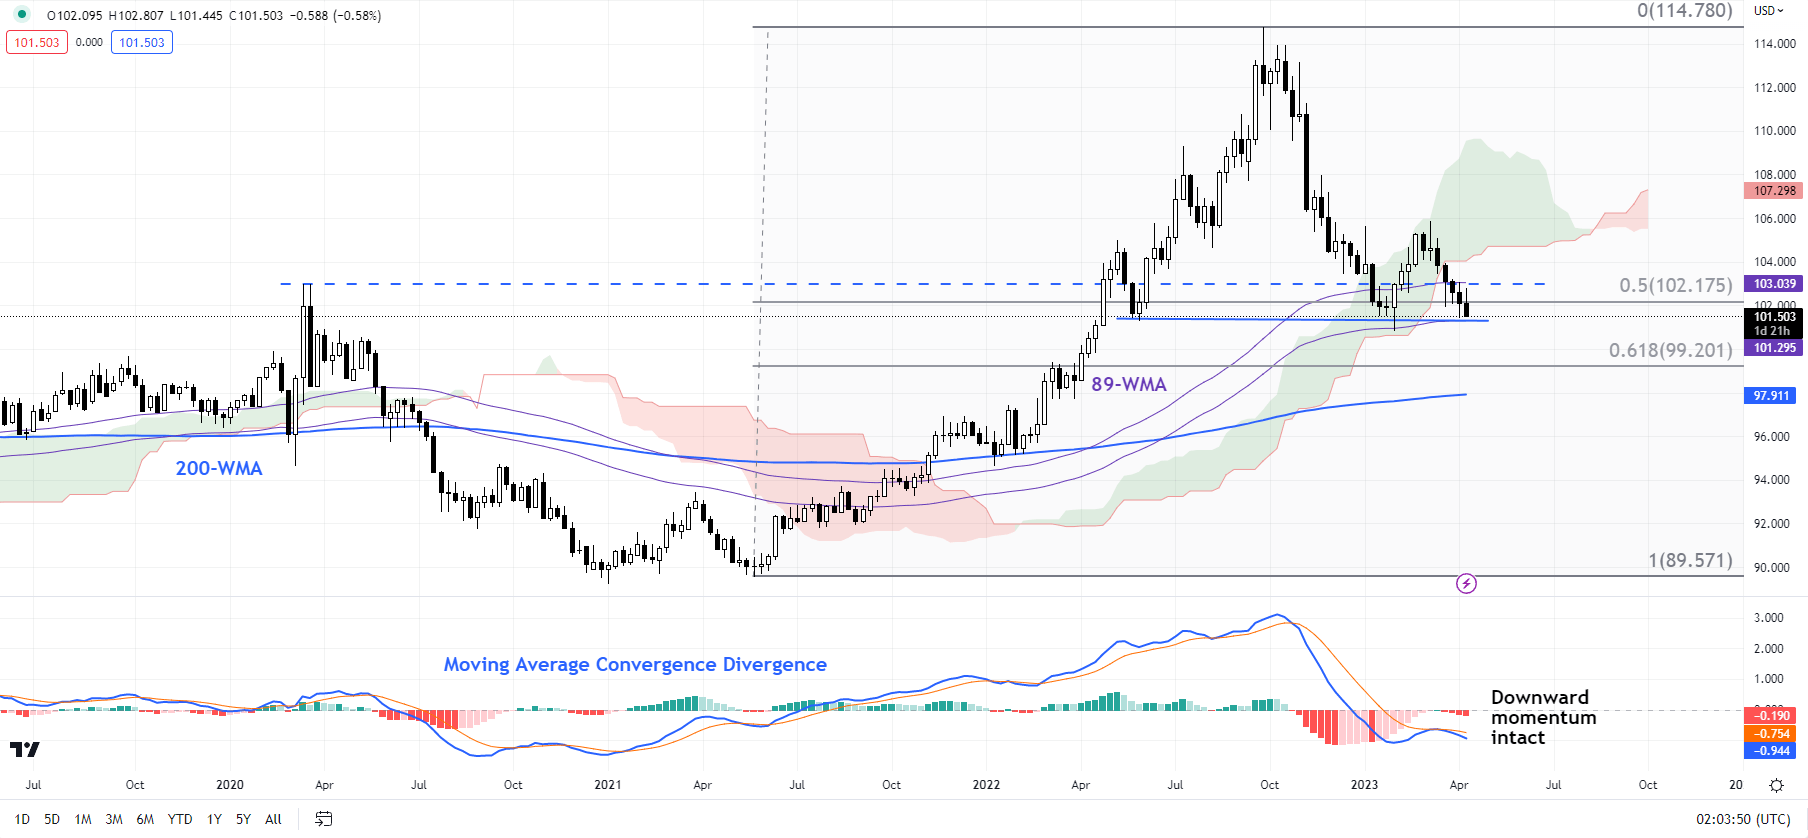
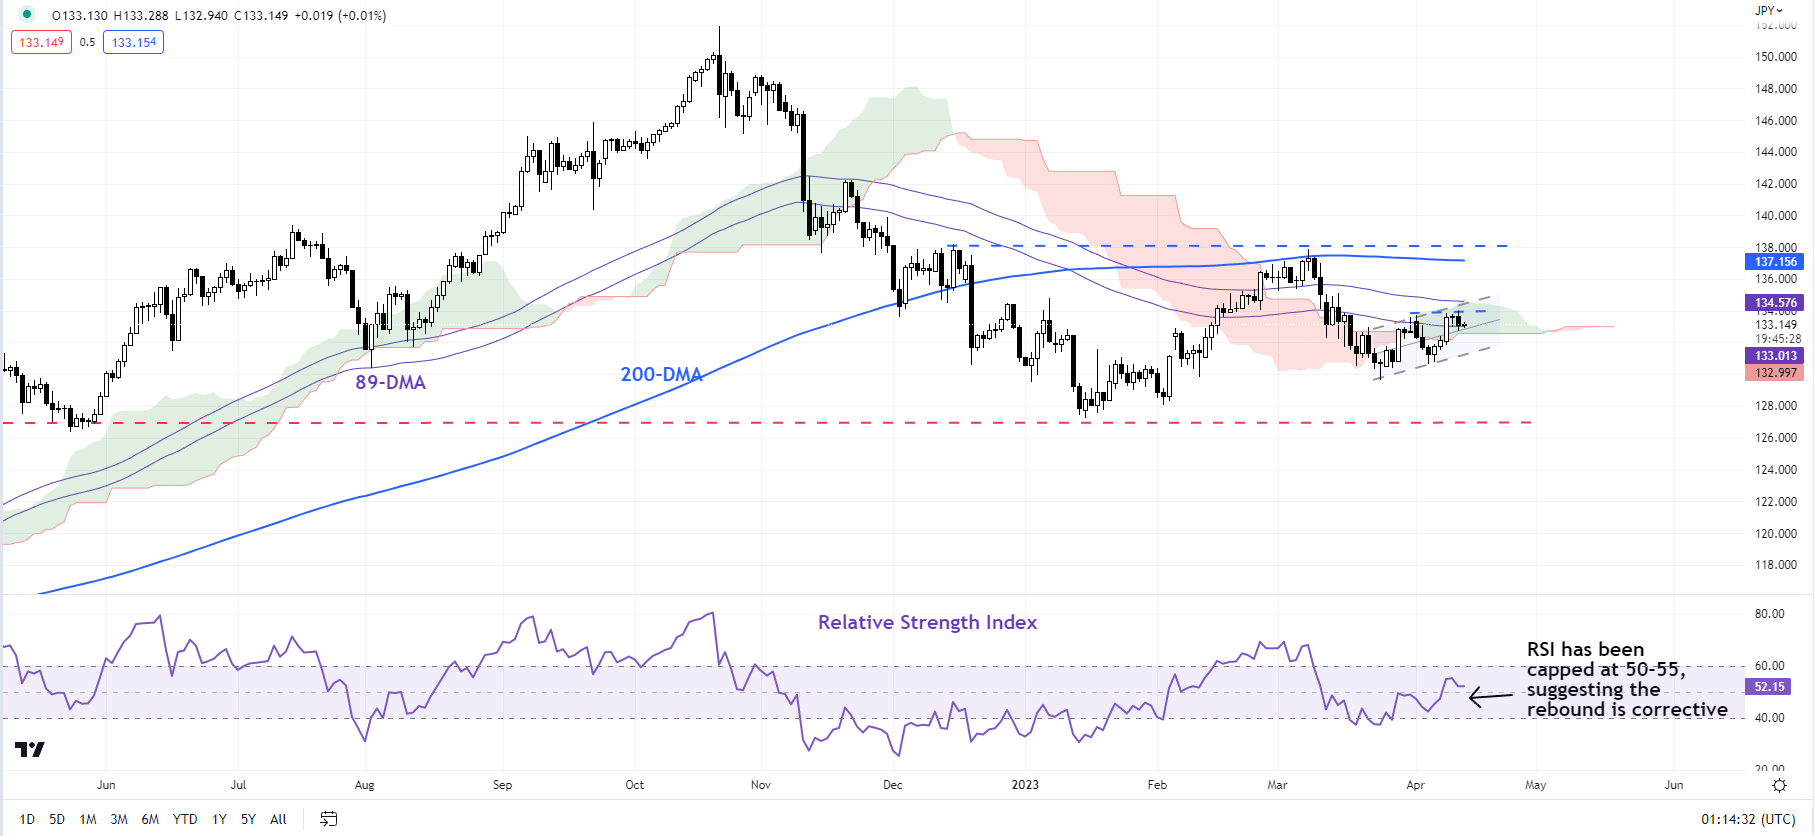
In recent days, USD/JPY has struggled to clear a tough hurdle at the April 3 high of 133.75, coinciding with the 89-day moving average and the upper edge of the Ichimoku cloud on the daily charts. Since the consolidation that began in late March, the 14-day Relative Strength Index (RSI) continues to be capped at 50-55 – corrective rebounds tend to run out of steam at 50-55 levels of the RSI. Still, a decisive cross above 133.75 would confirm that the immediate downward pressure had faded for now, raising the prospect of a broad range of 129-138.

British Pound Latest – GBP/USD Moves Higher on Mixed GDP Data, US Dollar Weakness

British Pound Latest – GBP/USD Moves Higher on Mixed GDP Data, US Dollar Weakness

The UK economy stood still in February as industrial action in various areas of the services sector contributed to UK growth flatlining. The latest Office for National Statistics (ONS) monthly GDP data showed no growth in February with the services sector falling by 0.1% compared to a revised higher 0.7% growth in January. According to the ONS, ‘the largest contributions to the fall in services output in February 2023 came from education and public administration and defence: compulsory social security, industrial action took place in both of these industries in February 2023’.

image1.png

According to the ONS, monthly GDP is now estimated to be 0.3% above its pre-coronavirus levels in February 2020.

image2.png

GBP/USD is getting a small lift from today’s UK data and from a marginally weaker US dollar. The greenback fell yesterday after US headline inflation fell for the ninth month in a row to 5%, vs expectations of 5.2%. While inflation slowly falls, the US economy may enter a mild recession, according to yesterday’s FOMC minutes. According to the report, the recent banking crisis may push the economy into a mild recession later in the year due to tighter bank lending conditions. While this will slowdown economic activity, it will also weigh on inflation.

GBP/USD is now testing 1.2500 again and a break higher will see 1.2525 come into play. Above here May 27, 2022 swing high at 1.2667 becomes the next level of interest. Initial support is seen at 1.2448, a prior level of resistance, before the 20-day moving average at 1.2355.

GBP/USD Daily Price Chart – April 13, 2023

image3.png

Retail Sentiment is Mixed

Retail trader data show 39.60% of traders are net-long with the ratio of traders short to long at 1.53 to 1.The number of traders net-long is 12.06% lower than yesterday and 4.17% higher than last week, while the number of traders net-short is 10.30% higher than yesterday and 3.66% lower than last week.

We typically take a contrarian view to crowd sentiment, and the fact traders are net-short suggests GBP/USD prices may continue to rise. Positioning is more net-short than yesterday but less net-short from last week. The combination of current sentiment and recent changes gives us a further mixed GBP/USD trading bias.