Major Bullish Break in KOSPI; ASX 200 Index’s Rally is Running into a Tough Barrier

Major Bullish Break in KOSPI; ASX 200 Index’s Rally is Running into a Tough Barrier

KOSPI COMPOSITE INDEX TECHNICAL OUTLOOK – BULLISH

KOSPI’s break higher this week indicates that South Korean equities could finally be catching up with some of its regional peers.

The South Korean benchmark index has risen above the marginally downward-sloping trendline from August triggering a major reverse head & shoulders pattern (the left shoulder is the mid-2022 low, the head is the September low, and the right shoulder is the early-January low), paving the way toward 2870. Interim resistance is at the end-May 2022 high of 2685.

KOSPI Daily Chart

image1.png

Chart Created by Manish Jaradi using TradingView

The bullish break has also coincided with a move above another key resistance, setting the stage for a higher-top-higher-bottom sequence (that is, an uptrend). Furthermore, the rise above the 200-day moving average for the first time since late 2021 is a sign that the multi-month downward pressure was fading.

KOSPI Daily Chart

image2.png

Chart Created by Manish Jaradi Using TradingView

On the downside, the index needs to hold above the March low of 2350, around the 200-day moving average for the nascent uptrend to remain intact.

ASX 200 TECHNICAL OUTLOOK – NEUTRAL

Australia ASX 200 index’s three-week-long rally looks set to pause as it runs into a stiff roadblock.

The index has staged a ‘V’-shaped rebound but is now testing the upper edge of the Ichimoku channel on the daily chart, roughly coinciding with the early-March high of 7370. The index needs to clear the 7325-7370 resistance area for the February-March downtrend to reverse.

ASX 200 INDEX Daily Chart

image3.png

Chart Created by Manish Jaradi using TradingView

Earlier last month, the index held above a strong support area: the 200-day moving average, coinciding with the early-January low of 6905, keeping the higher-top-higher-bottom sequence intact. Beyond the short term, the ASX 200 index continues to be in a broad range of 6400-7600 (see the weekly chart).

ASX 200 INDEX Weekly Chart

image4.png

Chart Created by Manish Jaradi Using TradingView

On the downside, the index has immediate support at Thursday’s low of 7200. Any break below could indicate that the three-week-long upward pressure had faded.

British Pound (GBP/USD) Forecast Led by US CPI, FOMC Minutes and Gov Bailey

British Pound (GBP/USD) Forecast Led by US CPI, FOMC Minutes and Gov Bailey

GBP/USD FUNDAMENTAL BACKDROP

The pound is tracking marginally higher this Wednesday morning ahead of three key potential economic drivers (refer to economic calendar below). The first being US CPI that has been dominating global market headlines and could set the tone short-term. Following on from last week’s strong US Non-Farm Payroll (NFP) report, elevated inflation figures today could sustain a more hawkish narrative going forward and limit GBP upside. The second high impact event stems from the FOMC minutes which is unlikely to have as much bearing on the market as the CPI report but it will interesting to understand the thinking behind the decision to hike interest rates in such a tumultuous period during the height of the recent banking crisis. I will be looking out for any mention of rate cuts in the second half of this year which may bring some relief for the pound.

GBP/USD ECONOMIC CALENDAR

image1.png

From a UK perspective, Governor Bailey is scheduled to speak in Washington today with markets keenly awaiting on guidance for the BOE’s upcoming meeting – currently favored for a 25bps hike (see table below). Taking into account other major central banks have paused their hiking cycle, there is a chance that the BOE may follow suit considering the UK’s large financial sector and weak economic growth forecast by the IMF yesterday.

The BOE’s Monetary Policy Committee (MPC) has also just added a new external member for a three year period beginning on the 5th of July 2023. Megan Greene has replaced the BOE’s most dovish member Silvana Trenreyro and will add an interesting dynamic to the committee.

BANK OF ENGLAND INTEREST RATE PROBABILITIES

image2.png

TECHNICAL ANALYSIS

GBP/USD DAILY CHART

image3.png

Technically, price action on the daily GBP/USD chart shows a Relative Strength Index (RSI), hovering near overbought territory. In the event of a CPI miss, I cannot see cable maintaining levels above 1.2500 for very long. The pair continues to trade within an upward trending channel (black) and a break below channel support could spark a sell-off below the 1.2400 psychological level and beyond.

Key resistance levels:

  • 1.2667
  • 1.2500

Key support levels:

  • 1.2400/channel support
  • 1.2345

MIXED IG CLIENT SENTIMENT

IG Client Sentiment Data (IGCS) shows retail traders are currently SHORT on GBP/USD, with 55% of traders currently holding short positions (as of this writing). At DailyFX we typically take a contrarian view to crowd sentiment; however, due to recent changes in long and short positioning we arrive at a short-term cautious disposition.

US Dollar Gives up Ground Ahead of CPI Data and Japanese Yen Also Slips

US Dollar Gives up Ground Ahead of CPI Data and Japanese Yen Also Slips

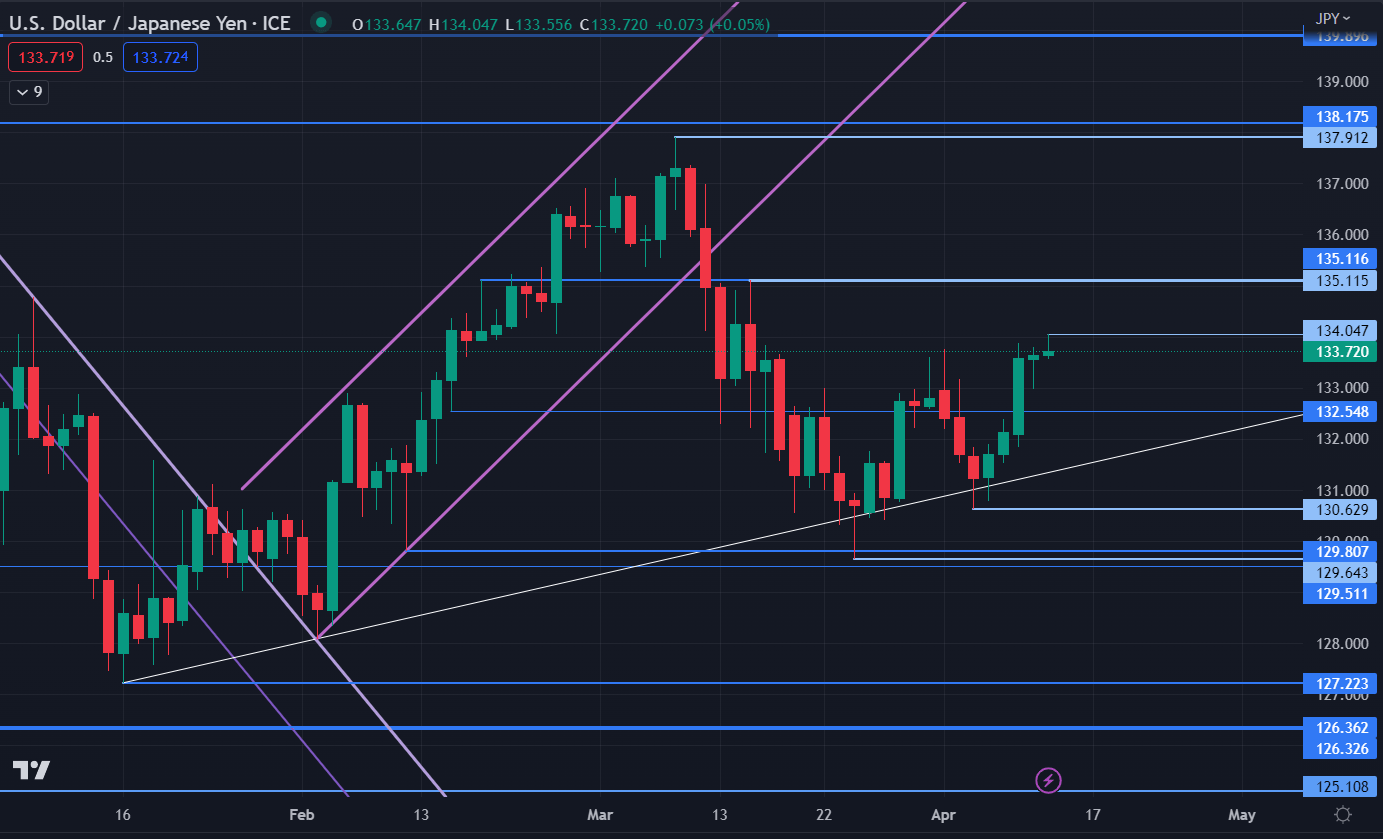
The US Dollar dipped in the Asian session ahead of US CPI data due out later today. Most currency pairs appear to be in somewhat of a holding pattern, except for USD/JPY. It leapt to a new high for the month above 134.00,

Most APAC equity indices saw slight gains on Wednesday although Hong Kong’s Hang Seng Index (HSI) slipped into the red.

Tencent weighed on the index after it was revealed that the large tech investor, Prosus, was preparing to sell a slice of its investment that would be around 1% of the market cap.

US Treasury Secretary Janet Yellen believes that the world’s largest economy is performing exceptionally well while a couple of Fed speakers appear to be at odds with each over potential further rate hikes from the bank.

New York Fed President John Williams saw scope for another hike to rein in inflation and Minneapolis Fed President Neel Kashkari maintained his hawkish credentials in comments overnight.

Conversely, Chicago Fed President Austan Goolsbee hinted toward a dovish stance citing the recent banking crisis and IMF’s latest report as a reason to be cautious with monetary policy. He was joined by Philadelphia Federal Reserve Bank President Patrick Harker that could also be seen as less hawkish.

Nonetheless, US CPI will be watched closely later today for more definitive clues on the Fed’s rate path. Interest rate markets are pricing a better-than-even chance of a lift to the target cash rate at the next Federal Open Market Committee (FOMC) meeting in early May.

The WTI futures contract is near USD 81.50 bbl while the Brent contract is a touch above USD 85.50 bbl.

Silver made a 12-month high today above USD 25.40 a Troy ounce. Gold is also eyeing last week’s peak of USD 2,032 per ounce

Looking ahead, after the US CPI print, the Bank of Canada will be making its decision on interest rates. According to a Bloomberg survey of economists, the bank is anticipated to maintain rates at 4.50%

USD/JPY TECHNICAL ANALYSIS

USD/JPY remains above an ascending trend despite trying to move below it last week.

Resistance might be at the breakpoint of 135.12 or further up at the prior peaks of 137.91 and 138.18.

On the downside, support could be at the previous lows of 130.63, 129.81 and 129.64.

image1.png


AUD/USD clings to gains near 0.6670 area amid softer USD, upside seems limited

AUD/USD clings to gains near 0.6670 area amid softer USD, upside seems limited

The AUD/USD pair attracts some buyers on Tuesday and snaps a five-day losing streak to over a three-week low, around the 0.6620 region touched the previous day. The pair maintains its bid tone through the early part of the European session and is currently placed near the top end of the daily trading range, around the 0.6665-0.6670 area, up nearly 0.50% for the day.

The Australian Dollar gets a goodish lift after domestic data indicated an improvement in consumer sentiment in the wake of the Reserve Bank of Australia’s (RBA) rate-hike pause earlier this month. In fact, the Westpac-Melbourne Institute Consumer Sentiment index bounced from near-record lows and jumped 9.4% to 85.8 in early April, recording its fastest rise since late-2020. Adding to this, the National Australia Bank Business Confidence Index improved to -1 from -4 previously, suggesting that the economy is still holding up.

Apart from this, a generally positive tone around the equity markets undermines the safe-haven US Dollar (USD) and further benefits the risk-sensitive Aussie. The USD downtick, however, is likely to remain cushioned amid speculations that the Federal Reserve (Fed) may continue raising interest rates. In fact, the current market pricing indicates a greater chance of a 25 bps lift-off at the next FOMC monetary policy meeting in May and the bets were lifted by the mostly upbeat US employment details (NFP) released on Friday.

The prospects for further policy tightening by the Fed, meanwhile, puts a floor under the US Treasury bond yields, which should further act as a tailwind for the Greenback and contribute to capping gains for the AUD/USD pair. Traders might also refrain from placing aggressive bets and prefer to wait for this week’s important releases from the US – the latest consumer inflation figures and the FOMC meeting minutes on Wednesday. This, along with the US Retail Sales data on Friday, will influence the near-term USD price dynamics.

In the meantime, the US bond yields will drive the USD demand and provide some impetus to the AUD/USD pair. Traders will further take cues from the broader risk sentiment to grab short-term opportunities. Nevertheless, the fundamental backdrop makes it prudent to wait for strong follow-through buying before confirming that the recent rejection slide from the 100-day Simple Moving Average (SMA) has run its course.

GBP/USD rises above 1.2400 amid US Dollar pullback

GBP/USD rises above 1.2400 amid US Dollar pullback

GBP/USD is gaining some positive traction above 1.2400 in the early European morning. Markets stay cheerful and dull the US Dollar’s attractiveness as a safe haven. Traders could resort to repositioning ahead of Wednesday’s key US inflation data.

The Sterling Pound gets an additional lift after British Retail Consortium (BRC) reported that like-for-like retail sales rose by 4.9% in March and the total retail spending increased by 5.1% YoY during the reported month. The upside for the GBP/USD pair, however, seems limited in the wake of the recent mixed signals from the Bank of England (BoE) members over the next policy move. It is worth recalling that the BoE MPC member Silvana Tenreyro advocated for consideration of cutting rates sooner than thought as the absence of cost-push shocks would bring down inflation well below targets. In contrast, the BoE Chief Economist Huw Pill said that action is still needed in assessing inflation prospects and that the onus remains on ensuring enough policy tightening is delivered to see the job through. This warrants some caution for bullish traders.

Moving ahead, there isn’t any major market-moving economic data due for release on Tuesday, either from the UK or the US. Hence, the broader risk sentiment and the US bond yields will drive the USD demand, which, in turn, should provide some impetus to the GBP/USD pair. Meanwhile, the aforementioned fundamental backdrop makes it prudent to wait for strong follow-through buying before confirming that the recent pullback from the highest level since June 2022 has run its course and positioning for additional gains.

After having closed in negative territory on Friday, GBP/USD has managed to stage a rebound early Monday. The pair seems to have stabilized above 1.2400 on Easter Monday but it is likely to fluctuate in a tight range amid subdued market action.

The US Bureau of Labor Statistics reported on Friday that Nonfarm Payrolls (NFP) in the US increased by 236,000 in March, compared to the market estimate of 240,000. The Unemployment Rate declined to 3.5% from 3.6% and the Labor Force Participation Rate edged higher to 62.6% from 62.5%. Furthermore, annual wage inflation, as measured by the Average Hourly Earnings, fell to 4.2% from 4.6%.

The immediate market reaction to the US jobs report triggered a rebound in the US Treasury bond yields and provided a boost to the US Dollar, forcing GBP/USD to stretch lower ahead of the weekend.

According to the CME Group FedWatch Tool, markets are currently pricing in a 60% probability of the US Federal Reserve hiking its policy rate by 25 basis points at the next policy meeting, down from 71% on Friday.

In case US yields turn south in the American session, GBP/USD could extend its recovery. On the other hand, a negative opening in Wall Street’s main indexes should help the US Dollar find demand and cap the pair’s upside.

It’s worth noting that ahead of Wednesday’s March Consumer Price Index (CPI) data from the US on Wednesday, investors could opt to remain on the sidelines and make it difficult for GBP/USD to find direction.

USD/JPY Bulls to Target 135 on Monetary Policy Divergence

USD/JPY Bulls to Target 135 on Monetary Policy Divergence

It is a quiet morning for the USD/JPY. There are no economic indicators from Japan to impact the USD/JPY. The lack of stats will leave inflation figures from China and geopolitics to influence.

On Monday, the shift in sentiment toward Fed monetary policy, fueled by the US Jobs Report, supported a return to 133. With Bank of Japan Governor Ueda delivering assurances of a status quo on ultraloose monetary policy, policy divergence remains in favor of the Greenback.

Trading Derivatives carries a high level of risk to your capital and you should only trade with money you can afford to lose. Trading Derivatives may not be suitable for all investors, so please ensure that you fully understand the risks involved, and seek independent advice if necessary. A Product Disclosure Statement (PDS) can be obtained either from this website or on request from our offices and should be considered before entering into a transaction with us. Raw Spread accounts offer spreads from 0.0 pips with a commission charge of USD $3.50 per 100k traded. Standard account offer spreads from 1 pips with no additional commission charges. Spreads on CFD indices start at 0.4 points. The information on this site is not directed at residents in any country or jurisdiction where such distribution or use would be contrary to local law or regulation.

Bank of Japan Governor Ueda had this to say on monetary policy,“If the BoJ suddenly realizes that inflation will stably and sustainably hit 2% and decides to normalize monetary policy, it will have to make very big policy adjustments. That will cause big disruptions in the economy and markets, so it’s important to make pre-emptive and appropriate decisions.”

USD/JPY Price Action

This morning, the USD/JPY was down 0.03% to 133.543. A range-bound start to the day saw the USD/JPY fall to an early low of 133.494 before rising to a high of 133.624.

USD/JPY sees early red.
USDJPY 110423 Daily Chart

Technical Indicators

The USD/JPY must avoid falling through the 133.096 pivot to target the First Major Resistance Level (R1) at 134.360. A move through the Monday high of 133.870 would signal a bullish USD/JPY session. However, Fed chatter must support an extended USD/JPY breakout.

In the case of another extended rally, the bulls would likely test the Second Major Resistance Level (R2) at 135.135. The Third Major Resistance Level (R3) sits at 137.174.

A fall through the pivot would bring the First Major Support Level (S1) at 132.321 into play. However, barring a dollar sell-off, the USD/JPY pair should avoid sub-132 and the Second Major Support Level (S2) at 131.057. The Third Major Support Level (S3) sits at 129.018.

USD/JPY resistance levels in play above the pivot.
USDJPY 110423 Hourly ChartLooking at the EMAs and the 4-hourly chart, the EMAs send a bullish signal. The USD/JPY sits above the 200-day EMA (132.792). The 50-day EMA closed in on the 100-day EMA, with the 100-day EMA narrowing to the 200-day EMA, delivering bullish signals.

A USD/JPY hold above the 200-day EMA (132.792) would support a breakout from R1 (134.360) to give the bulls a run at R2 (135.135). However, a fall through the 200-day (132.792) would bring the 100-day EMA (132.428), S1 (132.321), and 50-day (132.264) into view. A fall through the 50-day EMA would send a bearish signal.

EMAs are bullish.
USDJPY 110423 4 Hourly Chart

The US Session

Looking ahead to the US session, it is a quiet day on the US economic calendar. There are no US economic indicators for investors to consider.

The lack of stats will leave Fed chatter and geopolitics to influence the afternoon session. However, we can expect investors to begin considering tomorrow’s CPI Report.

Saudi-U.S. Relations Sour Further On Huge OPEC+ Surprise Cut

Saudi-U.S. Relations Sour Further On Huge OPEC+ Surprise Cut

The surprise huge new cut in oil production from ‘OPEC+’ – the Saudi Arabia-led OPEC group of countries ‘plus’ Russia – highlights that any optimism over a possible rapprochement between Saudi Arabia and its previous key superpower ally, the U.S., is ill-founded. Instead, newly emboldened by the Beijing-brokered Saudi Arabia-Iran deal to resume relations, followed by the approval of a plan to join the Shanghai Cooperation Organisation (SCO) as a ‘dialogue partner’, Saudi Arabia has now decisively shifted into the China-Russia sphere of influence. Prior to the surprise additional oil production cut by OPEC+ announced on 2 April, early February had seen Saudi Arabia lead its OPEC fellow members and OPEC+ into sticking with its previously agreed oil production cuts quota of 2 million barrels per day (bpd). This cut represented only around 2 percent of the recent historical mean average of supply in the global oil market. Additionally, it left oil prices at levels that barely helped Saudi Arabia in budgetary terms at all, with a fiscal breakeven oil price forecast of US$78 pb of Brent in 2023, compared to over US$80 pb of Brent in the previous year. Significantly as well, oil prices at that point in February were way below the level that Russia wants, with a fiscal breakeven oil price of US$114 pb of Brent this year, up from around US$64 pb before its invasion of Ukraine. It was thought then by several oil market observers that the oil production in February by OPEC+ might have been a sign that Saudi Arabia was open to thawing out frozen relations with the U.S.

What changed between February and April was the Saudi Arabia-Iran resumption of relationship deal, brokered by China. Although at the time of the announcement of the deal, White House national security spokesperson, John Kirby, tersely observed that the deal done on 10 March between Iran and Saudi Arabia to re-establish relations “is not about China”, it absolutely was about China. What it absolutely was not about was the U.S. The biggest diplomatic coup in the Middle East since at least the signing of the Joint Comprehensive Plan of Action (JCPOA) between the P5+1 powers and Iran in 2015 had been brokered by China, without any involvement at all from the U.S., and every country in the world and in the Middle East knew it. The landmark deal between the two longstanding arch-regional enemies – Shia Iran and Sunni Saudi Arabia – was just the sort of far-reaching geopolitical coup that the U.S. had wanted to achieve in its ‘relationship normalisation deals’ program that had followed its unilateral withdrawal from the JCPOA in May 2018, as analysed in depth in my latest book on the global oil markets. In short, at that point more than any other of the major advances that the China-Russia axis has made in the Middle East, it was clear that this axis was winning the superpower battle for the Middle East and not the U.S. and its allies.

Related: Oil Prices Head Lower In Calmer Trade
Saudi Arabia and Russia know perfectly well that the U.S. and its major allies do not want oil prices over US$80 pb of Brent. For the U.S. and its allies, sustained oil prices above that level, and corollary rising gas prices, mean that inflation will remain higher for longer, which will keep interest rates higher for longer, which increases the threat of severe economic damage to net importers of either. For the U.S. these fears have very specific ramifications: one economic and one political, as also analysed in depth in my latest book on the global oil markets. The economic one is that historically every US$10 pb change in the price of crude oil results in a 25-30 cent change in the price of a gallon of gasoline, and for every 1 cent that the average price per gallon of gasoline rises, more than US$1 billion per year in consumer spending is lost and the U.S. economy suffers. The political one is that, according to statistics from the U.S.’s National Bureau of Economic Research, since the end of World War I in 2018, the sitting U.S. president has won re-election 11 times out of 11 if the U.S. economy was not in recession within two years of an upcoming election. However, sitting U.S. presidents who went into a re-election campaign with the economy in recession won only one time out of seven. This is not a position sitting President Joe Biden, or the Democratic Party, wants to be in one year out from the next U.S. election.

The U.S., since the end of the Second Oil Price War that ran from 2014-2016 – instigated by Saudi Arabia with the specific intention of destroying or disabling the threat from the then-nascent U.S. shale oil sector – has wanted oil prices in a Brent price range from US$40-45 pb on the floor to US$75-80 pb on the ceiling, as also analysed in depth in my latest book on the global oil markets. This ‘Trump Oil Price Range’ was set at the lower end to reflect the price at which most U.S. shale oil producers could breakeven and begin to make a decent profit at that stage (US$40-45 pb) and at the higher end to reflect the price at which the inflation/interest rate mix might begin to threaten the U.S. economy. For many years before the Second Oil Price War, Saudi Arabia’s budget breakeven Brent oil price was about US$80 pb and for many years after the War it was well over US$84 pb.

Given these economic and political necessities in the U.S. and its allies, former President, Donald Trump, rigorously enforced the price range. When Saudi Arabia (with the help of Russia) was pushing oil prices up over the US$80 pb of Brent level in the second half of 2018, President Trump sent a clear warning to Riyadh to stop doing this. In a speech before the United Nations General Assembly, Trump said: “OPEC and OPEC nations are, as usual, ripping off the rest of the world, and I don’t like it. Nobody should like it.” He added: “We defend many of these nations for nothing, and then they take advantage of us by giving us high oil prices. Not good. We want them to stop raising prices. We want them to start lowering prices and they must contribute substantially to military protection from now on.” As the Saudi Arabian- and Russian-led OPEC+ oil production cut agreement continued to push oil prices up in September 2018 to slightly over the ‘Trump Cap’, Trump made the same warning again, even more clearly at a rally in Southaven, Mississippi, in October 2018. He said: “And I love the king, King Salman, but I said, ‘King we’re protecting you. You might not be there for two weeks without us.’” In short, during Trump’s entire presidency, the ‘Trump Oil Price Range’ was breached only once for a period of around three weeks (toward the end of September 2018 to the middle of that October).

Saudi Arabia’s malleability at that point to Trump’s (and the U.S.’s) wishes for the oil price was due in very large part to the fact that it was still heavily reliant on the U.S.’s protection, principally from its main regional threat, Iran. At that stage, the U.S. and its allies could offer protection to Saudi Arabia from Iran through several methods. One was monitoring, as laid down in the Joint Comprehensive Plan of Action between the P5+1 group of nations (U.S., U.K., France, China, and Russia, ‘plus’ Germany) and Iran. Another method was U.S. and allied forces on the ground across the Middle East.

This leverage over Saudi Arabia ended, firstly with the U.S.’s unilateral withdrawal from the JCPOA and secondly with the Iran-backed Houthi attacks on Saudi Arabia’s key oil facilities in September 2019). Saudi Arabia was not then reassured either by the U.S.’s withdrawal from Syria (in 2019), Afghanistan (2021), and Iraq (2021). It was obvious to Saudi Arabia from the Iran-backed Houthi attacks on its oil facilities in September 2019 that it could not rely on the U.S. and its allies for its protection and alighted instead on Russia and China. Russia had already helped Saudi Arabia out by supporting it from the end of 2016 in the newly formed OPEC+ grouping, which was instrumental in allowing Saudi Arabia to rebuild its finances after the Second Oil Price War. China had made a face-saving offer to Saudi Arabia’s Crown Prince Mohammed bin Salman that he had never forgotten, as also analysed in depth in my latest book on the global oil markets. It is little wonder then that Saudi Arabia now holds the U.S. and its allies in such contempt that he refused even to take a telephone call from President Biden just after Russia had invaded Ukraine in which the President wanted to ask for Saudi Arabia’s help to bring oil prices back down.

Gold Prices Fall as Traders Raise Odds of More Fed Tightening after Solid Jobs Data

Gold Prices Fall as Traders Raise Odds of More Fed Tightening after Solid Jobs Data

Gold prices (XAU/USD) retreated on Monday, falling more than 1.0% and threatening to break below the psychological $2,000 level, undermined by broad-based U.S. dollar strength and increased odds of additional Fed tightening following remarkably strong U.S. labor market data released last Friday.

The latest U.S. employment report, which showed the U.S. economy added 236,000 jobs in March, led traders to increase bets that the FOMC will deliver another quarter-point rate rise at its May meeting, implicitly reducing the likelihood of a pause to the hiking cycle next month.

A continuation of the central bank’s tightening campaign will stand to benefit the U.S. currency, creating headwinds for the dollar-denominated yellow metal and preventing its prices from decisively trading above the $2,000 threshold in the coming days and weeks. This, however, does not mean that the bullish case has been invalidated.

Despite the uncertainty about the near-term monetary policy path, the Fed will likely adopt a dovish stance at some point in the not-so-distant future once the economy takes a turn for the worse, burdened by the lagged effects of aggressive hikes and the adverse impact of the banking sector turmoil. When this happens, gold will be well-placed to stage a strong rally.

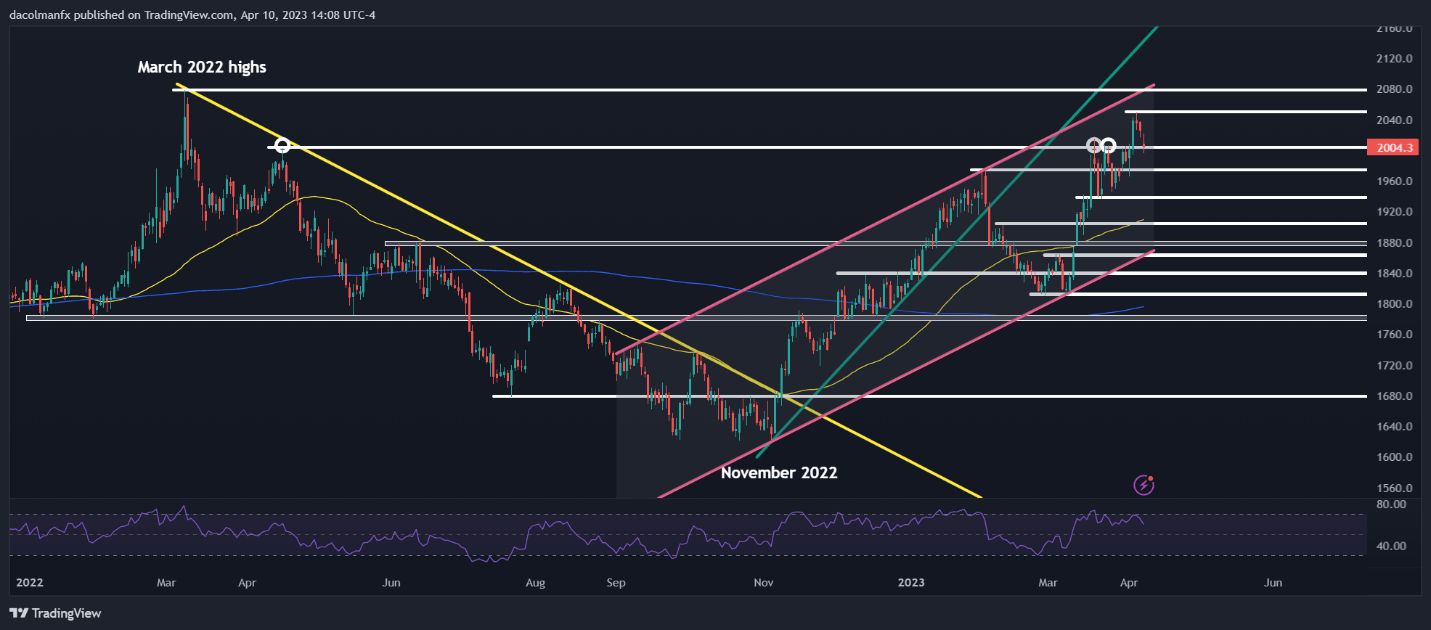
Focusing price-action analysis, XAU/USD is currently hovering above key technical support at $2,000 following its recent pullback. If this floor is taken out convincingly, sellers could launch an attack on $1,975, followed by $1,940.

On the flip side, if bulls regain control of the market and spark a rebound from present levels in short order, the first resistance to keep an eye on is located at $2,050 near April’s swing high. If prices manage to breach this ceiling, buying interest could pick up momentum, setting the stage for a climb toward $2,075, gold’s all-time peak.

GOLD PRICES TECHNICAL CHART

Chart, line chart, histogram  Description automatically generated


US Dollar Extends Rise as Liquidity Comes Back and Markets Absorb NFP Report

US Dollar Extends Rise as Liquidity Comes Back and Markets Absorb NFP Report

Asia-Pacific Market Briefing – Markets Fully Absorb NFP Print from Last Week

The US Dollar aimed higher against its major counterparts on Monday, extending a recent streak of cautious gains. Its performance could be traced back to Friday when another solid US non-farm payrolls report crossed the wires. During that time, Wall Street was offline for the Good Friday holiday, meaning the complete reaction wouldn’t be fulfilled until liquidity was restored over the past 24 hours.

236k jobs were added in March, slightly higher than the 230k consensus. This marked a slowdown from February’s revised 326k print. Meanwhile, the unemployment rate unexpectedly dipped to 3.5% instead of holding steady at 3.6%. This was while the labor force participation rate increased to 62.6% from 62.5%. That hinted that the economy was able to absorb the increase in workers without sacrificing a rise in unemployment.

The key takeaway from the jobs report was that another 25-basis point rate hike from the Federal Reserve is likely in the cards for May’s policy announcement. In response, Treasury yields have been rising since the jobs report. Still, Wall Street remained unperturbed. By the end of Monday, the Dow Jones and S&P 500 finished higher. Meanwhile, the tech-heavy Nasdaq Composite was practically unchanged.

Looking to Tuesday’s Asia-Pacific trading session, the most prominent economic print on the docket is Chinese inflation figures (both CPI and PPI) for March. Given China’s recovery from its Covid-zero strategy, investors will be watching if these figures could show signs of rising price pressures, which could be indicative of an accelerating economy.

US Dollar Technical Analysis

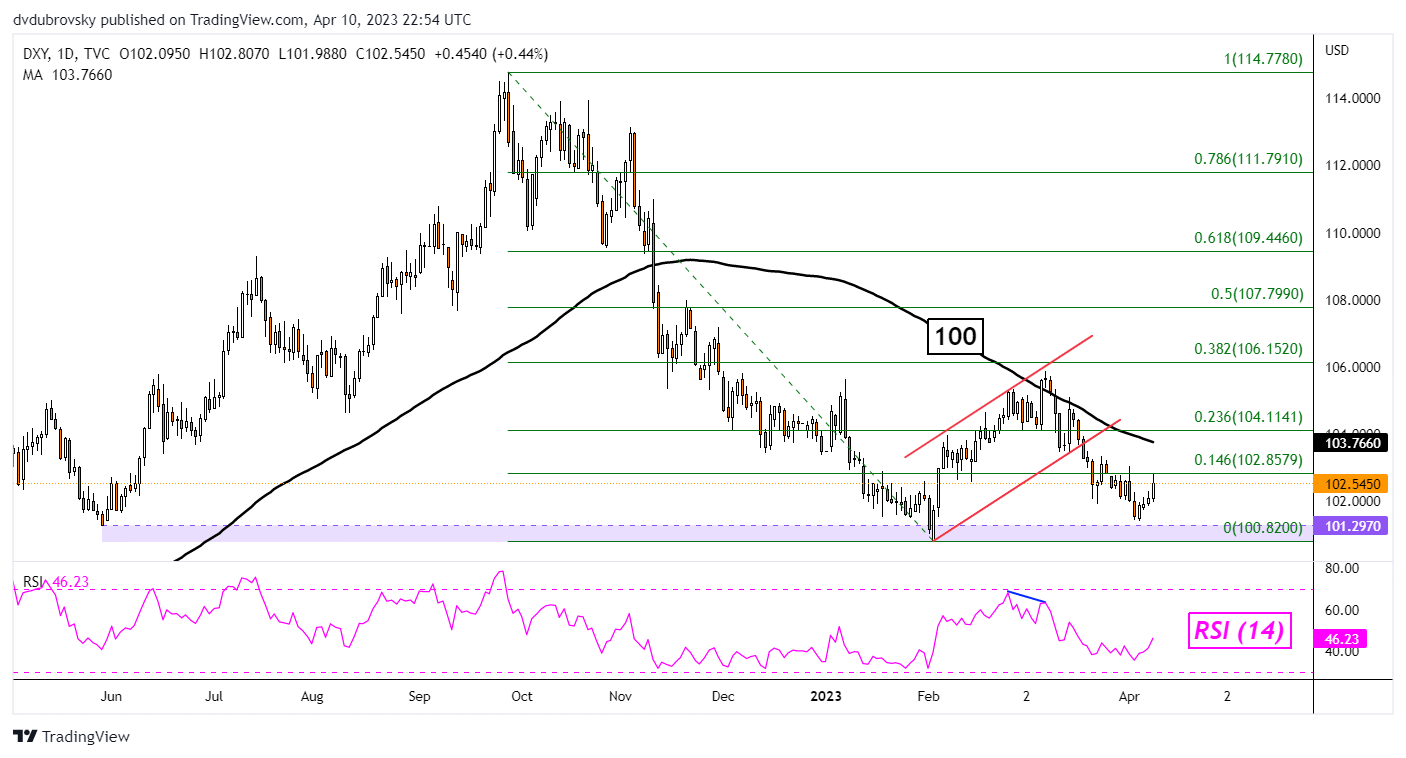
Looking at the DXY Dollar Index, we can see that the greenback is aiming higher after prices turned just above the critical 101 – 101.29 support zone. This could open the door to extending gains, but the 100-day Simple Moving Average (SMA) remains above. It could hold as resistance, maintaining the downside focus (as it did on a couple of occasions in March).

DXY Daily Chart

DXY Daily Chart

Trading Economic Data Means Looking Past the Numbers

Trading Economic Data Means Looking Past the Numbers

Economic Data, Foreign Exchange Trading, Central Banks – Talking Points

The foreign exchange market’s reaction to economic data is one of the most important subjects for traders to consider, but also one of the most vexed.

The monthly round of official and private releases from around the world covers everything from inflation and employment to the forward-looking views of corporate purchasing managers. Together with central bank pronouncements, it forms what we might call the framework of foreign exchange trading.

Major Economic Releases Can Dominate Trade

Markets may well hunker down, losing both volume and volatility, in the run-up to an eagerly anticipated number. Official US labor market statistics are perhaps the most obvious example here. When the trading community expects serious gains or crushing losses the session can be subdued from Asia’s open and right across Europe as participants nurse suspicions or hopes. Even when the market expects neither many traders will – in financial journalism’s enervating cliché – “wait and see.”

This makes sense of course, enervating or not. Obviously, there’s a link between the economic performance of a country with a freely floating currency and the performance of that currency against its peers. At the most basic level a strong piece of economic data will boost a currency, a weaker one will tend to see it fall.

However, to take the matter no further would be a grave error. For one thing, individual pieces economic data tend to influence currencies in a very fleeting way. The gains provided by even a blockbuster, expectation-shattering number can be undone by the end of a day’s session, and well before that in some cases. It may even mean no more than a few minutes’ spike one way or another.

So, there’s clearly more to know about data and its effects.

The first and perhaps most important thing is that, while data provide the rhythm, the world moves to a monetarist cadence and central banks will always play lead. So, ultimately, the longer-term effects any piece of economic news must be considered with a view to how it might change monetary policy. No single data release is ever likely to do that, and markets would have caused to worry if it did. Central banks like to be ahead of the numbers, ready to tighten or loosen policy as needed before trends turn.

Therefore, we might see the markets only very briefly cheer strong retail sales, say, or powerful job creation. They might be great for the politicians, but, if inflation remains docile, they might not mean anything at all in terms of central bank policy changes. And if rates aren’t going up or coming down, then the longer-term effect of the data on the currency won’t amount to much.

Of course, these days docile inflation is little more than a happy memory across much of the world as war in Ukraine boosts both food and fuel prices at a time when post-Covid supply chain storms are still raging.

Currencies Can Fall Even When Interest Rates Rise

In July of this year, the United States Federal Reserve delivered a three-quarter point interest rate rise, something which would have been considered extraordinary monetary action for most of the past thirty years. And yet the US Dollar actually lost ground by the end of the session for, in its post-rate-hike remarks, the Fed left markets reasonably sure that future actions were going to be a lot more measured.

So, we can on occasion see the phenomena of a ‘dovish’ rate hike, or even a ‘hawkish’ rate cut. That’s when a central bank takes action but strongly implies that it has finished doing so, or that the barrier to more is extremely high. Higher interest rates have not been terribly helpful to rare-breed Sterling bulls this year either. The United Kingdom’s political and economic turmoil has left the market wondering if its economy can bare higher borrowing costs. The US certainly looks much better placed to do so.

With all this in mind, merely watching and reacting to pieces of economic news is unlikely to make for a satisfactory trading strategy. Indeed, the Dollar’s broad gains this year have rendered data watching all-but meaningless in many countries. Their currencies have fallen against the Greenback regardless of the numbers as the US currency reveals itself as the ultimate safe-haven play.

Competent traders know where the market is focused and where in the business cycle we are. What that tends to mean in practice is which specific data releases are most likely to trigger changes in the monetary mood music.

These can change dramatically over time. Older readers may well recall the days when western industrial production figures were the ones to watch for the best central bank steer. In more recent times unemployment figures took over. Policymakers were leery of wage inflation and, poised to “withdraw the punchbowl” if the labor market party showed any sign of getting out of hand.

Now of course inflation figures themselves are perhaps the ones which traders look at most obsessively, with prices’ stubborn elevation. One day, the focus will move on again. It always does. But a nuanced approach to trading economic data should remain a constant.