Natural Gas Price Setup: Downward Pressure is Abating

Natural Gas Price Setup: Downward Pressure is Abating

NATURAL GAS TECHNICAL OUTLOOK: BULLISH

Natural gas prices are holding above strong support, raising the prospect of at least some consolidation / minor rebound as the downward momentum is fading.

Market diversity as measured by fractal dimensions appears to be low as natural gas retests multi-month lows. Fractal dimensions measure the distribution of diversity. When the measure hits the lower bound, typically 1.25-1.30 depending on the market, it indicates extremely low diversity as market participants bet in the same direction, raising the odds of a price reversal. For natural gas, the 65-day fractal dimension fell below the threshold of 1.25, flashing a red flag. See “Natural Gas Price Action Setup: Is the Slide Overdone?”, published February 21 for more on the topic.

Natural Gas Daily Chart
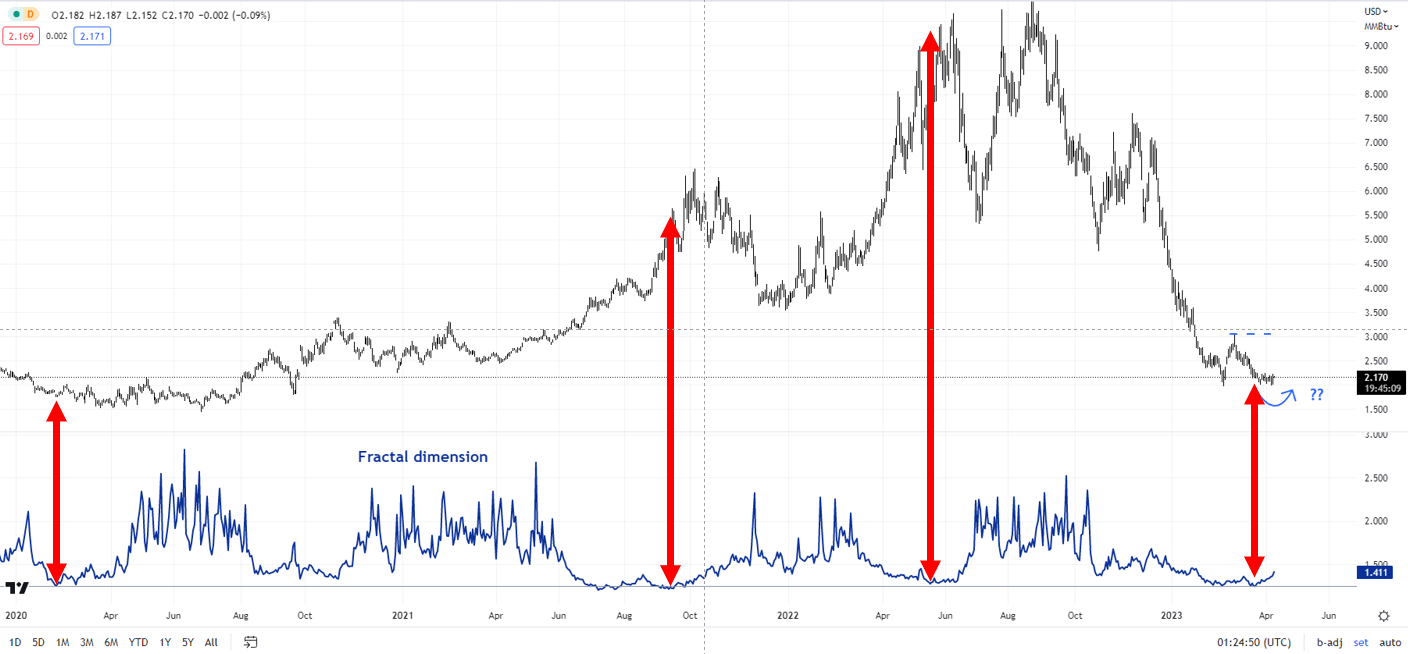
image1.png

Chart Created by Manish Jaradi using Tradingview

A positive momentum divergence on the daily and weekly charts (ascending Relative Strength Index associated with a double bottom in natural gas) is a sign that the eight-month-long slide is losing momentum. Moreover, speculative short positioning has reduced sharply since March even as natural gas prices are hovering around 2.5-year lows.

So far, natural gas is holding above strong support at the February low of 1.97. Furthermore, the colour-coded daily candlestick charts show the most recent leg lower (from early March) is consolidation within the downtrend, and not the start of a fresh leg lower.

Natural Gas Daily Chart

image2.png

Chart Created by Manish Jaradi using Tradingview

This suggests that the conditions for at least a short-term consolidation/minor rebound are getting ripe. To be fair, natural gas needs to clear the crucial resistance area around 2.25-2.40, including the 89-period moving average, the 200-period moving average, and the upper edge of the Ichimoku cloud on the 240-minute charts. A move above the resistance would raise the odds of a retest of the March high of 3.03. Any break above 3.03, would trigger a double bottom (the February and the March lows), potentially opening the way toward 4.00.

Natural Gas 240-minute Chart
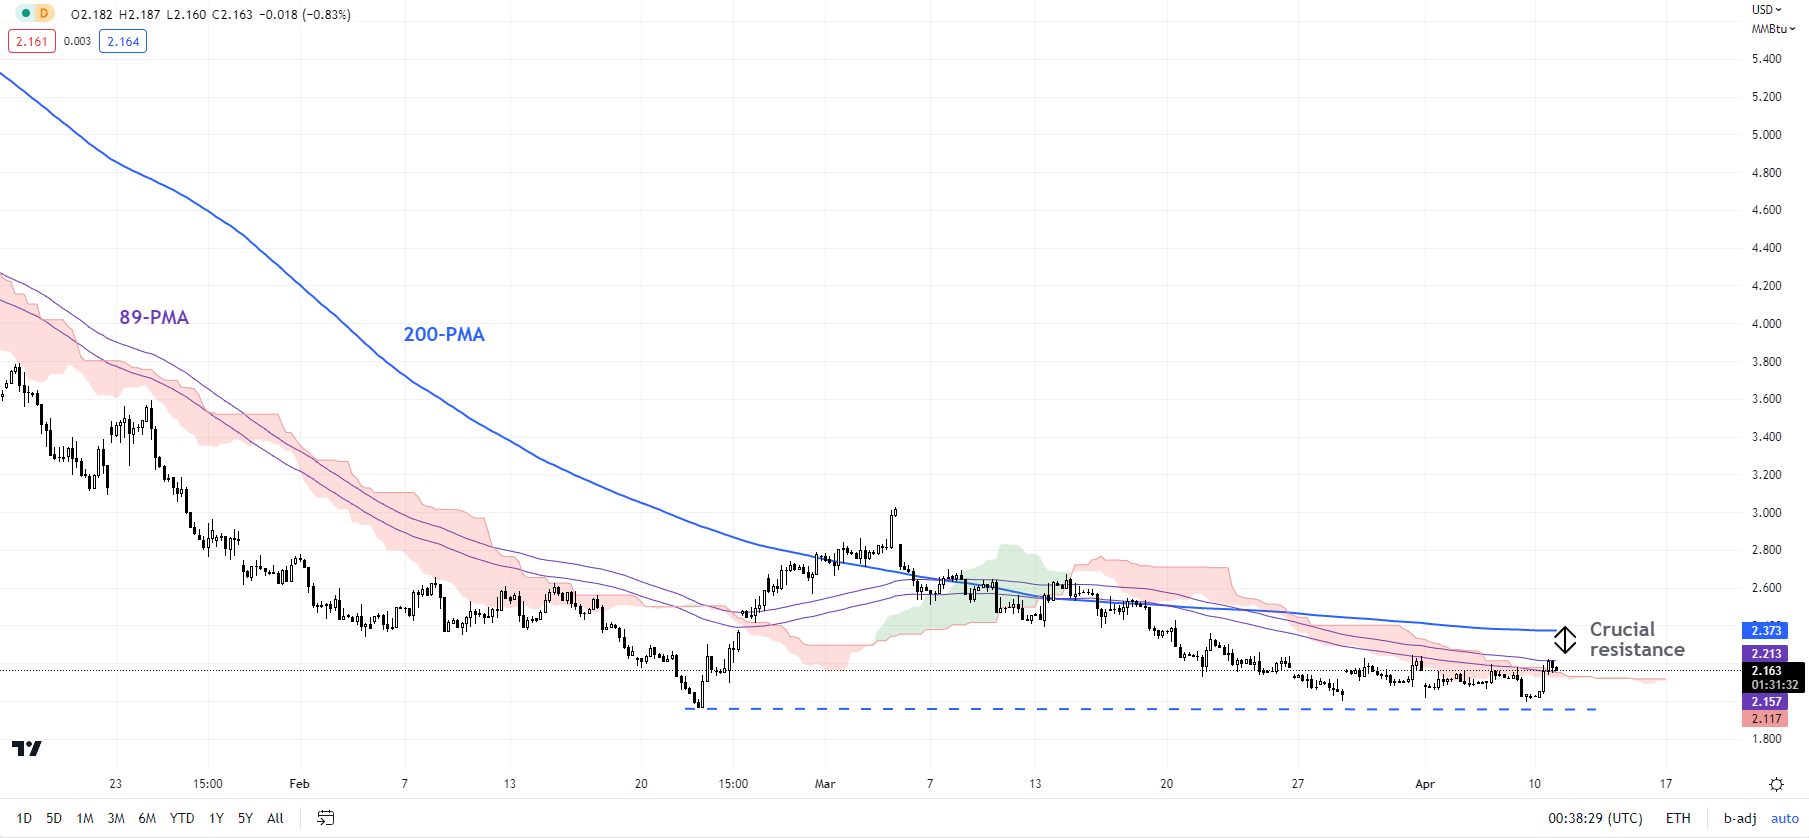
image3.png

Chart Created by Manish Jaradi using Tradingview

On the downside, a drop below 1.97 could pave the way toward the 2020 low of around 1.45, also the target of a major double-top pattern (the 2022 highs) triggered at the end of last year.

Bitcoin Crosses the Key $30000 Mark. Will it Sustain?

Bitcoin Crosses the Key $30000 Mark. Will it Sustain?

BITCOIN TECHNICAL OUTLOOK – BULLISH

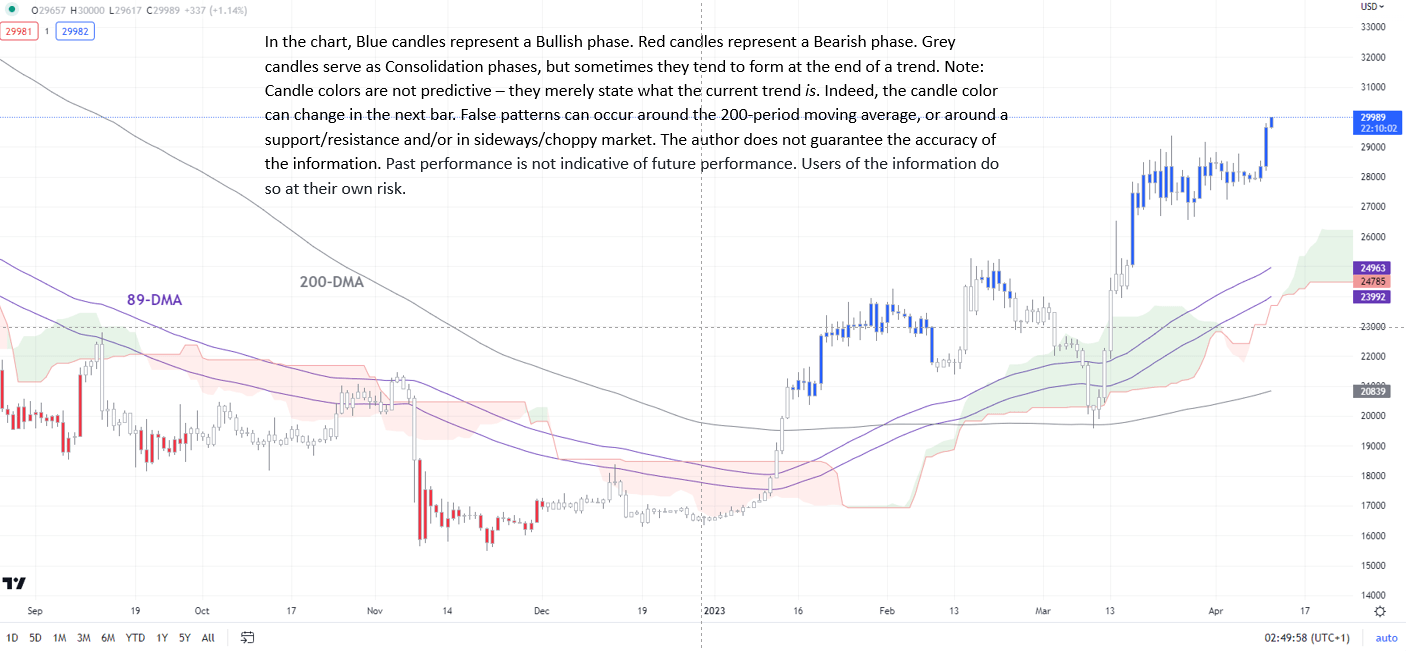
Bitcoin’s jump to a nine-month high is a sign that the medium-term downtrend in cryptocurrencies is changing. While the trend on the daily charts continues to be bullish, some short-term consolidation can’t be ruled out.

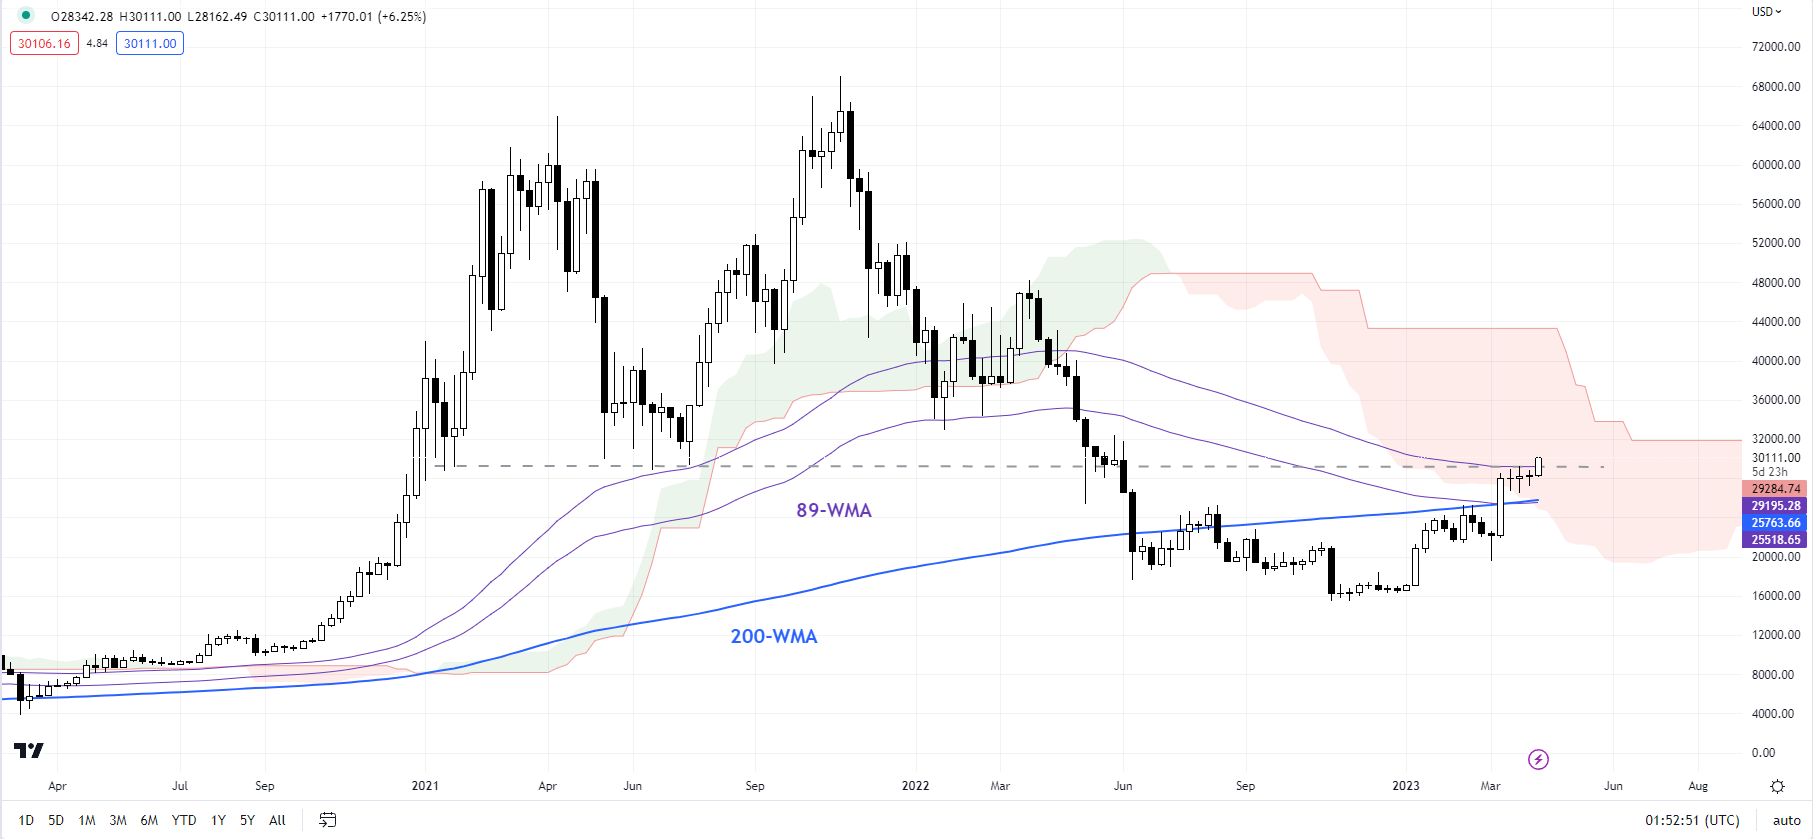
BTC/USD has crossed a vital barrier at the March highs of 28920-29175. The break has opened the way initially toward resistance on an uptrend line from January (now at about 30800) followed by the May 2022 high of 32375. From a trend perspective, Bitcoin turned bullish in January – see “Bitcoin Technical Outlook: BTC/USD Turns Bullish”, published January 18. The colour-coded candlestick charts, based on trend/momentum indicators, indicate BTC/USD remains in a bullish phase (see chart).

BTC/USD Daily Chart

image1.png

Importantly, the higher-top-higher-bottom sequence forming on the weekly charts indicates that the medium-term downward pressure is easing. This is further reinforced by the rise above the stiff hurdle on the 200-week moving average. For more discussion, see “Bitcoin Technical Outlook: Medium-Term Downward Pressure is Fading”, published March 30.The potential for a base building in cryptocurrencies was first highlighted in November, and the possibility of a reversal in the medium-term downward pressure was subsequentlyhighlighted in January.

BTC/USD Weekly Chart

image2.png

Chart Created by Manish Jaradi Using TradingView

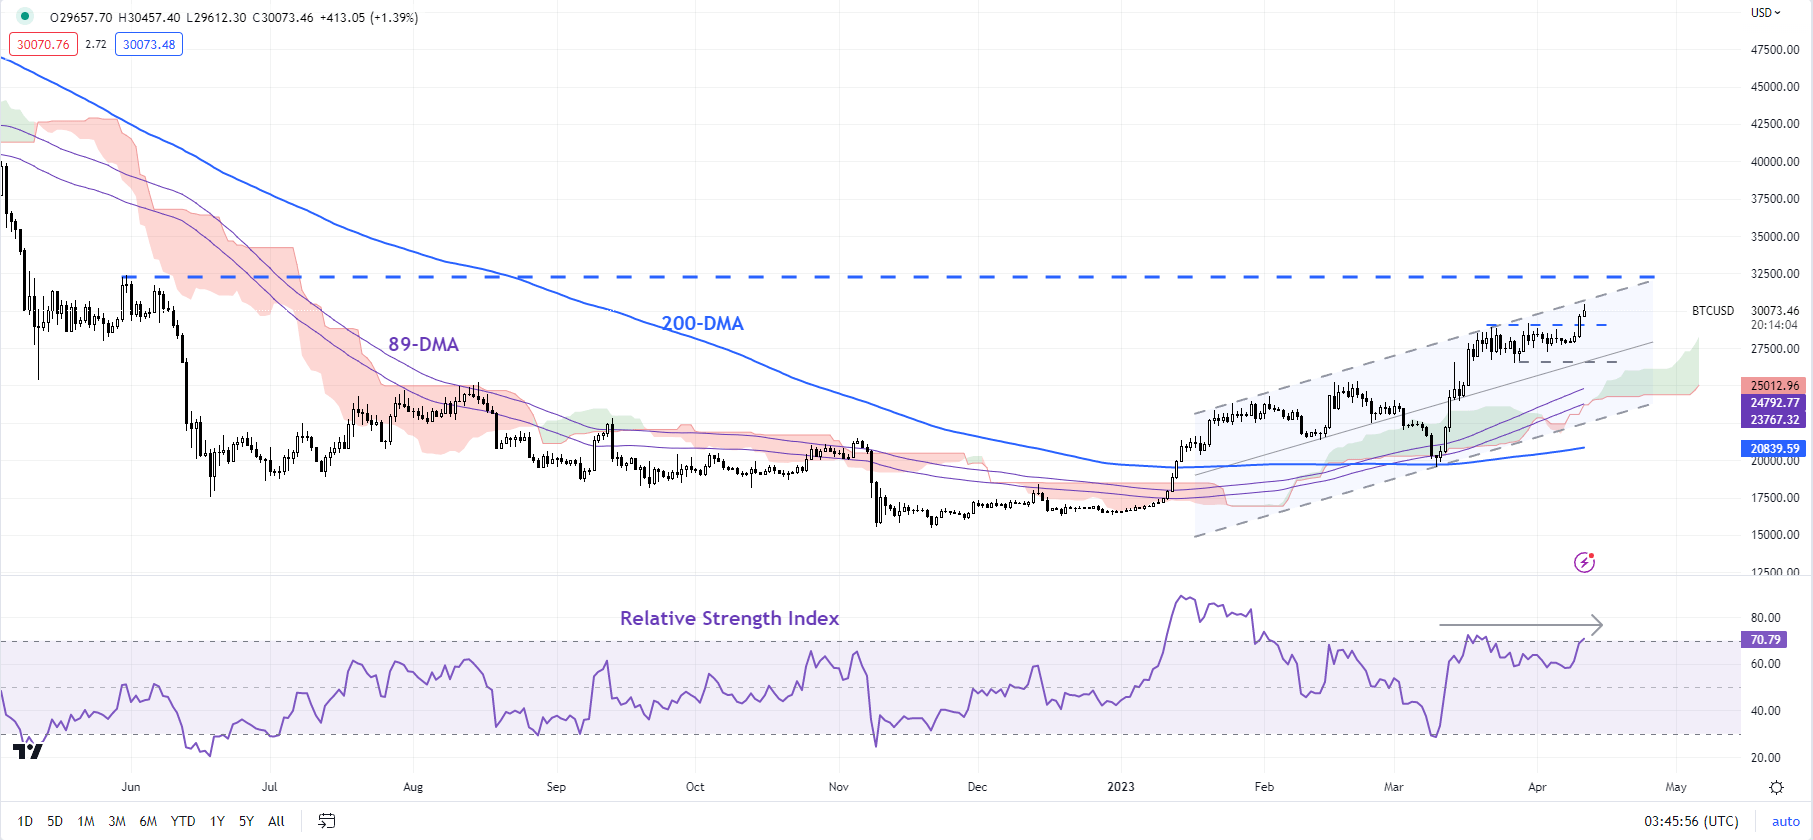
BTC/USD rose in Q1-2023 above the 200-day moving average, the 89-day moving average, and the lower edge of the Ichimoku cloud on the daily charts. The downward correction in March truncated at the 200-day moving average, further reinforcing the nascent uptrend.

BTC/USD Daily Chart

image3.png

Chart Created by Manish Jaradi Using TradingView

In the very near term, this week’s surge has come about on lower momentum, raising the prospect of minor fatigue in the rally, especially given the pace and the extent of the recent gains. Still, there is immediate support at the end-March low of 26525. Only a break below the support would indicate that the upward pressure had eased somewhat in the short term.

Q2 Trade Idea – Is it Time for Silver to Shine Brighter?

Q2 Trade Idea – Is it Time for Silver to Shine Brighter?

Is it Time for Silver to Shine Brighter?

Silver is continuing to benefit from the current economic backdrop as sticky, global inflation worries and recessionary fears continue to swirl. And with these worries likely to remain in the coming quarter, the price of silver could continue to move higher and test recent levels of resistance.

The daily chart shows silver’s positive performance since mid-March with the precious metal rallying around 17% off its March 10 swing low. This rally has seen silver trade through the 20-, 50- and 200-day moving averages, adding credibility to the move. A pattern of higher lows and higher highs remains in place with the next target seen just above $24.50. Above here, multi-month highs at $26.21 and $26.94 come into focus. The CCI indicator is currently showing silver as overbought so a period of consolidation may be required before the next leg higher.

Silver Daily Price Chart

image1.png

The silver /gold ratio also shows silver underperformance against gold since mid-December 2022 with only the recent rally breaking the pair out of the downward channel in the last couple of days. The pair have also moved above the 20-day moving average and near both the 50- and 200-day moving averages. A confirmed break above here would allow the silver/gold spread further room to move higher. The spread pair are also in overbought territory so as above a period of consolidation may be seen in the short term.

Silver/Gold Spread Daily Price Chart

image2.png

While both charts show the current move higher to be potentially overdone, both setups look positive for silver not just to move higher but for it to also outperform gold as well. The next three months may see silver shine even brighter.

Volatility May See Range Breaks across Markets but Trends Might be Short-Lived

Volatility May See Range Breaks across Markets but Trends Might be Short-Lived

Volatility May See Range Breaks across Markets but Trends Might be Short-Lived

Going into the second quarter, the macro environment for financial markets is characterized by stubbornly high inflation and an evolving banking crisis. Will volatility continue to evolve?

While separate, they are related. The ultra-loose monetary conditions of the pandemic era created circumstances that allowed for a large amount of spare capacity of liquidity. That led to building price pressures and excessive availability of capital that enabled risk-taking that would otherwise have been challenged by the market.

The inflation problem is well documented, but the unfolding banking crisis has created uncertainty around the viability of some institutions. The banks that have failed so far have done so for two different reasons. The first is the mismanagement of their balance sheets which saw a mismatch in assets and liabilities. Silvergate Bank, SVB Financial and Signature Bank could be in this category. The second is weak balance sheets that are exposed when financial conditions tighten to make capital harder to obtain and more expensive. Credit Suisse and Republic Bank could be in this category.

How many more impending collapses there might be is the great ‘known unknown’. Observing equity indices and FX, the long, drawn-out trends that prevailed through the pandemic era appear to be over for now.

Forex for BeginnersHowever, elevated volatility from this uncertainty can be seen across several asset classes. This scenario has seen ranges build over time and often break to one side before either establishing a new range or folding back inside the prior range.
In this type of trading conditions, false breaks could set up an opportunity. This type of trade requires robust risk management and is generally typified by smaller position sizes and wider stop loss parameters to allow for excess volatility when markets break the range.

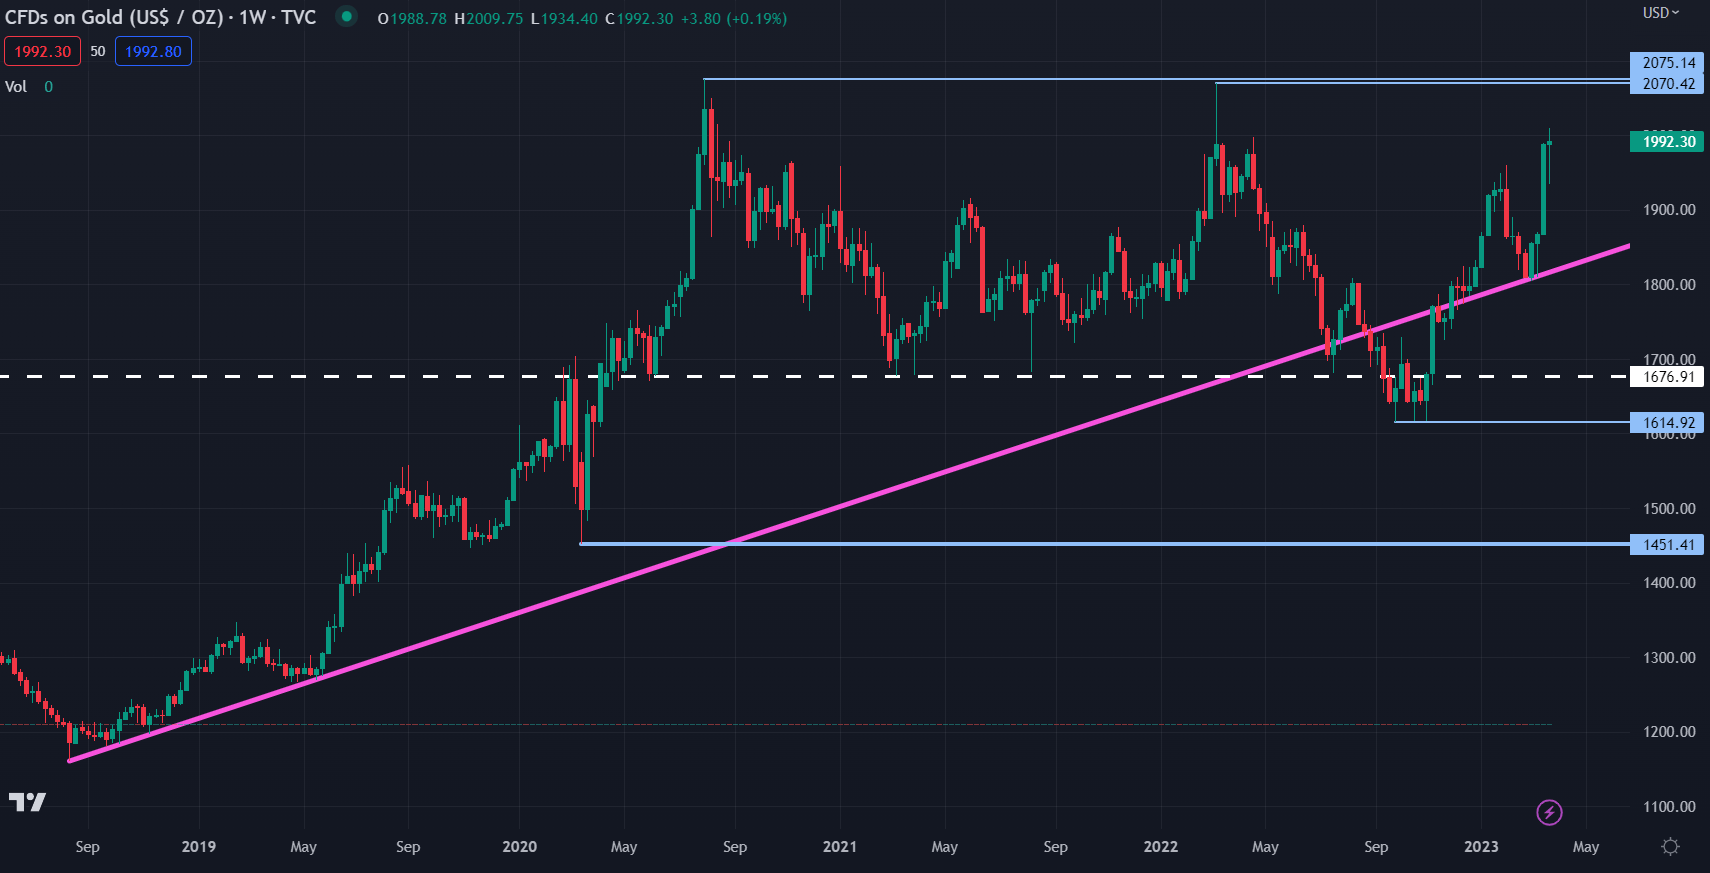
An example of this kind of market is gold. It has been in a wide range of 1,615 – 2,075 for almost 3 years. It broke below an ascending trend line and then broke below the prior low of the range at 1,677. It made a new low at 1,615 In September last year before rallying back inside the range.

This price action is difficult to trade as many stop losses were cleaned out to the downside and it was unclear if a new range was being established or not.

Looking at the topside, the peak in August 2020 of 2,075 was unable to be eclipsed in the rally of March 2022. This made a double-top formation.

The current price is heading toward that high and this may present an opportunity. If selling near the prior peaks. A small position size may allow for a higher stop loss level in the event of a false break.

It should be noted though that past performance is not indicative of future results.

GOLD CHART

image1.png

Chart created in TradingView

US CPI to guide Fed’s next move

US CPI to guide Fed’s next move

After the “goldilocks” US jobs data on Friday (resilient job gains and benign wage growth ie. not too hot, not too cold), the “will they, wont they” debate around the Fed raising rates at its next meeting at the start of next month will be further informed by fresh US CPI data released on Wednesday. The headline number has fallen for the last eight reports and more declines are expected. But the core month-on-month number will be key. Economists reckon the forecast 0.4% remains more than double the rate required over time to bring inflation back to the Fed’s 2% target.

Markets have been a lot more sensitive to soft data recently as growth and recession concerns have increased. Central banks around the globe are either pausing their rate hike cycle or getting close to the end. Those banks like the ECB and BoE who have signalled a readiness to continue have seen their currencies make strong year-to-date gains. This is highlighted by crosses like EUR/AUD and GBP/AUD which pushed to new cycle highs last week.

Focus will turn to the Bank of Canada meeting on Wednesday where policymakers are also expected to stand pat. Elevated wage data will likely bother the BoC who have noted previously that high earnings growth is inconsistent with regaining control of inflation. But the downside risks to global growth after the banking stress means interest cuts could be on the horizon. Guidance around the banking turmoil could inform on the BoC’s next move. The recent drop in USD/CAD stalled around key trend support in the low 1.34s. Resistance sits at 1.3526.

Major risk events of the week

12 April 2023, Wednesday:

-US CPI: The market median forecast for headline CPI is 0.3% in March, down one-tenth from the previous month. The annual reading is expected to remain unchanged at 6%. Analysts say shelter remains the key component with the gap between market measures and the CPI index continuing to widen.

-Bank of Canada Meeting After signalling a “conditional pause” at its meeting in March, the bank is expected to keep the policy rate at 4.5%. The labour market remains tight, with this week’s upside surprise in job gains while wage growth is still around 4-5%. But inflation fell more than expected due to lower energy costs.

-FOMC Minutes: The Fed voted unanimously to lift rates by 25bps. But policymakers softened their forward guidance and Powell said a tightening of credit conditions could weigh on activity. Any new insights into this shifting assessment of the economic backdrop will be crucial for the May Fed rate decision.

13 April 2023, Thursday:

–UK GDP: Analysts expect an expansion of 0.1% m/m in February after the 0.3% increase in January.  Economists say weaker construction and manufacturing growth weighed, but surveys picked up and retail sales rose robustly. That means many no longer expect a recession. In fact, some have recently raised their GDP forecasts for 2023. GBP has been the best performing major this year. But cable is battling with the 12.5 barrier with the December and January highs around 1.2446/47 adding to the resistance.

–ECB Meeting Minutes: The bank hiked rates by 50bps at its March meeting, amid the banking sector turmoil. It emphasised a data dependent approach but said inflation was projected to remain too high for too long. Focus will be on the path for future policy tightening and the debate between the hawks and doves. EUR/USD has been strong since the mid-March low at 10516. Dips are being bought but 1.10 is the key level to beat for bulls.

14 April 2023, Friday:

–US Retail Sales: Consensus forecasts a second straight fall of 0.4% in March, with core also seen falling. Last month’s decline was led by vehicles and furniture stores, while the sole services category also dipped. But spending is still being supported by the tight labour market which is seeing solid wage growth.

Yen sinks as rates outlook diverges; NZ dollar tumbles

Yen sinks as rates outlook diverges; NZ dollar tumbles

TOKYO: The yen sank against major peers on Monday after US payrolls data bolstered the case for further Federal Reserve rate hikes, highlighting a growing disparity with Japan where the central bank continues to pin the benchmark yield near zero.

Meanwhile, the risk-sensitive New Zealand and Australian dollars weakened amid heightened US-China tensions over Taiwan, with Beijing a key trading partner for the Antipodean nations.

The yen slipped 0.4% against the US dollar to 132.70, extending its decline from Friday, when data showed the US economy continued to add jobs at a brisk pace in March.

Ten-year Treasury yields reached 3.413% in shortened trading on Friday for the Easter holiday.

The yield remained elevated at 3.3719% in Tokyo on Monday, when many markets in Asia as well as Europe will remain closed.

Against the euro, the yen slumped over 0.5% to 144.635. It fell roughly 0.3% versus sterling.

The dollar strengthened against the yen because of the continued strong growth in the US labour market despite inflation and sharp interest rate rises, Mizuho analysts Masafumi Yamamoto and Masayoshi Mihara wrote in a client note.

“Yields in places like the euro area, Britain and Australia will follow US yields higher, so there won’t be a big widening of the yield gap,” they said.

“Relative to them, yield spreads will see a much bigger impact in Japan.”

However, the increase in jobs was less than the prior month and the rise in average hourly wages was less than economists forecast, which the Mizuho analysts said was not consistent with a sustained rise in US yields.

Barring an upside surprise in US consumer price data on Wednesday, the dollar has limited room to rise against the yen from current levels, they added.

Dollar on the defensive as banking fears ebb; yen drops

New Bank of Japan Governor Kazuo Ueda takes over from Haruhiko Kuroda on Monday, and is widely expected to keep massive stimulus in place for the time being.

He will give an inauguration speech at 7:30 p.m.

JST (1030 GMT). Meanwhile, the New Zealand dollar slumped about 0.7% to $0.62325, and the Aussie slipped 0.13% to $0.6665. Stock and bond markets in both countries are closed for the Easter Monday holiday.

The dollar edged 0.05% higher to 6.8784 yuan in offshore trading.

China began three days of military drills on Saturday simulating precision strikes against Taiwan, the day after Taiwan President Tsai Ing-wen returned from a brief visit to the United States.

In other currencies, sterling slipped 0.02% to $1.2410, while the euro gained 0.02% to $1.0899.

USD/JPY Bulls to Target 133 on Hawkish Fed Bets

USD/JPY Bulls to Target 133 on Hawkish Fed Bets

It was a relatively quiet morning for the USD/JPY. February current account figures from Japan drew interest this morning. However, trading volumes are on the light side, with several markets closed for Easter Monday.

The current account balance rose from a ¥1.989 trillion deficit to a ¥2.197 trillion surplus in February. Economists forecast a ¥2.536 trillion surplus. However, the adjusted current account surplus jumped from ¥20.360 trillion to ¥108.920 trillion versus a forecasted ¥1.430 trillion.

Trading Derivatives carries a high level of risk to your capital and you should only trade with money you can afford to lose. Trading Derivatives may not be suitable for all investors, so please ensure that you fully understand the risks involved, and seek independent advice if necessary. A Product Disclosure Statement (PDS) can be obtained either from this website or on request from our offices and should be considered before entering into a transaction with us. Raw Spread accounts offer spreads from 0.0 pips with a commission charge of USD $3.50 per 100k traded. Standard account offer spreads from 1 pips with no additional commission charges. Spreads on CFD indices start at 0.4 points. The information on this site is not directed at residents in any country or jurisdiction where such distribution or use would be contrary to local law or regulation.

While the stats drew interest, further market reaction to the US Jobs Report and increased bets of a 25-basis point Fed interest rate hike supported a USD/JPY breakout this morning.

Later this morning, consumer confidence figures from Japan will also be in focus. However, the numbers are unlikely to force a dollar retreat.

USD/JPY Price Action

This morning, the USD/JPY was up 0.39% to 132.646. A mixed start to the day saw the USD/JPY fall to an early low of 131.832 before rising to a high of 132.649. The USD/JPY broke through the First Major Resistance Level (R1) at 132.501.

USD/JPY on the move.
USDJPY 100423 Daily Chart

Technical Indicators

The USD/JPY needs to avoid a fall through R1 (132.501) and the 132.012 pivot to target the Second Major Resistance Level (R2) at 132.865. A move through the morning high of 132.649 would signal a bullish USD/JPY session. However, Fed chatter must support an extended USD/JPY breakout.

In the case of an extended rally, the bulls would likely test resistance at 133.00 but fall short of the Third Major Resistance Level (R3) at 133.718.

A fall through R1 and the pivot would bring the First Major Support Level (S1) at 131.648 into play. However, barring a dollar sell-off, the USD/JPY pair should avoid sub-131.5 and the Second Major Support Level (S2) at 131.159. The Third Major Support Level (S3) sits at 130.306.

USD/JPY resistance levels in play.
USDJPY 100423 Hourly ChartLooking at the EMAs and the 4-hourly chart, the EMAs send a bullish signal. The USD/JPY sits below the 200-day EMA (132.770). The 50-day EMA closed in on the 100-day EMA, with the 100-day EMA narrowing to the 200-day EMA, delivering bullish signals.

A USD/JPY move through the 200-day EMA (132.770) would support a breakout from R2 (132.865) to give the bulls a run at 133. However, a fall through the 100-day (132.335) and 50-day (132.017) would bring S1 (131.648) into view. A fall through the 50-day EMA would send a bearish signal.

EMAs are bullish.
USDJPY 100423 4 Hourly Chart

The US Session

Looking ahead to the US session, it is a quiet day on the US economic calendar. There are no US economic indicators for investors to consider.

The lack of stats will leave the US Jobs Report and hawkish Fed bets to deliver USD/JPY support. However, investors should track Fed chatter throughout the session.

US CPI to Set the Tone for EUR/USD, GBP/USD, USD/JPY

US CPI to Set the Tone for EUR/USD, GBP/USD, USD/JPY

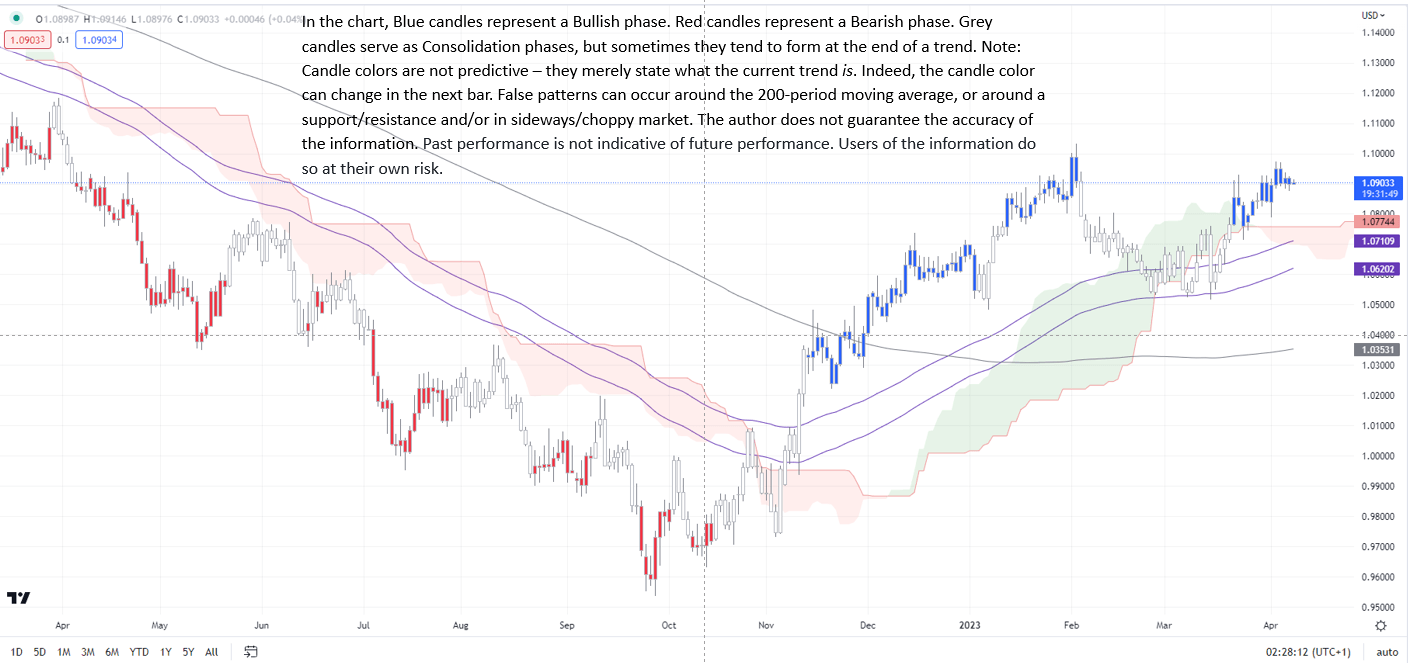
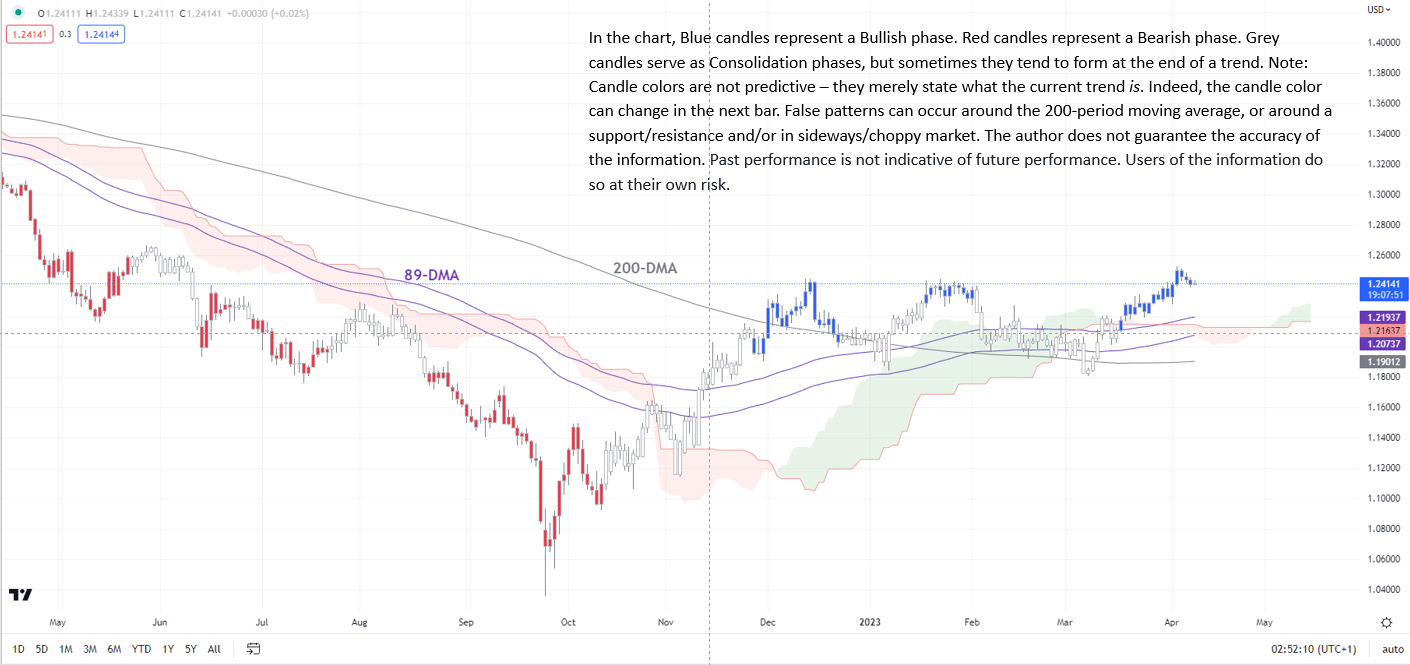
The US dollar’s trend remains broadly down against the euro, the pound, and the yen. However, it could maintain a slightly firm tone ahead of the key US inflation data due on Wednesday, especially after Friday’s upbeat jobs report.

Jobs data released on Friday suggested the labour market remains tight, keeping the door open for one more Fed rate hike next month. Nonfarm payrolls grew 236k in March, around 239k expected, but the unemployment rate slipped to 3.5% from 3.6% in February. US macro data have been downbeat since the end of March, as reflected in the sharp retreat in the Economic Surprise Index.

EUR/USD Daily Chart

image1.png

Chart Created Using TradingView

Still, money markets are pricing in a 65% chance of a 25-basis point rate hike in May, up from 48% a week ago, according to CME’s FedWatch tool. With the jobs data out of the way, the focus now shifts to US CPI data due on Wednesday: headline CPI expected at 5.6% on-year Vs 5.5% in February, while core CPI rose 0.4% on-month in March Vs 0.5% previously.

The broader macro story appears to be more or less similar elsewhere since the end of March, that is, data have been generally less upbeat, including the Euro area, the UK, and Japan. However, core inflation continues to be sticky, limiting central banks’ ability to pause rate hikes.

GBP/USD Daily Chart

image2.png

Chart Created Using TradingView

EUR: Tough resistance at 1.10

EUR/USD’s trend on the daily timeframe remains up, as the colour-coded candlestick charts, based on trend/momentum indicators, seem to suggest. However, the February high of 1.1035 is a tough barrier to crack, at least until the CPI report. A softer inflation report could lower the hurdle for a move above 1.10. On the downside, there is quite a strong cushion around 1.0785-1.0875, including the 89-period moving average on the 240-minute charts, and the April 3 low of 1.0785. EUR/USD would need to break below the support area for the short-term upward pressure to fade.

GBP: Tough hurdle ahead

GBP/USD continues to be weighed by a tough hurdle at the December high of 1.2450. Nevertheless, the short-term uptrend remains in place, as the slightly upward-sloping channel from last month suggests. Key support is around 1.2275-1.2385, including the lower edge of the channel, the 89-period on the 240-minute charts, and the April 3 low of 1.2275. The upward pressure is unlikely to fade while the support is intact. On the upside, as noted in arecent update, any break above 1.2450 could potentially open the door for meaningful gains in GBP/USD.

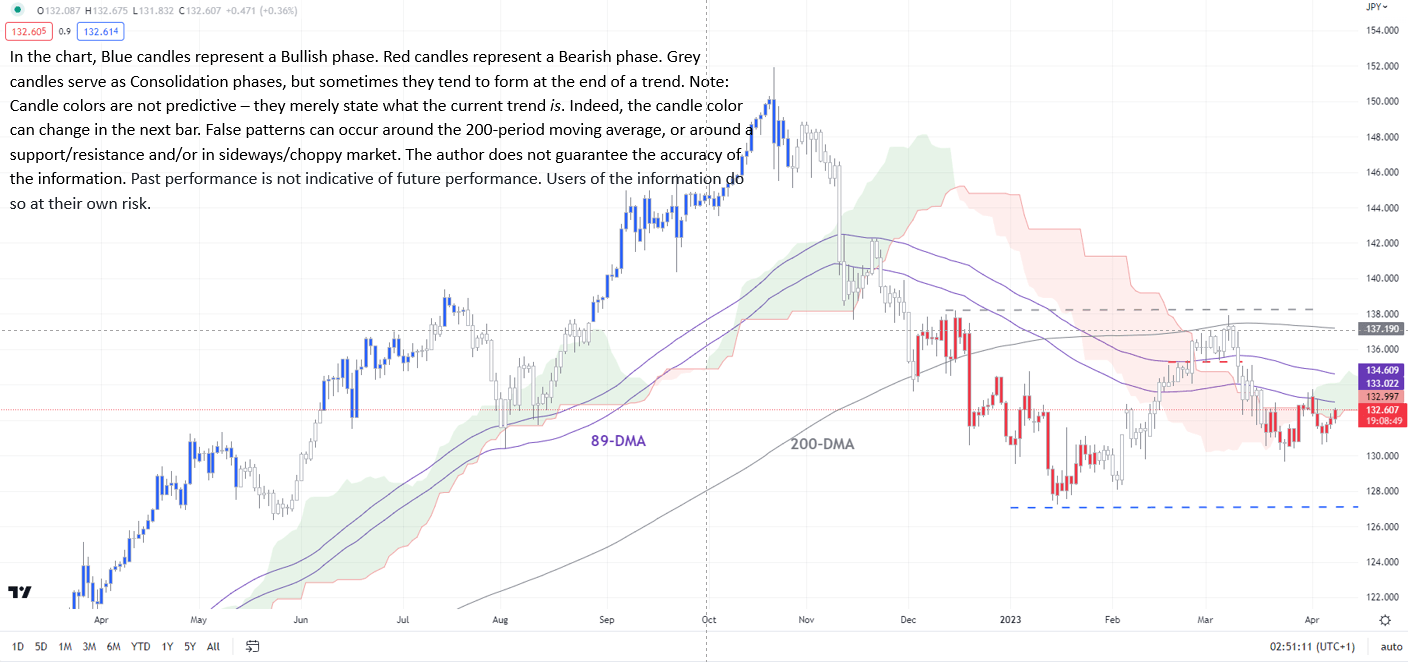
USD/JPY Daily Chart

image3.png

Chart Created Using TradingView

USD/JPY: Is a base getting defined?

USD/JPY’s broader trend remains down, as the colour-coded candlestick charts based on trend/momentum indicators suggest. Most recently, though, the pair appears to be finding support around129-130, including the 89-week moving average and the lower edge of the Ichimoku cloud on the weekly charts. On the upside, any break above the immediate resistance at the April 3 high of 133.75 would confirm that the immediate downward pressure had faded for now, raising the prospect of a broad range of 129-138.

Crude Oil Is Still Not Out of the Woods Despite OPEC+ Output Cut

Crude Oil Is Still Not Out of the Woods Despite OPEC+ Output Cut

Oil prices haven’t been able to extend gains after the initial jump following the surprise announcement of the output cut by OPEC+ producers. There could be a couple of reasons for the wait-and-watch mode.

The modest rebound in China’s economic growth suggests the recovery could be delayed there, just as other economies risk a recession. If energy prices rise further, it would complicate central banks’ efforts to curb inflation, posing further headwinds for the global economy. Put together, the prospect of lower oil demand can’t be ruled out. Another key factor to watch would be to what extent the group exercises compliance with the agreement. Full implementation could take time to play out.

Crude Oil Daily Chart

image1.png

Chart Created by Manish Jaradi Using TradingView

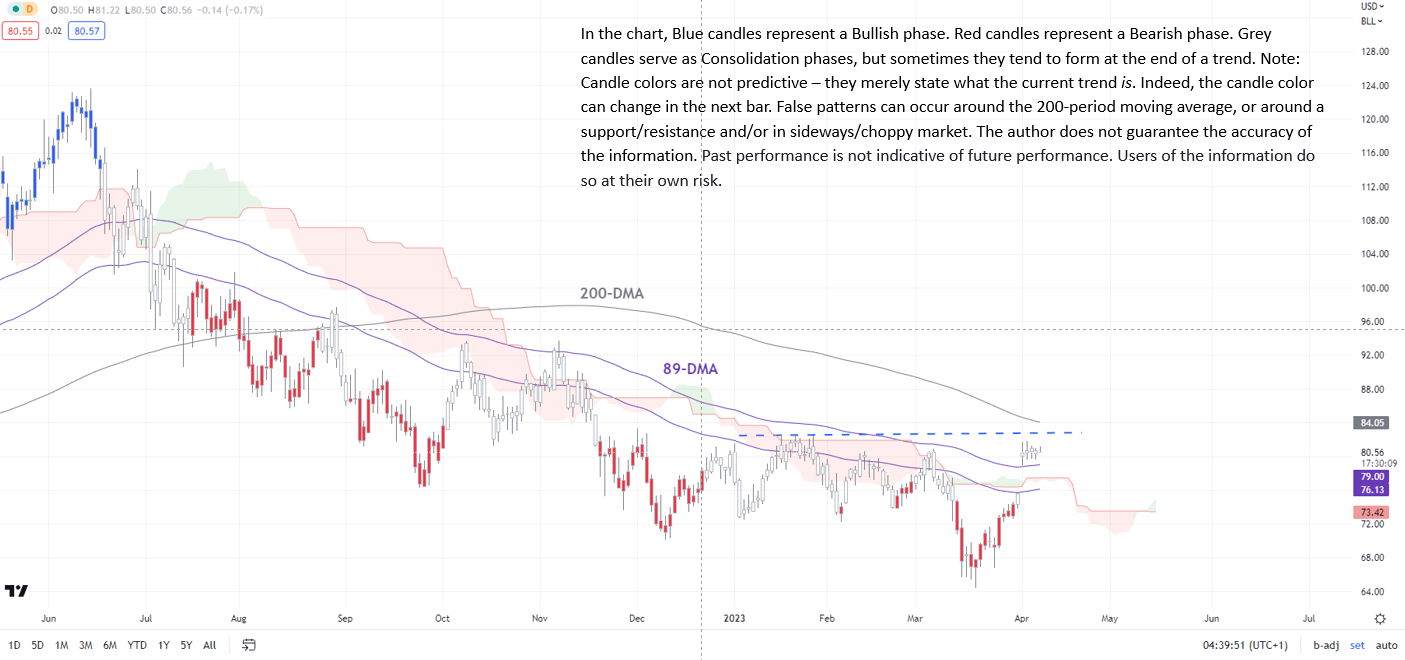
This comes as crude oil tests crucial converged resistance at 82.50-84.50, including the 200-day moving average and the January high. Oil would need to break above the crucial barrier for the nine-month-long downward pressure to fade. A decisive break above 82.50-84.50 could open the way toward the November high of 93.75.

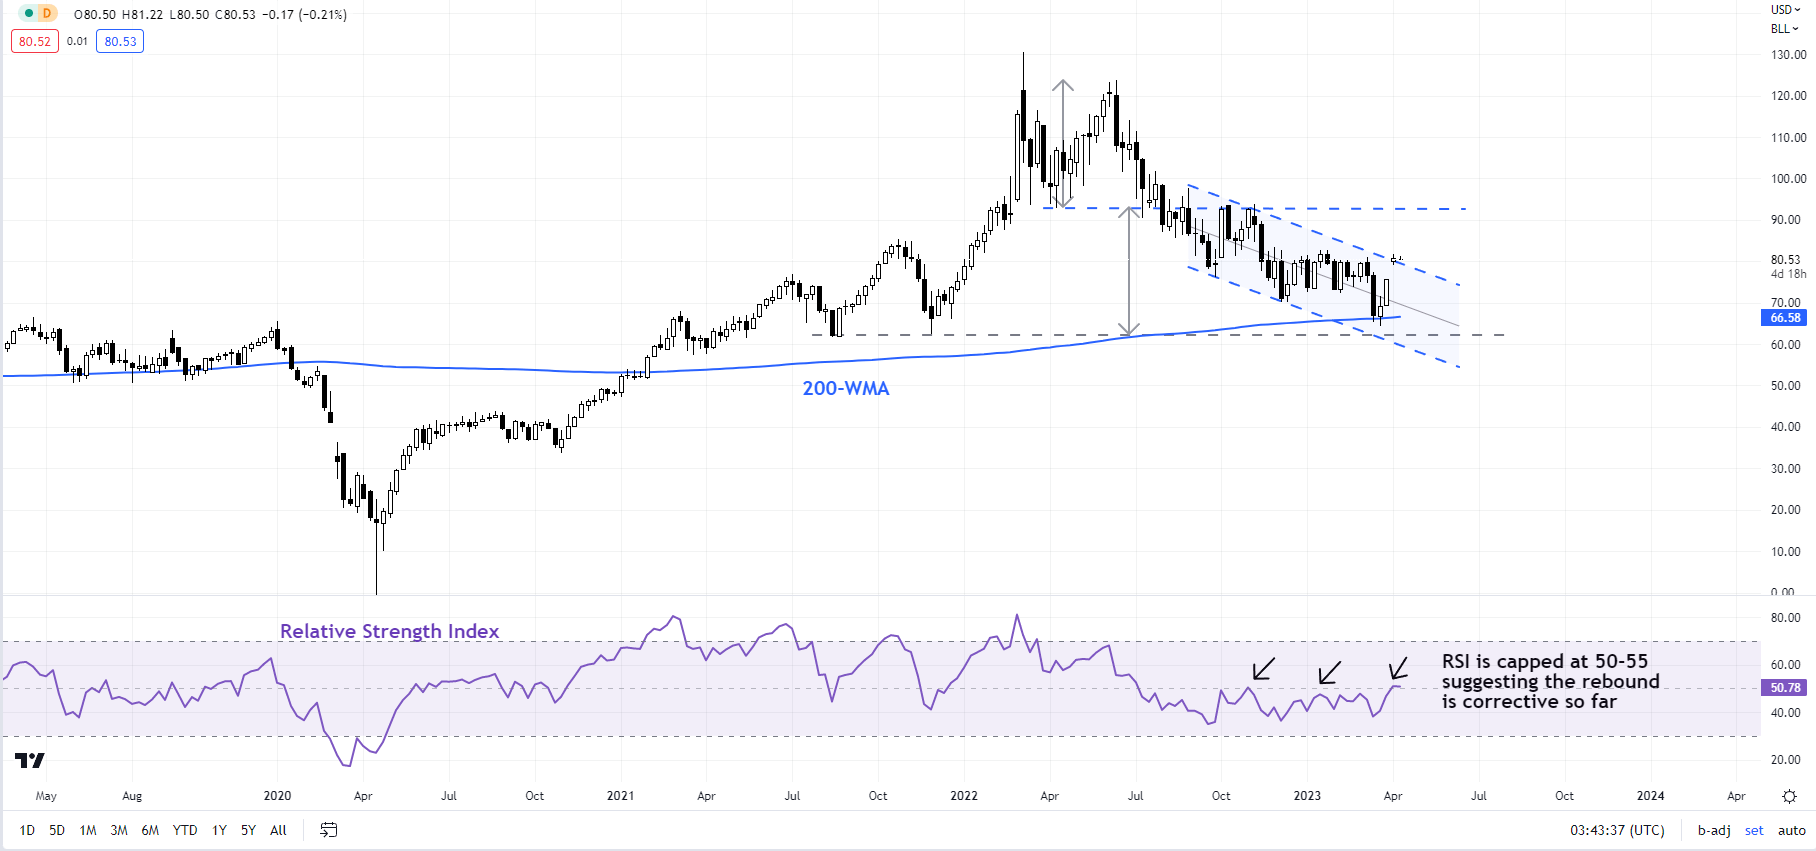
So far, the rally appears to be corrective within a bearish phase, as the colour-coded candlestick chart based on trend/momentum indicators suggests. Moreover, the 14-week Relative Strength Index has been capped around 50-55 — corrective rallies often tend to run out of steam around 50-55.

Crude Oil Weekly Chart

image2.png

Chart Created by Manish Jaradi Using TradingView

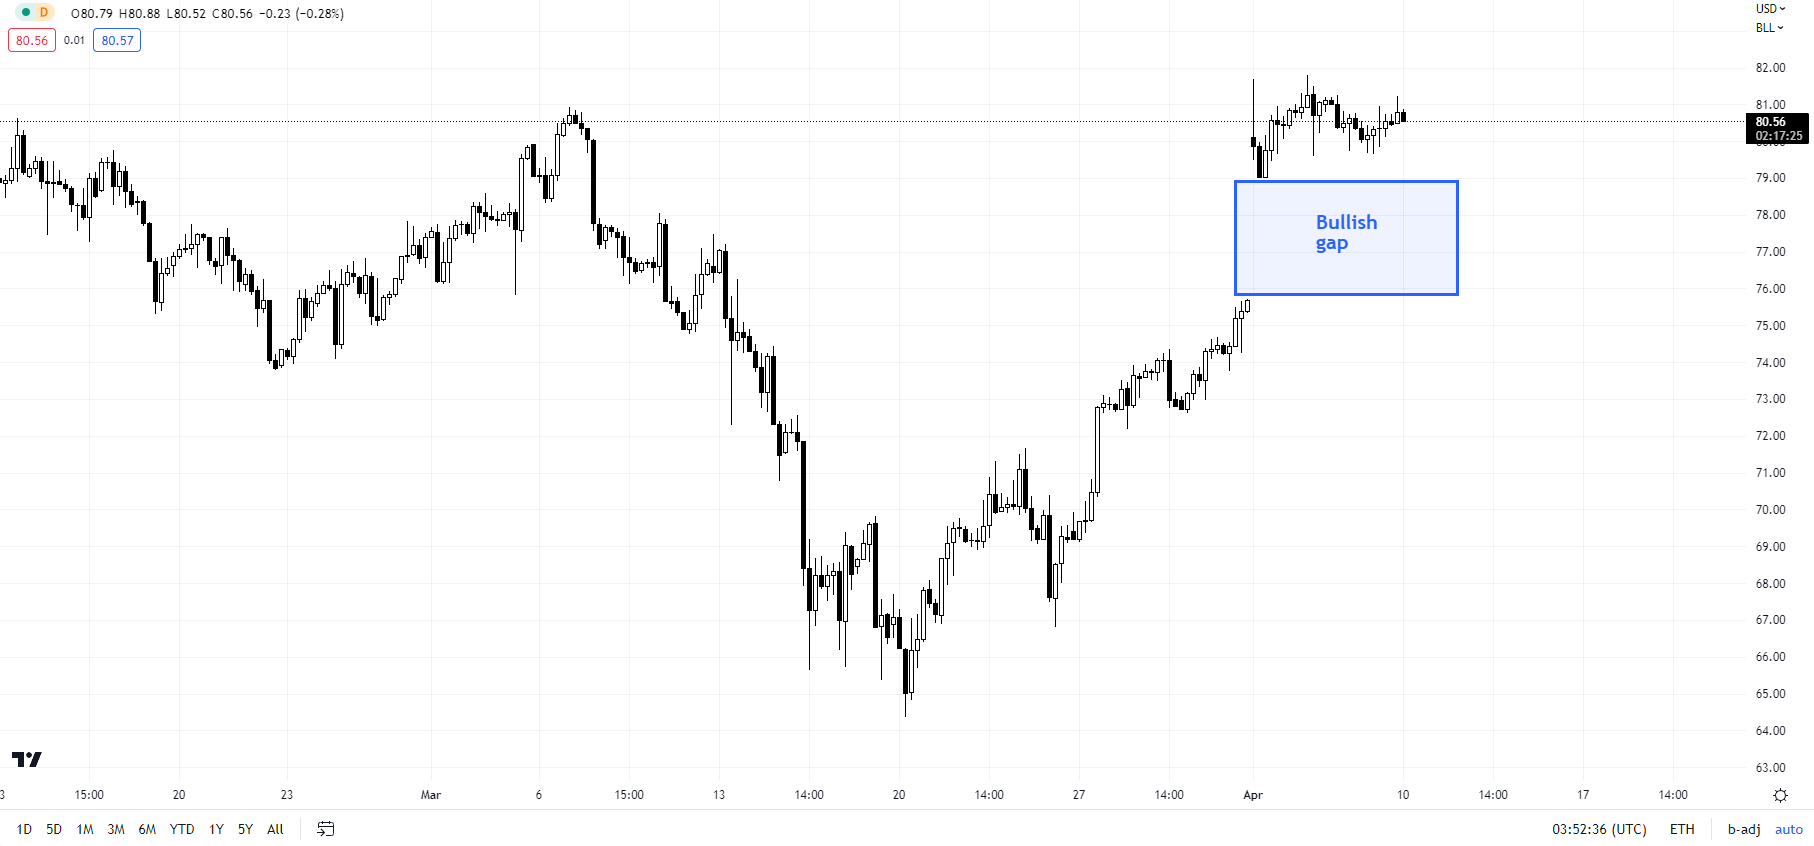
On the downside, the upper edge of last weekend’s gap (at about 79.00) is initial support, while the lower edge of the gap (around 75.50) is secondary support. If the bullish gap is closed, it would raise the odds that the rebound since late March was a dead-cat bounce.

Crude Oil 240-minute Chart

image3.png

Chart Created by Manish Jaradi Using TradingView

Oil rebounded in March from quite a strong cushion on the 200-week moving average, near the August 2021 low of 61.75.