UK Inflation Soars, GBP/USD Nears a Six-Week High, All Eyes on the Fed

UK Inflation Soars, GBP/USD Nears a Six-Week High, All Eyes on the Fed

Headline UK inflation broke a three-month trend and rose in February, rising to 10.4% y/y compared to 10.1% y/y in January and market expectations of 9.9%. Core inflation also rose sharply to 6.2% from 5.8% and half-a-point above market forecasts.

According to The Office for National Statistics (ONS), ‘The increase in the annual inflation rate in February 2023 mainly reflected price rises in the restaurants and hotels, food and non-alcoholic beverages, and clothing and footwear divisions. These were partially offset by downward effects coming from recreation and culture, and from motor fuels within the transport division.’

UK inflation is expected to move sharply lower at the end of Q2, due to lower energy costs, and was recently forecast to hit 2.9% by the end of the year by the Office for Budget Responsibility (OBR).

image1.png

For all market-moving data releases and events, see the DailyFX Economic Calendar

Today’s numbers break a three-month trend of declining inflation in the UK and will add pressure on the BoE to hike interest rates by at least 25bps and maybe even 50bps at tomorrow’s MPC meeting. The UK has so far been immune to the recent global banking crisis but concerns remain that any further bank run may curtail economic growth sharply as banks curb their lending activity.

Cable has pushed higher after the inflation release, buoyed by higher market rate hike expectations. The pair are looking to test the recent double high around 1.2283 before 1.2292 comes into play. Above here, 1.2448 becomes a medium-term target.

Later today we have the latest US monetary policy decision (18:00 GMT). Current expectations are for the Fed to raise interest rates by 25 basis points and give a dovish narrative at the press conference. Any change from expectation will see the US dollar, and cable, move sharply.

GBP/USD Daily Price Chart – March 22, 2023

image2.png

All Charts via TradingView

EUR/USD Price Forecast: Is the Panic Over? Sentiment Reversal Lifts the Euro

EUR/USD Price Forecast: Is the Panic Over? Sentiment Reversal Lifts the Euro

EU Bank Stocks Post Sizeable Rebounds on Culmination of Reassuring News Flow

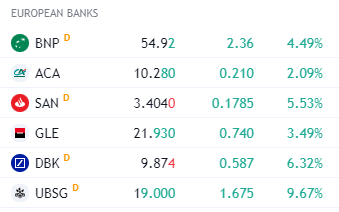
EU banking stocks have been the subject of much scrutiny since the UBS forced acquisition of beleaguered Credit Suisse. Today thus far, there has been an overall improvement in stock prices of a number of large European banks as can be seen in the snapshot below:

EU banks rise across the board (daily percentage change on the far-right column)

image1.png

Source: TradingView, prepared by Richard Snow

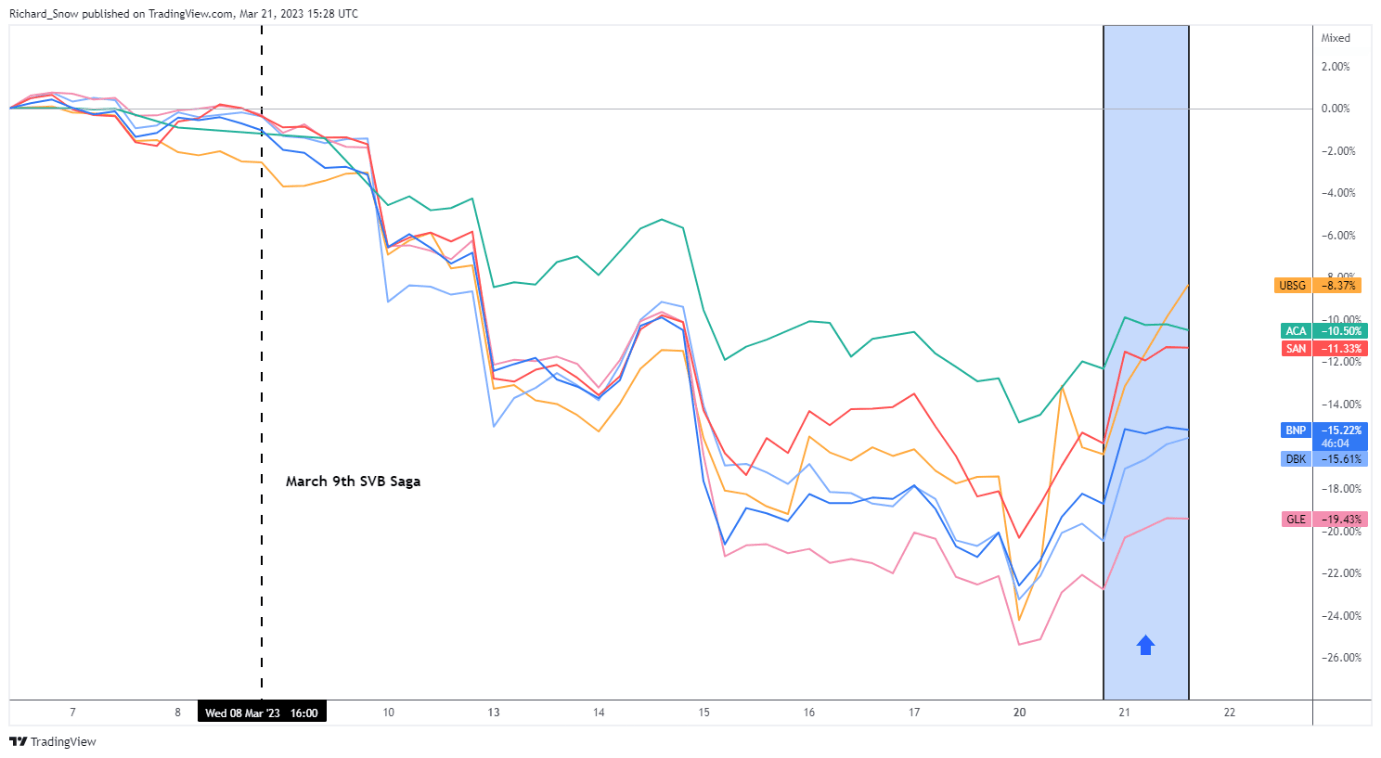
It would appear that recent market fears have calmed. Whether it’s the realization of the different treatment of AT1 bonds outside of Switzerland, or reassurances from the European Central Bank (ECB) and now the S&P ratings agency that echo the sentiment that European banks are able to weather turmoil, EU assets have responded positively.

Furthermore, according to the European Banking Authority’s Chairman Jose Manuel Campa, European banks are also said to not only meet the minimum liquidity requirements but actually hold amounts well in excess of this. He went on further to warn that despite this there is no room for complacency. Major EU banks regained some recent losses.

Decline and Partial Recovery of EU Banking Stocks with Today’s Broad Rise

image2.png

EUR/USD Technical Developments and Levels to Consider

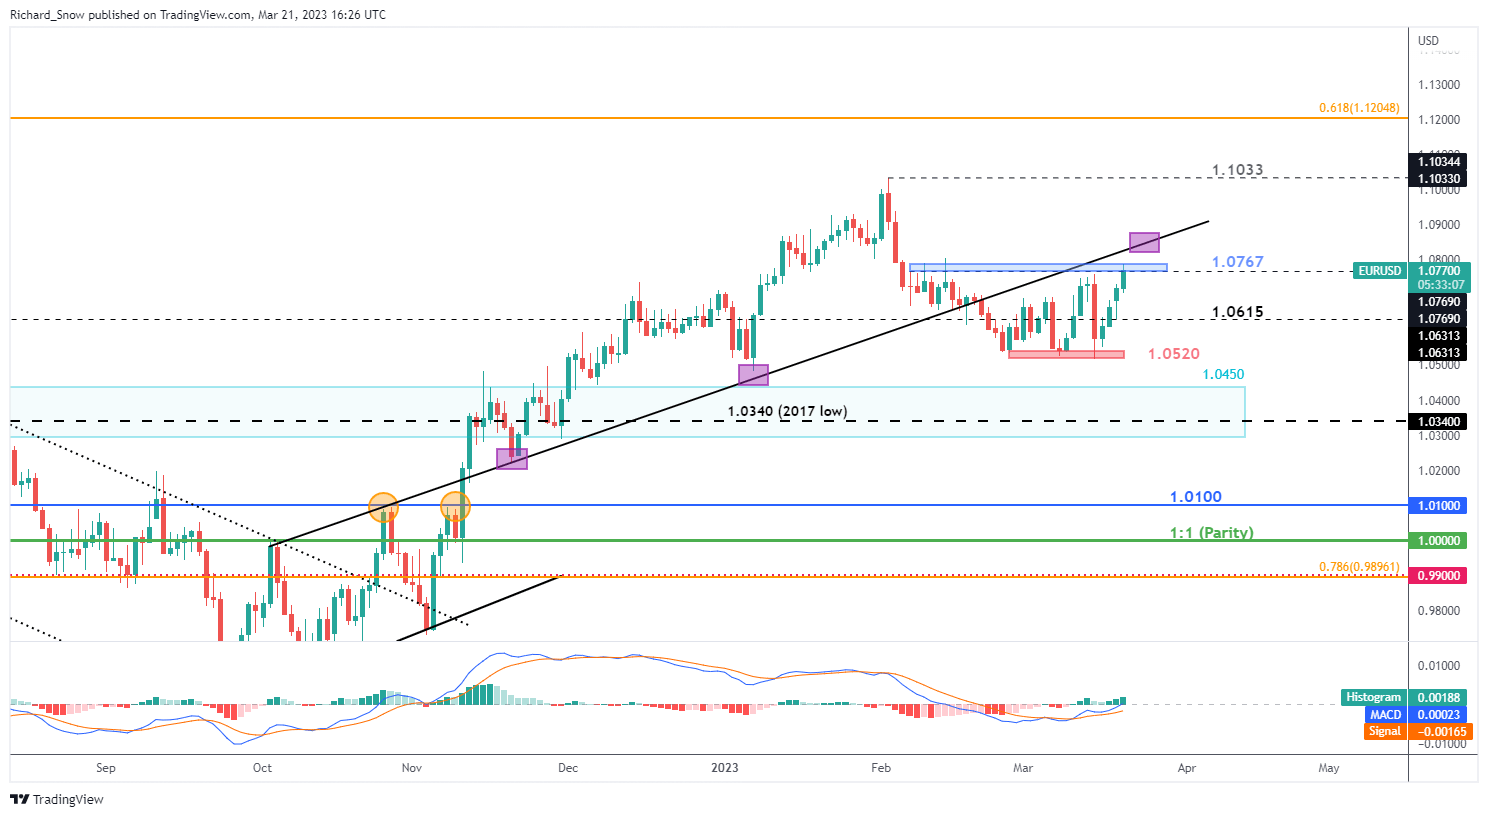
Looking at the EUR/USD daily chart below, the pair continues to trade higher, helped by a dollar sell-off as treasury yields plummeted and what appears to be improved sentiment around the European banking sector with the ECB standing ready with liquidity tools should they be required. However, in financial markets things can change very quickly.

EUR/USD now tests the zone of resistance around 1.0767, where a close above this level seen as the first step to an approach of the yearly high at 1.1033. Before that, the diagonal trendline resistance provides another challenge for EUR/USD bulls as the trendline has proven to act as a pivot point for past price action whether as support or as resistance.

On the short side of EUR/USD, support comes in at 1.0615, followed by the zone of support at 1.0520.

EUR/USD Daily Chart

image3.png

Momentary Banking Calm Redirects Attention to Rate Hikes Again

Now that markets have had tome to assess the rout in the banking sector and whether the EU is more or less vulnerable to a systemic crisis than the rest of the developed world, it appears that the early signs of a return to stability may be in the works.

With markets appearing convinced that the ECB has a handle on things, implied rate probabilities now fully price in a 25-basis point hike anywhere from now until September. According to recent ECB commentary, markets underappreciate the path of future rate hikes, meaning if stability within the banking sector is confirmed, the governing council could still send interest rates even higher (potentially supporting euro valuations) to get inflation under control.

Implied ECB Rate Probabilities

image4.png

Major Risk Events Ahead

The more cautionary ZEW sentiment figures earlier today (EU and Germany) had little influence on EU assets today and the remainder of the week is filled with US high importance data. The FOMC is due to announce whether we see a 25 bps hike or no hike but other, less likely outcomes cannot be ruled out. The summary of economic projections is also due to be released but the relevance of the data will need to be assessed in light of the extreme volatility we have witnessed around fears of a systemic banking crisis. If the numbers were confirmed before March 9th they may not reflect the current landscape.

US Dollar Dips as the Fed Ponders the Inflation Versus Bank Crisis Dilemma

US Dollar Dips as the Fed Ponders the Inflation Versus Bank Crisis Dilemma

The US Dollar is languishing on Wednesday despite Treasury yields ticking up in the North American session and ahead of today’s Federal Reserve rate decision. The DXY (USD) index has sunk to its lowest level since mid-February near 103.

Expectations of a rate move at the Federal Open Market Committee (FOMC) meeting moved slightly toward a 25 basis point hike. Although it is still not fully priced in with the interest rate market weighing the probability of such a move to be around 75%.

The Fed is caught between continuing the fight on problematic inflation and an unfolding banking crisis.

Overnight, the greenback appears to have been undermined by an improvement in risk sentiment that had been under pressure in the wake of the collapse of SVB Finacial.

Treasury Secretary Janet Yellen reassured depositors in US banks overnight. She said that insurance would be provided if other small institutions found themselves in trouble with runs-on deposits.

While the comments may have been a step toward restoring confidence in the banking sector, some cynical market participants have interpreted the comments as indicating that more small and regional banks could surface with issues.

Nonetheless, equity markets, high beta currencies and Treasury yields marched higher into the New York close. Unusually, the US Dollar failed to make headway when yields rose. Bond and equity market volatility eased as shown by the MOVE and VIX indices respectively.

US DOLLAR (DXY), US 2- AND 10-YEAR YIELDS, MOVE INDEX AND VIX INDEX

image1.png

Chart Created in TradingView

DXY (USD) INDEX TECHNICAL ANALYSIS

The DXY index broke above a short-term descending trend line last month but remains in an overall descending trend channel

Since the collapse of SVB Financial, the DXY index has been moving lower and support might be at the recent lows of 102.64 and 102.59 ahead of the prior lows of 100.82 and 99.57.

On the topside, the triple tops seen in the 105.63 – 105.88 area may provide a resistance zone. The previous peaks 107.70 and 1.08.00 could offer resistance ahead of the breakpoints at 109.37 and 109.54.

Gold Price Technical Setup Seems Bearish Before Jerome Powell’s Anticipated Hike

Gold Price Technical Setup Seems Bearish Before Jerome Powell’s Anticipated Hike

Gold prices sank almost 2% on Tuesday, marking the worst single-day performance since February 3rd. The anti-fiat yellow metal struggled amidst a 4.7% increase in the 2-year Treasury yield as the S&P 500 pushed higher. The US benchmark stock index is up about 2.3% this week so far. If equities hold onto their gains, we could be looking at the best week since the end of January.

Calm is appearing to reinforce itself in financial markets after actions were taken to alleviate concerns in the financial sector since Silicon Valley Bank collapsed. The VIX market ‘fear gauge’ is down 16.1% this week so far in the largest decline in about a year. With that in mind, what are the remaining 24 hours looking like for gold?

All eyes are turning to the Federal Reserve rate decision at 18:00 GMT. A 25-basis point rate hike to 5% from 4.75% is priced in. Chair Jerome Powell’s press conference then starts at 18:30 GMT. Since SVB’s collapse, markets have priced in over 100 basis points in cuts towards the end of this year after tomorrow’s delivery. That has benefited the yellow metal.

The Fed faces a tough choice given a lack of timely economic data after SVB’s collapse. This is especially considering that prior to it, inflation expectations were heating up again after solid economic data, especially from the labor market. A pause in the tightening cycle could bode well for gold. But, efforts to continue fighting inflation would likely hurt XAU/USD. As such, volatility risk is elevated.

XAU/USD Daily Chart

From a technical standpoint, things are shaping up to be quite wobbly for gold. That is because a bearish Evening Star candlestick pattern formed. Further downside confirmation would open the door to extending lower, placing the focus on the 100-day Simple Moving Average (SMA). The latter could hold as support pivoting prices higher. Key resistance is the 1978 – 1998 zone from April 2022.

XAU/USD Daily Chart


GBP/USD climbs above 1.2250 on hot UK inflation data

GBP/USD climbs above 1.2250 on hot UK inflation data

GBP/USD has gained traction and advanced beyond 1.2250 early Wednesday. The data published by the UK’s ONS showed that annual CPI rose to 10.4% in February from 10.1%, compared to the market expectation of 9.8%, and provided a boost to Pound Sterling.

Technical Overview

The lower limit of the ascending regression channel coming from early March forms strong support at 1.2200. If that level fails, additional losses toward 1.2150 (static level) and 1.2120 (50-period Simple Moving Average (SMA) on the four-hour chart) could be witnessed.

1.2280 (mid-point of the ascending channel, psychological level) aligns as first resistance before 1.2300 (psychological level) and 1.2340 (upper limit of the ascending channel).

GBP/USD has lost its traction and retreated below 1.2250 early Tuesday after having advanced toward 1.2300 on Monday. As markets remain split on the Bank of England’s (BOE) next policy decision, the Pound Sterling could have a hard time capitalizing on risk flows.

The broad-based selling pressure surrounding the US Dollar provided a boost to GBP/USD on Monday. In the European morning on Tuesday, the US Dollar Index holds steady supported by recovering US Treasury bond yields. The CME Group FedWatch Tool shows that markets are pricing in a more than 80% probability that the US Federal Reserve (Fed) will raise its policy rate by 25 basis points (bps).

On the other hand, there is a nearly 50%, according to futures market positioning, that the BOE will leave its policy rate unchanged on Thursday.

Hence, the possibility of a policy divergence between the Fed and the BOE might not allow GBP/USD to take advantage of the risk-positive market environment.

In the second half of the day, Existing Home Sales for February will be featured in the US economic docket. Investors, however, are likely to ignore this data.

In case risk flows continue to dominate the markets in the American session with Wall Street’s main indexes building on Monday’s gains, the US Dollar could stay on the back foot and help the pair limit its losses even if it struggles to gather bullish momentum.

Taking Your Trading International: Risks and Rewards

Taking Your Trading International: Risks and Rewards

Traders tend to focus on their domestic markets at the start of their careers. That’s natural and understandable enough. Local knowledge of conditions and market dynamics is likely deeper, the essential feeling of being plugged into the economic news cycle that much stronger. At the most basic level we all make more confident decisions when we feel we have more relevant facts at our command. Traders are certainly no different.

However, it’s now very easy to access global assets, be that in the foreign exchange, fixed-income, equity or commodity space. It can be well worth taking advantage of the opportunities offered by a broader geographical spread.

Traders usually look overseas for two main reasons. The first is to diversify trading opportunities, broadening their risk profile and reducing reliance on market conditions in just one place. The second is to take advantage of perhaps better growth prospects elsewhere.

So if you feel it’s time to start trading beyond your borders, what’s the best way to start?

image1.png

Stick to Major Markets At First, They’re Easier to Trade Out Of

When looking at overseas markets for the first time, it’s probably wise to cleave to the major ones. They’ll offer the deepest and most liquid pools of capital and the sort of trading environment that makes it easier to get out if you make a mistake. Which you probably will.

In foreign exchange think of the ‘major’ currencies. The US Dollar and the Euro dominate, with the Japanese Yen, Swiss Franc and British Pound also very widely traded. Below them, the dollars of Australia and Canada are popular trading choices. China’s Renminbi as well as the Hong Kong and New Zealand Dollars round out the global top ten. Those countries’ stocks and bonds are likely the first stops in international trading in those asset classes too.

Are You Risk On, or Risk Off?

Now is certainly an interesting time to consider an overseas approach as we could be seeing a major change. The last couple of decades were years of extraordinary connectivity between global markets as economies became more and more globalized, inflation was docile and interest rates low.

The effect of this was to sort nearly all global assets into just two camps, which went by the somewhat bizarre monikers of ‘risk on’ and ‘risk off.’ What they meant was that, when a piece of economic data was released suggesting stronger growth ahead – perky US employment figures, strong Chinese industrial production or what have you – the ‘risk on’ assets would rise in impressive unison.

These included stock markets, industrial commodities and the currencies of major commodity producers, such as Australia and Canada. The stronger global growth was, the greater the demand for commodities and the currencies needed to buy them. That’s a fairly clear correlation.

On the flipside, weaker economic numbers would see ‘risk off’ assets supported. The ranks of these included perceived ‘haven’ currencies like the Swiss Franc along with gold, bonds and, often, for specific reasons of its own, the Japanese Yen. With ultra-low interest rates long the norm in Japan, it’s hard to see the Yen as any kind of real haven for investors. But those same low rates forced Japanese investors to look overseas for yield. When overseas growth seemed threatened, a lot of that cash came home.

This market connectivity was enhanced by the monetarism which had gained force since the early 1980s, part of a concerted global effort to smash the inflationary forces which had played hell with developed economies in the 1960s and ‘70s. Interest rate policy became the key global market driver, much as industrial policy had been in the generation before. The US Federal Reserve tended to run this table, with just about every traded market on Earth reacting to what the Fed did, said and implied about the future.

It still does. Other major central banks tend to shadow the Fed to some extent, but they, too generate significant cross-market impact.

We’re still living in that world to a very large degree, but it’s clear that some changes have taken place over the past twelve months. An inflation surge, the Covid pandemic’s supply chain destruction and war in Ukraine have all taken their toll, as have deteriorating relations between China and the West. Previously unchallenged, even economic globalization is up for debate as never before. Nervous Western politicians increasingly seek supply security rather than merely encouraging ever-freer trade.

So, What Now?

For the trader considering a move out of his or her home market these are certainly interesting times. If current conditions persist we are likely to see more fragmented, less correlated and less liquid markets. These will of course bring opportunities of their own, but taking advantage of these will very likely require a lot more learning and judgement than would have been the case in a more globalized world.

It’s likely that those countries most successful in the anti-inflation fight, and their markets, are going to be the near-term winners. But the extent to which that dynamic replaces the old risk calculus, and how durably, is perhaps the most important thing for would-be global traders to weigh up right now.

China cuts the RRR and leaves LPRs unchanged – UOB

China cuts the RRR and leaves LPRs unchanged – UOB

Economist Ho Woei Chen at UOB Group comments on the latest interest rate decisions by the PBoC.

Key Takeaways

“From 27 Mar, banks’ reserve requirement ratio (RRR) will be lowered by 25 bps to bring the effective RRR to 7.6%.”

“The 25 bps cut to the RRR is estimated to release CNY500 bn of long-term liquidity into the system. This is in addition to net injections of CNY559 bn via the 1Y medium-term lending facility (MLF) since the start of the year.”

“Banks have issued a record CNY6.71 tn of new loans in the first two months of the year (vs. CNY5.21 tn in the same period of 2022) and there may be concerns that the pace of credit expansion could ease sharply in the later part of the year.”

“The 1Y and 5Y loan prime rates (LPR) were unchanged at 3.65% and 4.30% respectively in Mar for the 7th straight month.”

“We now see the 1Y MLF rate to remain steady at 2.75% and consequently the 1Y LPR at 3.65%, for the rest of 2023. More important to watch will be the 5Y LPR as a reduction to the rate will signal stronger government support to the real estate sector. However, another RRR reduction later this year cannot be ruled out.”

Gold Price Forecast: Pullback reaches bottom of rising channel, threatening breakout lower

Gold Price Forecast: Pullback reaches bottom of rising channel, threatening breakout lower

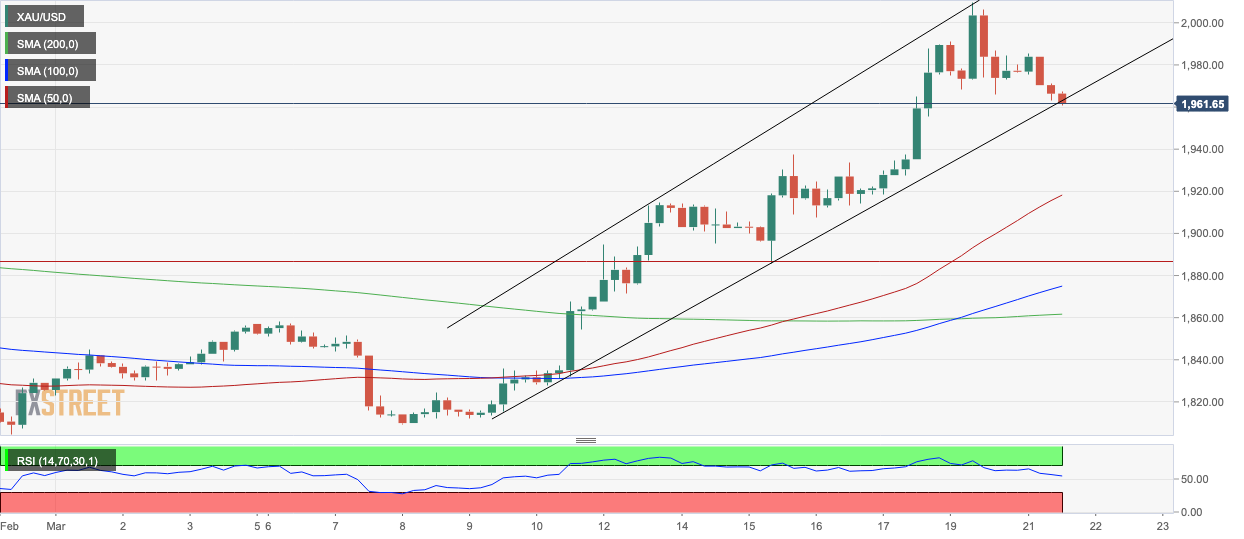
Gold price pulls back from its yearly high as global banking jitters pass (for now) and US Treasury yields find a floor, supporting a stronger US Dollar. The precious metal trades at $1,961 at the time of writing. It has reached a crticial technical level at the base of a rising channel and is threatening to breakout lower, potentially bringing into question the continuity of the established uptrend, see the technical section below for more details.

Gold news: Safe-haven flows ease on banking rescue

The dust settles after the latest casualty of the current neo-financial crisis, Credit Suisse, was swallowed up by rival UBS on Monday, and Gold – the safe-haven par excellence – loses the upside momentum that propelled it to YTD highs above $2,000.

In the United States, treasury staff are looking at ways for regulators to insure more than the current Federal Deposit Insurance Cap (FDIC) of $250,000 for bank deposits, to increase confidence in the banking system, according to a report by Bloomberg News on Monday. This adds to all the support already provided by authorities, estimated at half the cost of the 2008 financial crisis bailout and provides further evidence to reassure investors that authorities are willing to step in to save the day.

US Dollar rallies before FOMC

The US Dollar is on the rise, reflected in the 0.20% gain seen in the US Dollar Index on the day, which tracks the world’s reserve currency against a basket of counterparts. Since Gold is priced in US Dollars, it tends to have an inverse relationship – when the Dollar strengthens it takes less of them to buy the same quantity of Gold, all other things being equal.

Highly correlated to the US Dollar are Treasury yields which are also up, rising from a nadir of 3.30% on Monday during the depths of the turmoil to 3.54% at the time of writing – for the benchmark 10-year US Treasury bond. Gold tends to fall when yields rise as they indicate rising interest rates and therfore a higher opportunity cost for investing Gold, which is non-yielding.

From a technical perspective the chart of the 10-year Treasury yield is also showing a long pin-like hammer candlestick formed yesterday, which looks very much like it is marking the end of the trend down that started as the March 2 highs rolled over. These sorts of candlesticks are quite rare and often denote a reversal of trend, and if that is the case this time it could signal the start of a short-term uptrend for yields.

The next big event for both Gold and the US Dollar is the FOMC meeting on Wednesday, March 22 at 18:00 GMT, at which the US Federal Reserve will make its next monetary policy decision. The odds currently favor a more-modest-than-was-previously-expected 0.25% increase in interest rates.

If the Fed decides to go big with a 0.50% rate hike, however, it will boost the Dollar and push down Gold price – no cut at all will have the opposite effect.

Making the decision a little more complicated this time, however, is the recent banking crisis which was triggered in part by rising interest rates. Whilst the Fed wants to battle inflation, it must now also take into consideration the impact of higher interest rates on financial stability.

Yohay Elam, Product Manager, Premium Offering at FXStreet, expects the Fed to map a hawkish course, at least intiially, prioritising price stability over financial stability.

“‘Nothing to see here, move along’ – that is how I expect the Federal Reserve to act in the wake of the banking crisis, raising rates to fight inflation as if the world hasn’t changed.” Says Elam in a preview of the meeting.

He notes the sudden ballooning of the Fed’s balance sheet over recent weeks since the banking crisis began and it stepped in to provide emergency liquidity to the US banking sector. This he argues is evidence that ‘easing by other means’ is ocurring, and suggests the Fed will feel justified in continuing with its aggresive rate hiking agenda.

Yet, he thinks Chariman Powell will temper the hawkish decision with a more nuanced press confernece speech, that will mean little if any net upside for the US Dollar overall.

“The short version of my scenario is: risk-off on the rate hike and the dot plot, followed by an immediate and slight recovery in response to the statement. Then, Powell would further boost the risk-on mood with promises to react to the situation and with caring words about the labor market.” Says Elam.

Gold price technical analysis: Pullback reaches channel line

From a technical perspective Gold price remains in an uptrend both on the short and medium timeframe, however, it has pulled back down to the base of its rising channel and now threatens to break out lower, something which would bring into doubt the short-term uptrend.

A decisive break and close below the lower channel line at $1,960 would signal a breakout to the downside with an eventual target equal to the width of the channel extrapolated lower, which would suggest a target at around $1,920. This also happens to be near the level of the 50-4hr Simple Moving Average (SMA), a level that is likely to provide a safety net for falling price.

The Relative Strength Index (RSI) is corroborating the bearish downturn in price action as it is falling in line with price. On the daily chart of Gold price, the RSI is about to exit the overbought region above 70 and if today ends relatively bearishly as looks likely, it will confirm an exit, providing a signal to go short.
 

GBP/USD Price Analysis: Keeps the red around mid-1.2200s, downside remains cushioned

GBP/USD Price Analysis: Keeps the red around mid-1.2200s, downside remains cushioned

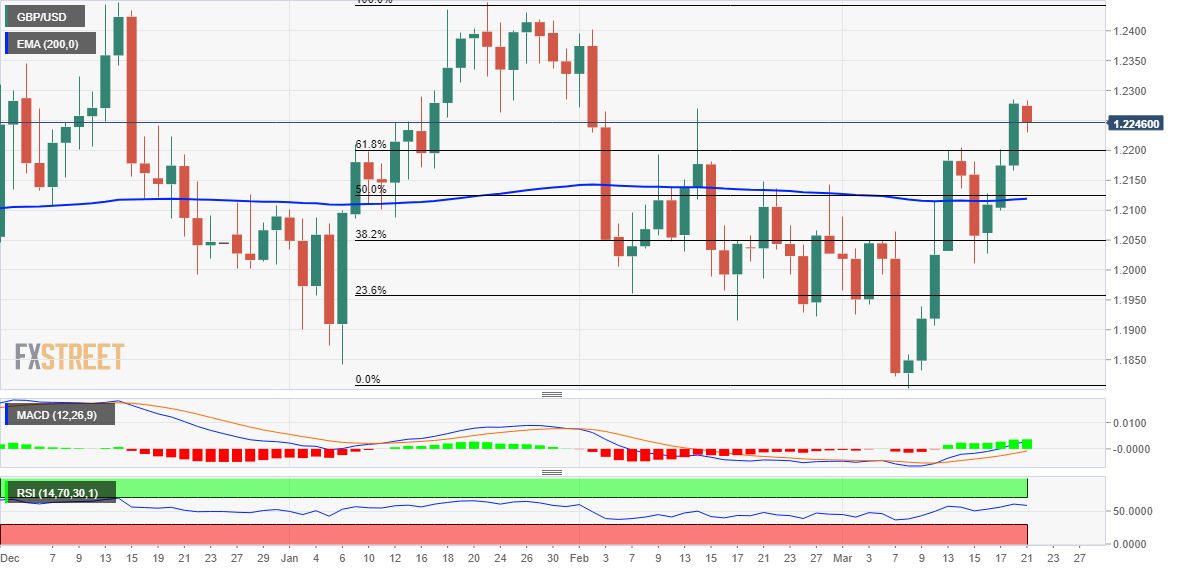
The GBP/USD pair stalls a three-day-old uptrend on Tuesday and retreats from its highest level since early February touched the previous day. The pair maintains its offered tone through the early North American session and is currently placed just below the mid-1.2200s, though lacks follow-through.

The pullback could be attributed to some repositioning trade ahead of this week’s key central bank event risks – the crucial FOMC policy decision on Wednesday, followed by the Bank of England (BoE) meeting on Thursday. In the meantime, the prospects for a less hawkish Federal Reserve (Fed), along with a strong follow-through rally in the equity markets, drag the safe-haven US Dollar (USD) to a fresh five-week low and lends support to the GBP/USD pair.

From a technical perspective, the overnight breakout through the 1.2200 mark, or the 61.8% Fibonacci retracement level of the January-March downfall was seen as a fresh trigger for bulls. Moreover, oscillators on the daily chart are holding in positive territory and are still far from being in the overbought zone. This suggests that the path of least resistance for the GBP/USD pair is to the upside and supports prospects for the emergence of some dip-buying at lower levels.

That said, it will still be prudent to wait for some follow-through buying beyond the monthly top, around the 1.2285 region set on Monday, before positioning for any further gains. The GBP/USD pair might then climb to test the next relevant hurdle near the 1.2320 region before eventually aiming to reclaim the 1.2400 round-figure mark. The momentum could get extended further towards the double-top resistance near the 1.2450 region, or the YTD peak touched in January.

On the flip side, 61.8% Fibo. level, around the 1.2200 mark, now seems to protect the immediate downside. Sustained weakness below might prompt some technical selling and drag the GBP/USD pair towards the 1.2125 confluence support. The latter comprises 50% Fibo. level and the 200-day Exponential Moving Average (SMA), which if broken decisively might shift the near-term bias back in favour of bearish traders and pave the way for deeper losses.

GBP/USD daily chart

fxsoriginal

EUR/USD continues to push higher toward 1.0800 on broad USD weakness

EUR/USD continues to push higher toward 1.0800 on broad USD weakness

EUR/USD preserves its bullish momentum and continues to push higher toward 1.0800 on Tuesday. The positive shift witnessed in risk sentiment doesn’t allow the US Dollar to find demand and helps the pair push higher. Existing Home Sales will be featured in the US economic docket.

The Relative Strength Index (RSI) indicator on the four-hour chart holds comfortably above 50, suggesting that buyers remain in control. On the upside, 1.0750 (static level) aligns as key resistance. In case the pair manages to flip that level into support, it could target 1.0770 (static level) and 1.0800 (static level, psychological level) next.

First support is located at 1.0700 (psychological level, static level, ascending trend line) before 1.0660 (200-period Simple Moving Average (SMA)) and 1.0640 (100-period SMA).

Following a consolidation phase at around 1.0700 in the Asian session, EUR/USD has regained its traction and climbed to a weekly highs above 1.0730 in the European morning. Although the positive shift witnessed in risk sentiment could help the pair keep its footing, investors could refrain from betting on a steady uptrend ahead of the US Federal Reserve’s (Fed) policy announcements.

While testifying before the European Parliament on Monday, European Central Bank (ECB) President Christine Lagarde noted that they would have indicated that further rate hikes will be needed if there were no tensions in markets. She also repeated that inflation in the Eurozone is projected to remain too high for too long. These comments failed to trigger a noticeable market reaction but allowed the Euro to stay resilient against its major rivals.

Reflecting the upbeat market mood, Euro Stoxx 50 is up more than 1.5% in the early European session. Moreover, US stock index futures are up around 0.3%.

ZEW Survey’s Economic Sentiment Index for Germany and the Eurozone will be featured in the European economic docket. The survey is forecast to reveal a deterioration in sentiment in March due to the Silicon Valley Bank and Credit Suisse turmoil. In case the decline is more severe than expected, the Euro could lose some interest with the immediate reaction.

In the second half of the day, Existing Home Sales from the US will be looked upon for fresh impetus. As mentioned above, however, markets are unlikely to take large positions before the Fed’s rate decision on Wednesday.