USD/CAD sits above mid-1.3800s, highest since October ahead of Canadian/US jobs data

USD/CAD sits above mid-1.3800s, highest since October ahead of Canadian/US jobs data

The USD/CAD pair adds to its strong weekly gains and climbs to its highest level since October 17, 2022, around the 1.3860 area during the first half of the European session on Friday.

The selling pressure around Crude Oil prices remains unabated for the fourth straight day, which undermines the commodity-linked Loonie and acts as a tailwind for the USD/CAD pair. In fact, the black liquid remains on track to register its worst fall since early February amid worries that slowing global economic growth will dent fuel demand. Apart from this, the fact that the Bank of Canada (BoC) became the first major central bank to pause its rate-hiking cycle on Wednesday is seen as another factor weighing on the Canadian Dollar.

The aforementioned factors, to a larger extent, helps offset a modest US Dollar weakness and continue to push the USD/CAD pair higher. Data released on Thursday showed a larger-than-expected rise in the US Weekly Jobless Claims, which was seen as the first sign of a softening labor market. This, in turn, forced investors to re-evaluate the possibility of a  50 bps lift-off at the upcoming FOMC meeting on March 21-22, leading to a further decline in the US Treasury bond yields and exerting some follow-through pressure on the Greenback.

That said, the prevalent risk-off environment – amid looming recession risks – helps limit losses for the safe-haven buck, at least for the time being. The market sentiment remains fragile in the wake of worries about economic headwinds stemming from rising borrowing costs, which is reinforced by a further deepening of the yield curve. Adding to this, the incoming softer Chinese macro data dashed hopes for a strong recovery in the world’s second-largest economy. This, in turn, tempers investors’ appetite for perceived riskier assets.

The USD/CAD bulls, meanwhile, might prefer to take a breather amid a slightly overbought Relative Strength Index (RSO) on the daily chart and ahead of the closely-watched US monthly employment details. The popularly known NFP report is more likely to overshadow the Canadian jobs data and play a key role in influencing the pair’s near-term trajectory. The focus will then shift to the latest US consumer inflation figures, due for release next Tuesday.

China’s Consumer Spending Is Showing Signs of Strong Rebound

China’s Consumer Spending Is Showing Signs of Strong Rebound

Consumer spending in China has picked up rapidly in recent weeks, especially on eating out and travel, giving a boost to an economic recovery that’s become increasingly reliant on local demand.

High-frequency indicators of spending in some sectors have shown double-digit growth from a year ago, while leading travel companies and retailers have reported a strong increase in sales so far this year.

China’s consumers are in focus after a government meeting this week suggested officials would avoid large stimulus through infrastructure investment or the property market — leaving household spending to drive demand in the world’s second-largest economy.

A consumer rebound will also help offset the slump in exports as economic growth in some of China’s key markets, like the US and Europe, weakens. After three years of on-off Covid restrictions, economists are betting consumers will help drive China’s growth to above 5% this year.

High-frequency data support anecdotal reports of packed restaurants in cities such as Beijing. A rolling 30-day average of restaurant revenues in major cities tracked by BigOne Lab, a China-based data provider, recorded 24% year-on-year growth in early February.

Mobility indicators — such as road and subway travel — which tend to track consumer spending, also saw strong growth in recent weeks. An index of traffic congestion in China’s 15 largest cities compiled by BloombergNEF reached its highest reading in more than a year in February.

Investors remain cautious about the outlook, though, concerned by the lack of economic stimulus from officials at the National People’s Congress, the annual parliamentary gathering this week. The MSCI China Index erased all its gains for the year on Friday, dropping as much as 2.2%.

Beijing has refrained from the direct cash handouts to consumers seen in other countries, betting that a recovery in hiring will lead households to spend more.

Online retailer JD.com, whose shares slumped Thursday because of weak revenue last quarter, warned of a gradual rebound in sentiment. While social-contact related consumption, like restaurants and tourism, was recovering quickly, hiring by small and medium-sized companies “would take some time” to pass through to a full recovery in consumer confidence, the company’s Chief Executive Officer Xu Lei said on a conference call this week.

Retail Sales Rebound

After declining each month of the last quarter, retail sales for the first two months of the year — due to be released on March 15 — will likely show a year-on-year increase of 3.5%, according to economists in a Bloomberg survey.

That data probably won’t reflect recent strength in consumer spending, as it incorporates data from January, when China was hit by a wave of coronavirus infections that followed the government’s sudden ending of Covid restrictions.

A measure of Chinese consumer confidence by Morning Consult, a US consultancy, rose to the highest level in nine months in February.

“February should look much better than January,” especially in sectors such as car sales, said Larry Hu, head of China economics at Macquarie Group Ltd.

Car sales in China, a key component of retail sales, grew 10.4% in February from a year earlier, the China Passenger Vehicle Association said this week. The auto market is poised for a “period of steady growth,” the association’s Secretary General Cui Dongshu said.

Travel within China is picking up quickly, with the number of domestic flights in February up 17.2% on the same month in 2022, according to data from VariFlight Technology Co.

Short-haul travel has already reached nearly double the levels before the pandemic, Jane Sun, chief executive of online travel agency Trip.com told investors this week.

Some chains are already reporting better sales. Chinese budget retailer Miniso Group Holding Ltd. said on February 28 that sales in its physical stores have increased 20% year-on-year so far this quarter.

Consumers are also flocking to cinemas, with the value of movie ticket sales in the first nine weeks of the year rose 11.8% from the same period in 2022 to reach over 14 billion yuan ($2 billion), according to latest data from Maoyan Entertainment.

While consumer price inflation slowed to a one-year low of 1% in February, that doesn’t mean the consumption recovery was soft, Citigroup Inc. economists led by Yu Xiangrong wrote in a note.

“The rise in rent prices and solid domestic mobility data seem to suggest that recovery is in shape,” they said.

–With assistance from Danny Lee, Linda Lew and Fran Wang.

US Dollar Setups: Key Tech Levels on EUR/USD and USD/CAD ahead of NFP

US Dollar Setups: Key Tech Levels on EUR/USD and USD/CAD ahead of NFP

The U.S. dollar, as measured by the DXY index, pulled back modestly on Thursday but remained near three-month highs, in a session characterized by wild swings across asset classes and a sharp retreat in U.S. bond yields, ahead of the U.S. nonfarm payrolls report slated to be released Friday morning.

The February employment survey is forecast to show a downshift in hiring, with analysts anticipating a gain of 205,000 jobs after January’s stunning 517,000 surge. The strength of the report will be key in determining the trajectory of monetary policy, so traders should keep an eye on the economic calendar.

The Fed has indicated that its terminal rate is likely to settle higher than initially anticipated and that the bank is prepared to accelerate the pace of tightening if warranted by the totality of incoming information. Because of this data-dependency bias, tomorrow’s NFP numbers will take on particular significance, helping set the trading tone in the FX space.

With volatility seen rising across U.S. dollar forex pairs in the near term, these are the key technical levels to watch on EUR/USD and USD/CAD over the coming days.

EUR/USD Bullish

EUR/USD TECHNICAL ANALYSIS

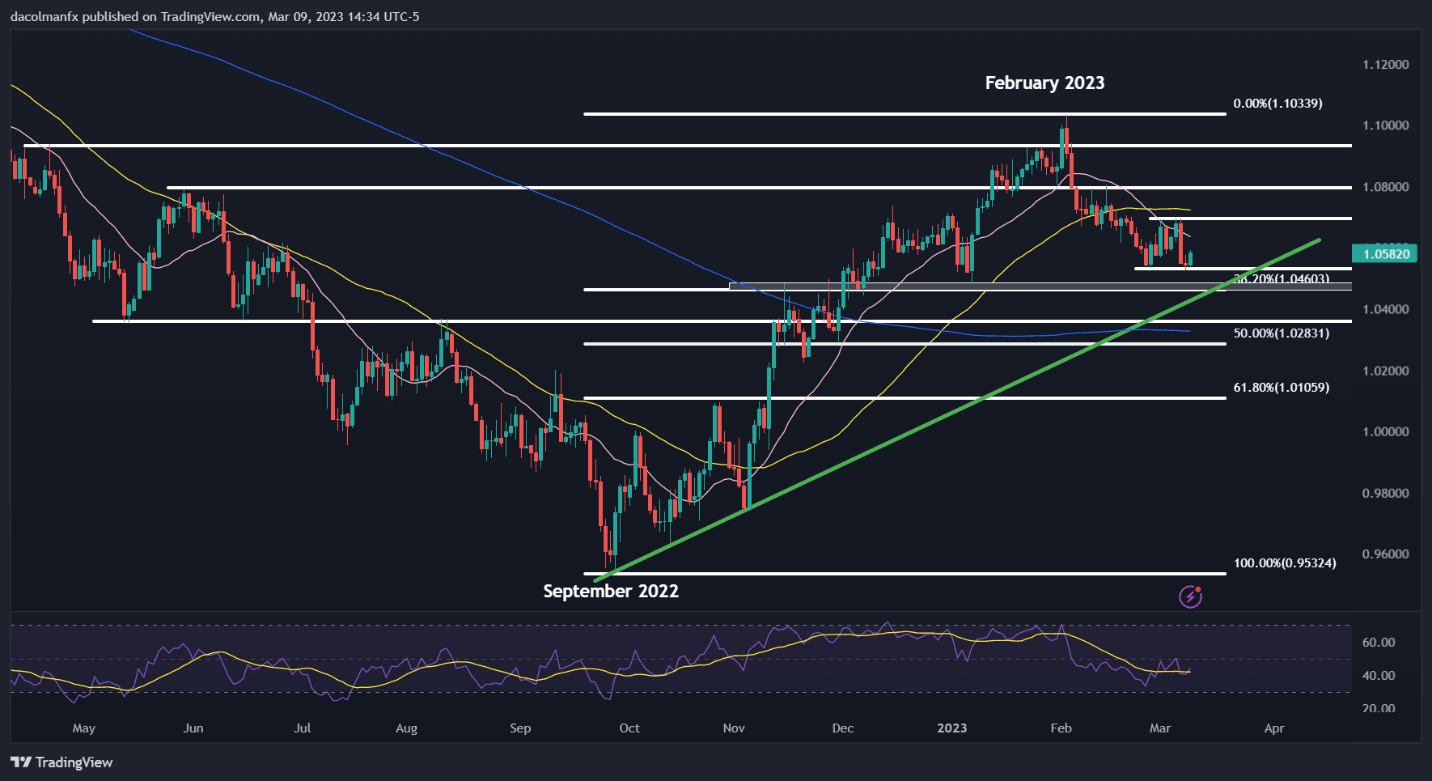
Powell’s hawkish commentary on Tuesday drove EUR/USD sharply lower, but the pair encountered support around the February low prior to staging a moderate rebound off of those levels. If prices remain in recovery mode, initial resistance appears at 1.0690. On further strength, the focus shifts to the psychological 1.0800 handle.

On the other hand, if sellers return and upside pressure fades, the first technical floor to watch rests near 1.0530. If this region is breached on the downside, bears could launch an assault on 1.0485/1.0460, an area where the January low converges with a medium-term rising trendline and the 38.2% Fibonacci retracement of the September 2022/February 2023 rally.

EUR/USD TECHNICAL CHART

Chart, histogram  Description automatically generated

EUR/USD Chart Prepared Using TradingView

USD/CAD TECHNICAL ANALYSIS

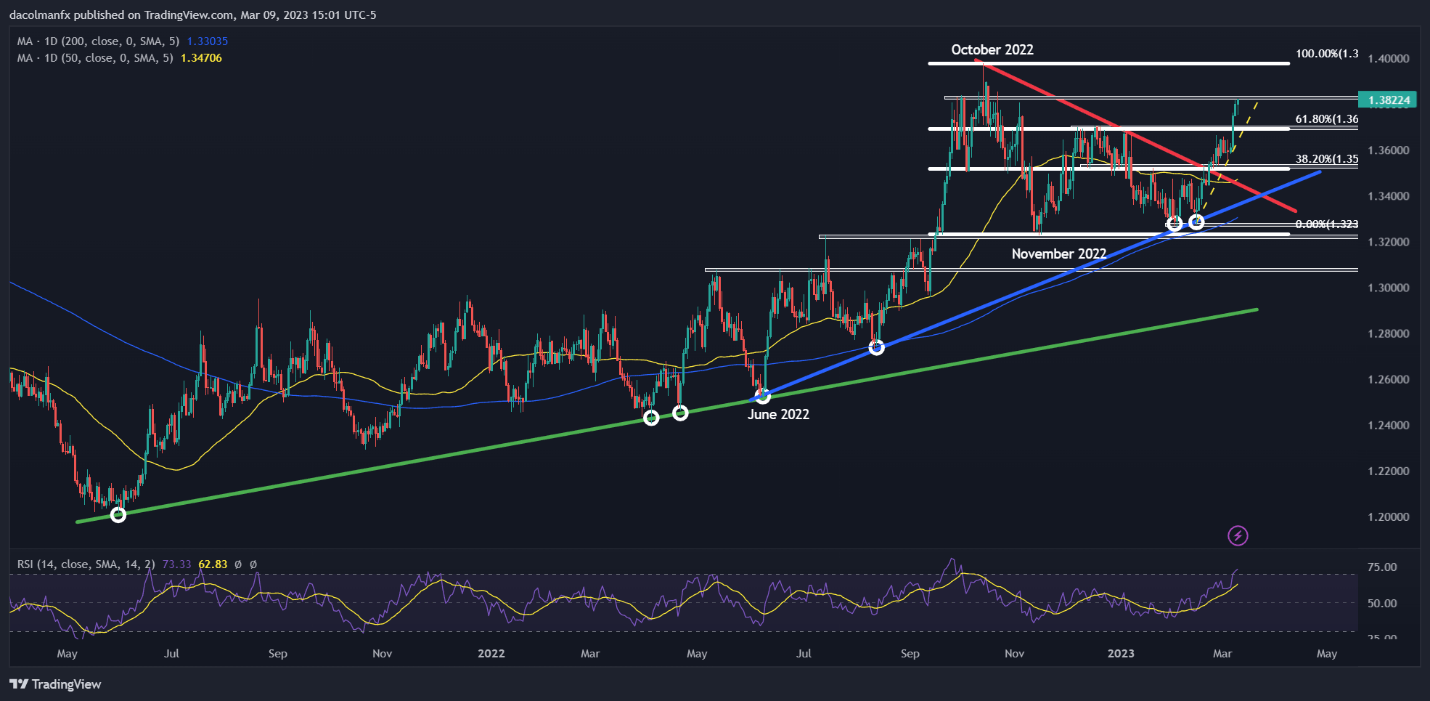
USD/CAD has staged a strong rally this week, with the upside move reinforced by the Fed chair’s aggressive tightening message and Bank of Canada’s dovish guidance. At the time of writing, the exchange rate is hovering slightly below an important technical resistance near 1.3840, which corresponds to September 2022’s high. If bulls manage to take out this barrier, USD/CAD could be on its way to retesting its 2022 peak.

On the flip side, if prices turn lower from current levels, the first significant support to consider lies around 1.3690. Below that floor, the next area of interest comes at 1.3117, followed by 1.3465.

USD/CAD TECHNICAL CHART

Chart, line chart, histogram  Description automatically generated

USD/CAD Chart Prepared Using TradingView

Euro Price Forecast: German CPI Boosts EUR/USD Ahead of NFP and the ECB’s Christine Lagarde

Euro Price Forecast: German CPI Boosts EUR/USD Ahead of NFP and the ECB’s Christine Lagarde

EURO FUNDAMENTAL BACKDROP

The euro gathered some support this Friday morning with a marginally weaker USD and better than expected German CPI data (see economic calendar below). Although actual numbers printed in line with forecasts, the 8.7% figure highlights the elevated and stubborn inflationary pressures in Germany. With Germany being the largest economy within the eurozone, the inflation release acts as a proxy for the broader region, adding to hawkish sentiments from the European Central Bank (ECB).

EUR/USD ECONOMIC CALENDAR

image1.png

The focus for today is firmly on the US Non-Farm Payroll (NFP) release with projections at 205K. If the last 12 months is anything to go by, we could easily see a figure higher than this, leaving room for more hawkish repricing and possibly cementing a 50bps rate hike in the Fed’s upcoming meeting – currently priced around 36.60bps showing no distinct bias just yet (see table below). While Fed pricing remains in a state of indecision, the ECB’s March meeting looks to be a sure thing at 50bps, placing added interest on the upcoming NFP report. Two other key metrics of the NFP report will come via the unemployment and wage figures with wages being a key contributor to high inflation through the services sector.

To close out the trading session from a EUR/USD perspective, the ECB’s Christine Lagarde is scheduled to speak and may look to reiterate the need to quell inflation after German data today.

FEDERAL RESERVE INTEREST RATE PROBABILITIES

image2.png

ECB INTEREST RATE PROBABILITIES

image3.png

TECHNICAL ANALYSIS

EUR/USD DAILY CHART

image4.png

Japanese Yen Plunges Vs US Dollar As BOJ Keeps Policy Settings Unchanged

Japanese Yen Plunges Vs US Dollar As BOJ Keeps Policy Settings Unchanged

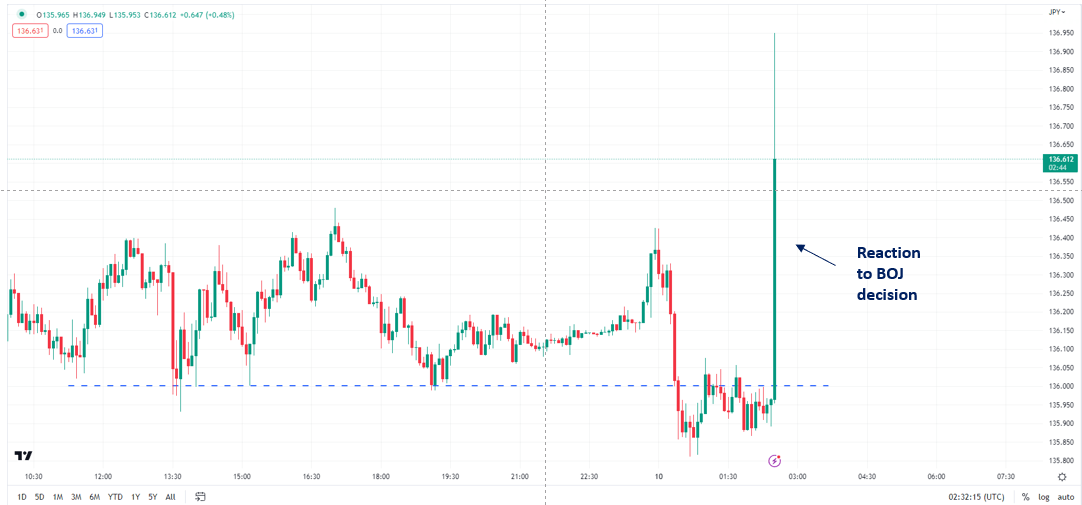
The Japanese yen fell sharply against the US dollar on Friday after the Bank of Japan left interest rates unchanged and maintained its current bond-yield curve control policy settings.

In his last meeting as the BOJ Governor Haruhiko Kuroda left policy settings steady, in line with expectations, given the Japanese central bank adjusted the yield band as recently as December. Incoming BOJ Governor Kazuo Ueda has said the central bank must maintain its current ultra-easy policy for now until there are signs that inflation has sustained above BOJ’s 2% target.

USD/JPY 5-minute Chart

image1.png

Chart Created Using TradingView

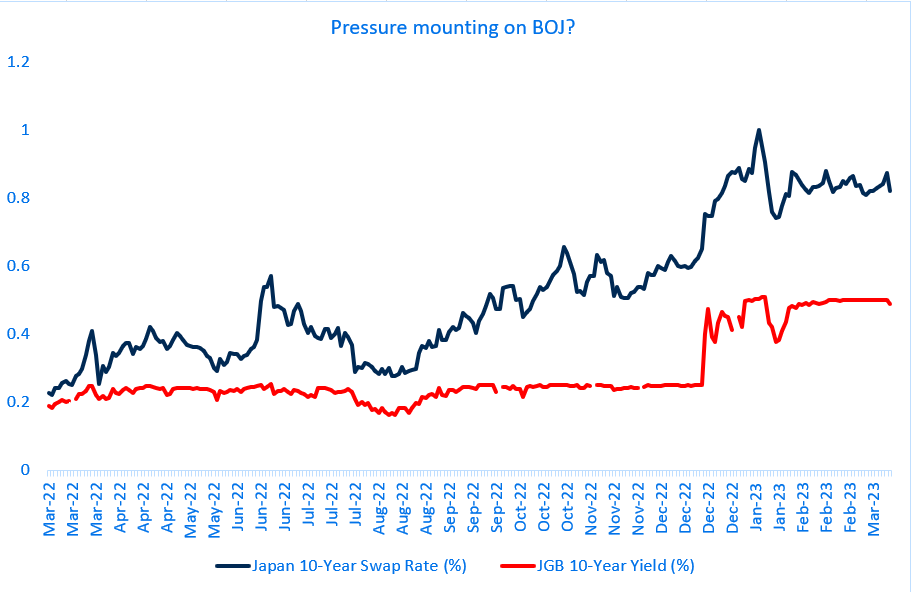
Ueda has attempted to cool speculation of an earlier-than-expected normalization of policy rates, but for financial markets, policy tweaks could come in sooner rather than later given the distortions caused by the yield curve control policy and inflation at a four-decade high. The focus now shifts to the next BOJ meeting April 27-28, Ueda’s first meeting as the chair. Ueda has said he has ideas on how the central bank could exit its massive stimulus, but monetary tightening is a possibility only if big improvements are made in Japan’s ‘trend inflation’.

JGB 10-Year Yield Vs Japan 10-Year Swap Rate Chart

Chart  Description automatically generated

Source: Bloomberg

The immediate focus for markets shifts to US jobs data due later today – growth of the non-farm payroll likely slowed to 224,000 in February, slower from 443,000 in January, and unemployment is expected to hold near the five-decade low of 3.4%. In his semi-annual testimony to Congress,US Fed Chair Powell stepped up hawkishness, saying the ultimate rate peak is likely to be higher than expected and the central bank is prepared to increase the pace of rate hikes, depending on incoming data.

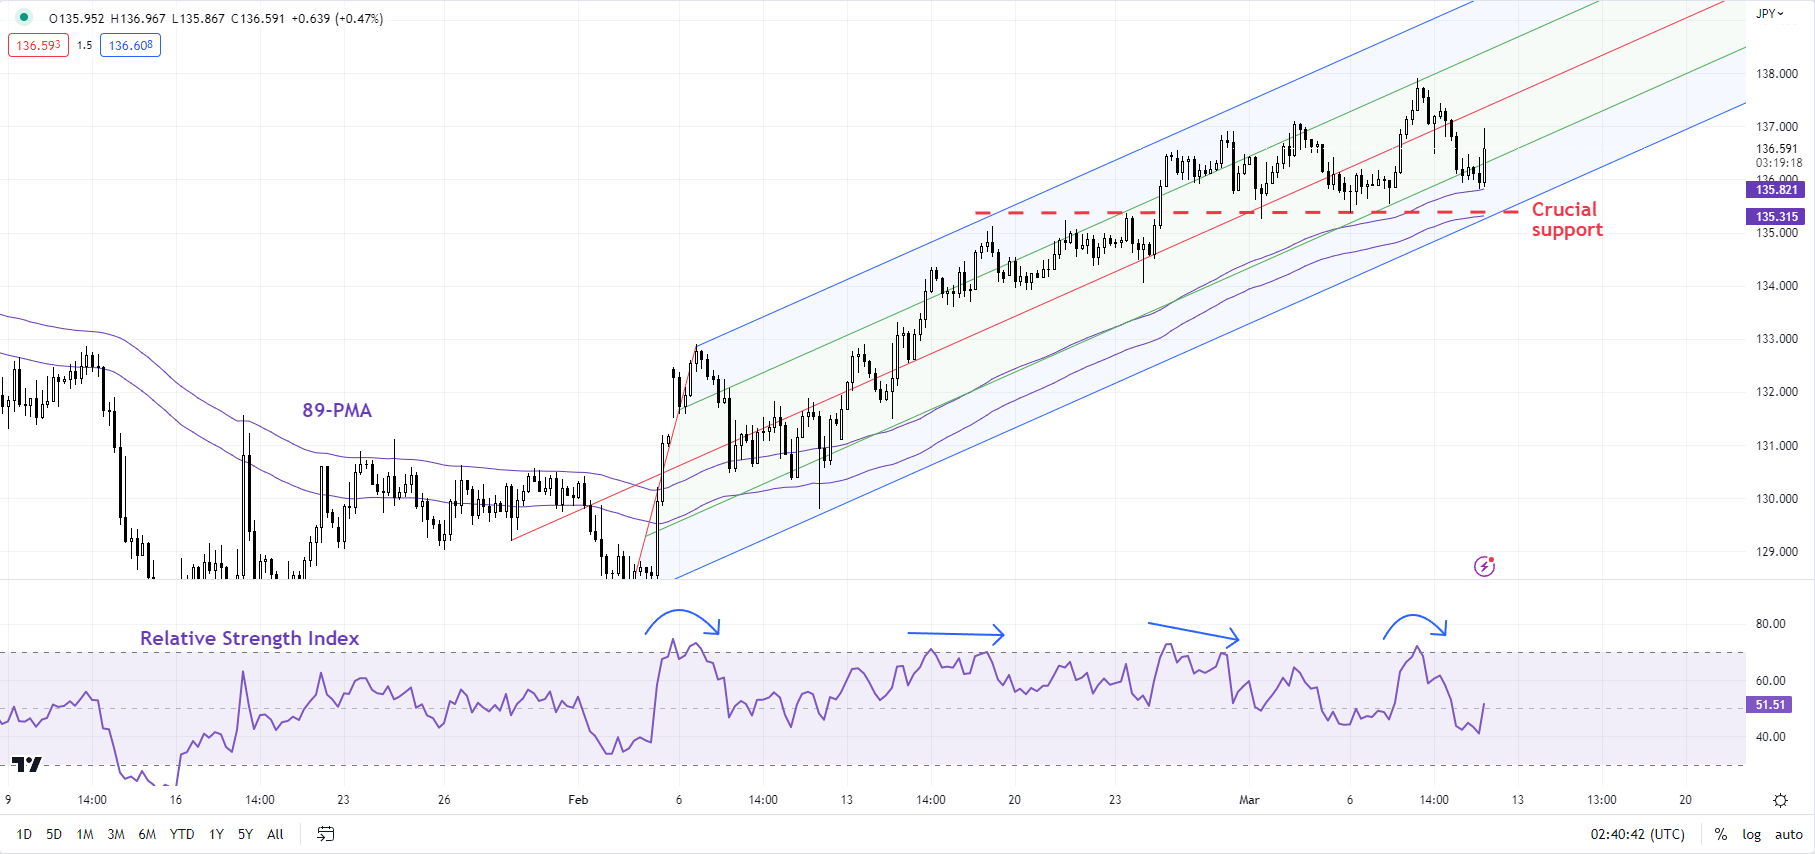
On technical charts, USD/JPY has struggled to cross above a solid cap of around 137.00-138.20, including the 200-day moving average and the December high of 138.20. For more discussion, see “Japanese Yen Forecast: High Bar for USD/JPY to Crack Resistance”, published February 26.

USD/JPY 240-minute Chart

image3.png

Chart Created Using TradingView

The failure to sustain gains this week above a brief break above resistance at the early-March high of 137.09 is a sign that USD/JPY’s six-week-long rally is losing steam. However, the pair would need to break below support on a horizontal trendline from mid-February at about 135.25 to confirm that the upward pressure is fading.

Gold Prices Soar as US Bank Sector Woes Sink Bond Yields, Eyes on NFPs Next

Gold Prices Soar as US Bank Sector Woes Sink Bond Yields, Eyes on NFPs Next

Gold prices rocketed higher on Thursday in an overall volatile 24 hours, finishing higher by 0.86%. That was the best single-day performance in almost one week. Most of the price action occurred during the Wall Street trading session. There, the Dow Jones, S&P 500 and Nasdaq 100 plunged as the VIX market ‘fear gauge’ soared.

Most of the weariness was driven by concerns about the banking sector. This followed SVB Financial Group trying to shore up capital and Silvergate – a crypto-focused bank – winding down operations.

These events are another sign that historically high interest rates are taking their toll on the economy. It pushes investors away from riskier investments when you can earn a much better return in ‘risk-free’ Treasuries.

Concerns about the banking sector ate away at future Federal Reserve interest rate hike expectations. In fact, markets priced out one full 25-basis point rate hike in one-years’ time. This is what plunged Treasury yields over the past 24 hours. For gold, this is great news. Gold is an anti-fiat instrument. When the expected return on cash could fall in the future, that tends to produce a friendly environment for it.

With that in mind, the next critical piece of economic data is the non-farm payrolls report, due at 13:30 GMT. The US is seen adding 225k jobs in February with the unemployment rate holding steady at 3.4%. A still-solid jobs report could pour cold waters on less-hawkish Fed policy expectations. Such an outcome could result in gold reversing Thursday’s gain.

XAU/USD Daily Chart

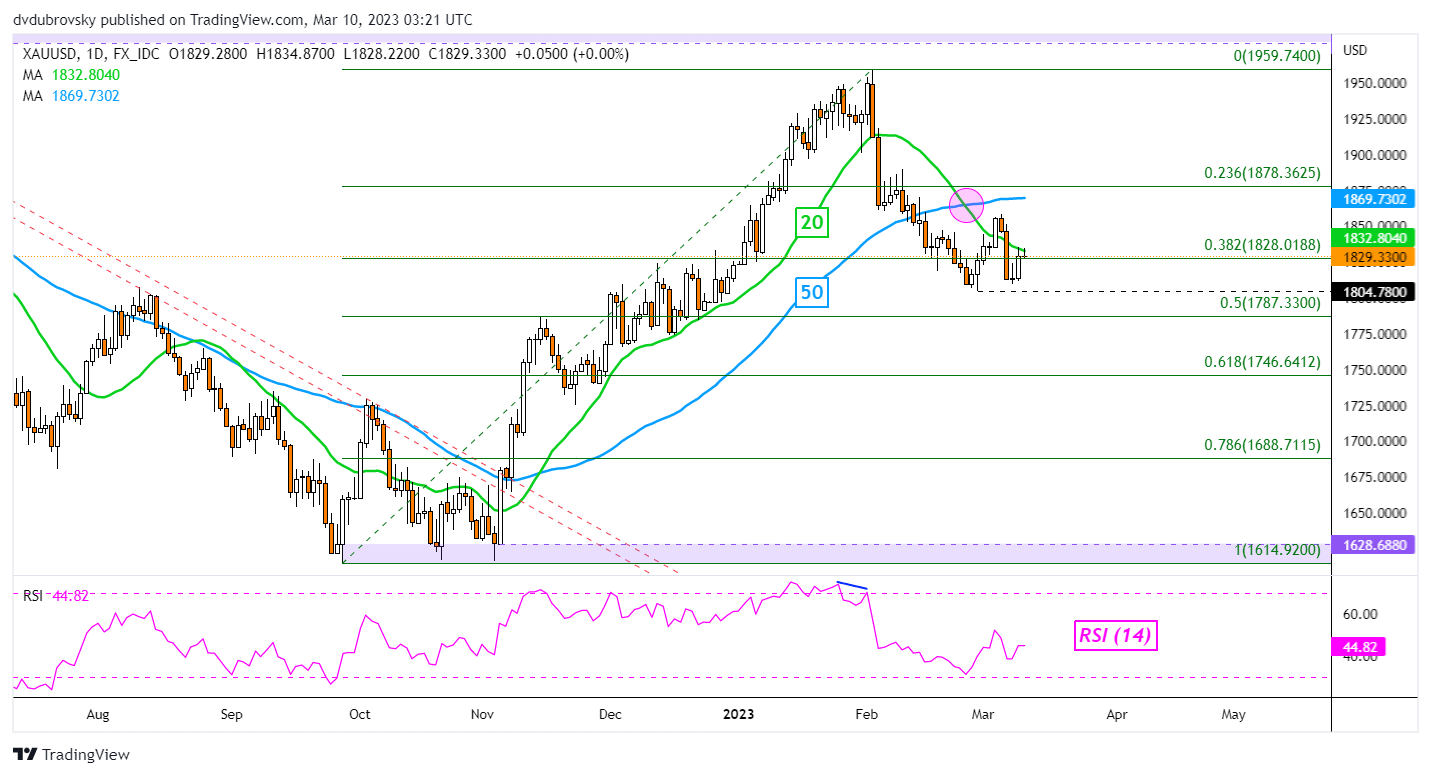
Gold prices turned higher just above the February low at 1804. A bearish Death Cross between the 20- and 50-day Simple Moving Averages remain in play, offering a downside technical bias. If prices continue higher, the 50-day line could hold as resistance. Otherwise, clearing lower exposes the midpoint at 1787.

XAU/USD Daily Chart

The Most Volatile Currency Pairs and How to Trade Them

The Most Volatile Currency Pairs and How to Trade Them

FX markets are susceptible to a range of factors which affect their volatility, and many traders look to tailor their strategies to capitalize on the most volatile currency pairs.

Currency volatility, often measured by calculating the standard deviation or variance of currency price movements, gives traders an idea of how much a currency might move relative to its average over a given time period. Traders can also gauge volatility by looking at a currency pair’s average true range or by looking at range as percent of spot.

The higher the level of currency volatility, the higher the degree of risk, and vice versa. Volatility and risk are usually used as interchangeable terms.Different currency pairs have different levels of volatility on average.

Some traders enjoy the higher potential rewards that come with trading volatile currency pairs. Although, this increased potential reward does present a greater risk, so traders should consider reducing their position sizes when trading highly volatile currency pairs.

What are the most volatile currency pairs?

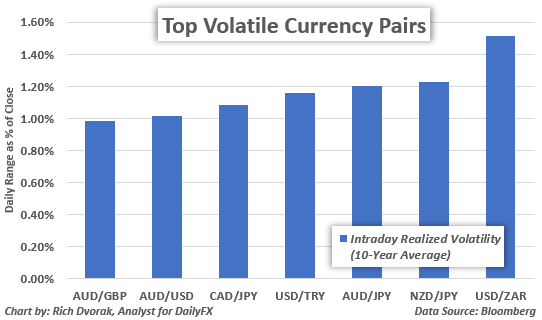
The most volatile major currency pairs are:

Most Volatile Currency Pairs

Other major currency pairs, like EUR/USD, USD/JPY, GBP/USD and USD/CHF, are generally more liquid and less volatile as a result. That said, emerging market currency pairs, such as USD/ZAR, USD/TRY and USD/MXN, can clock some of the highest volatility readings.

MOST VOLATILE CURRENCY PAIRS

Majors – AUD/JPY, NZD/JPY, AUD/USD, CAD/JPY, GBP/AUD

Emerging Markets – USD/ZAR, USD/TRY, USD/MXN

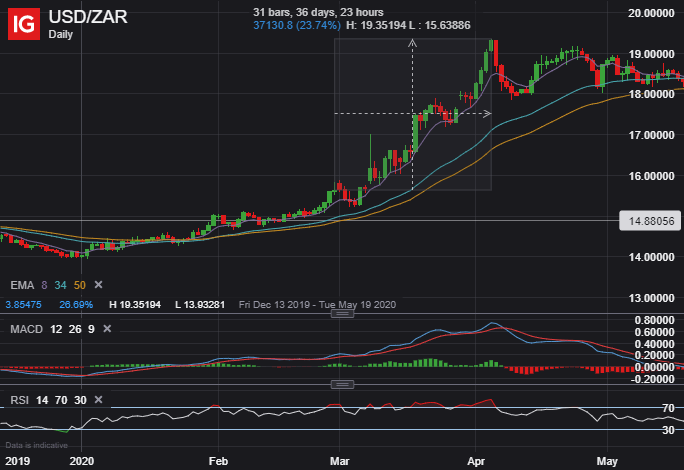
Aside from relatively low liquidity, emerging market currencies tend to be highly volatile in particular due to inherent risk underpinning emerging market economies. The chart below gives an example of how volatile emerging market currencies can be, which shows USD/ZAR (US Dollar/South Africa Rand) exploding nearly 25% higher in just over a month’s time. There are several other examples of emerging market currency pairs swinging drastically like this throughout history.

USDZAR Daily Price Chart

What about the least volatile currency pairs?

The least volatile currency pairs tend to be the major currency pairs which are also the most liquid. Also, these economies tend to be larger and more developed. This attracts more trading volume and facilitates greater price stability in turn. To that end, considering EUR/USD, USD/CHF and EUR/GBP trade with high volumes of liquidity, it comes as little surprise they are among the lease volatile currency pairs.

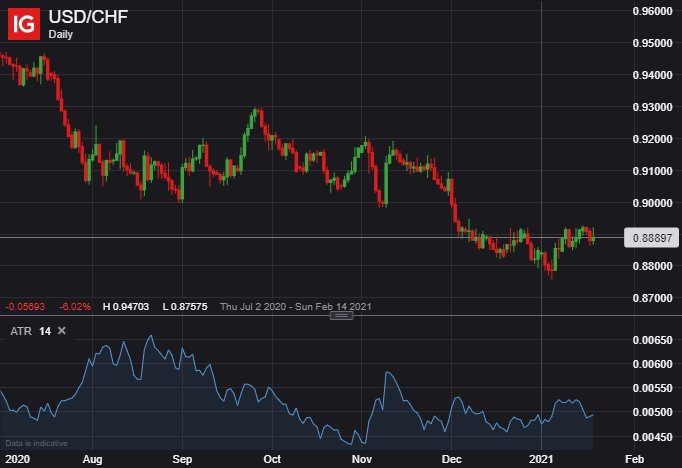
Illustrated below, the average true range (ATR) on USD/CHF ranges between 45-pips and 65-pips, a low average true range compared to other pairs. The average true range of a currency is one of the many ways to measure the volatility of a currency pair. Bollinger Band width is another popular technical indicator used to measure volatility.

USDCHF Daily Price Chart

Correlation between two currencies can also have an impact on their volatility. The more positively two currencies are correlated to one another might lead to less volatility. Continuing with our USD/CHF example, we note that the US Dollar and Swiss Franc are both viewed as safe-haven currencies.

The US Dollar and Swiss Franc tend to strengthen against their sentiment-linked peers when the market experiences episodes of risk aversion, but the two currencies may not deviate much from each other. This contributes to relatively low volatility readings for USD/CHF.

How to trade currency pair volatility

Forex traders should take into account current readings of volatility and potential changes in volatility when trading. Market participants should also consider adjusting their position sizes with respect to how volatile a currency pair is. Trading a volatile currency pair might warrant a reduced position size.

Awareness of volatility can also help traders determine appropriate levels for stop loss and take profit limit orders. Furthermore, it is important to understand the key characteristics separating themost volatile currencies from currencies with low volatility readings. Traders should also know how to measure volatility and have an awareness of events that might create big changes in volatility.

The difference between trading currency pairs with high volatility versus low volatility

  1. Currencies with high volatility will normally move more pips over a certain period than currencies with low volatility. This leads to increased risk when trading currency pairs with high volatility.
  2. Currencies with high volatility are more prone to slippage than currency pairs with low volatility.
  3. Due to high-volatility currency pairs making bigger moves, you should determine the correct position size to take when trading them.

There are several ways to measure volatility

To determine the correct position size, traders need to have an expectation of how volatile a currency can be. A variety of indicators can be used to measure volatility like:

EUR/USD Price Analysis: Support structure stands in the way of a full blown breakout

EUR/USD Price Analysis: Support structure stands in the way of a full blown breakout

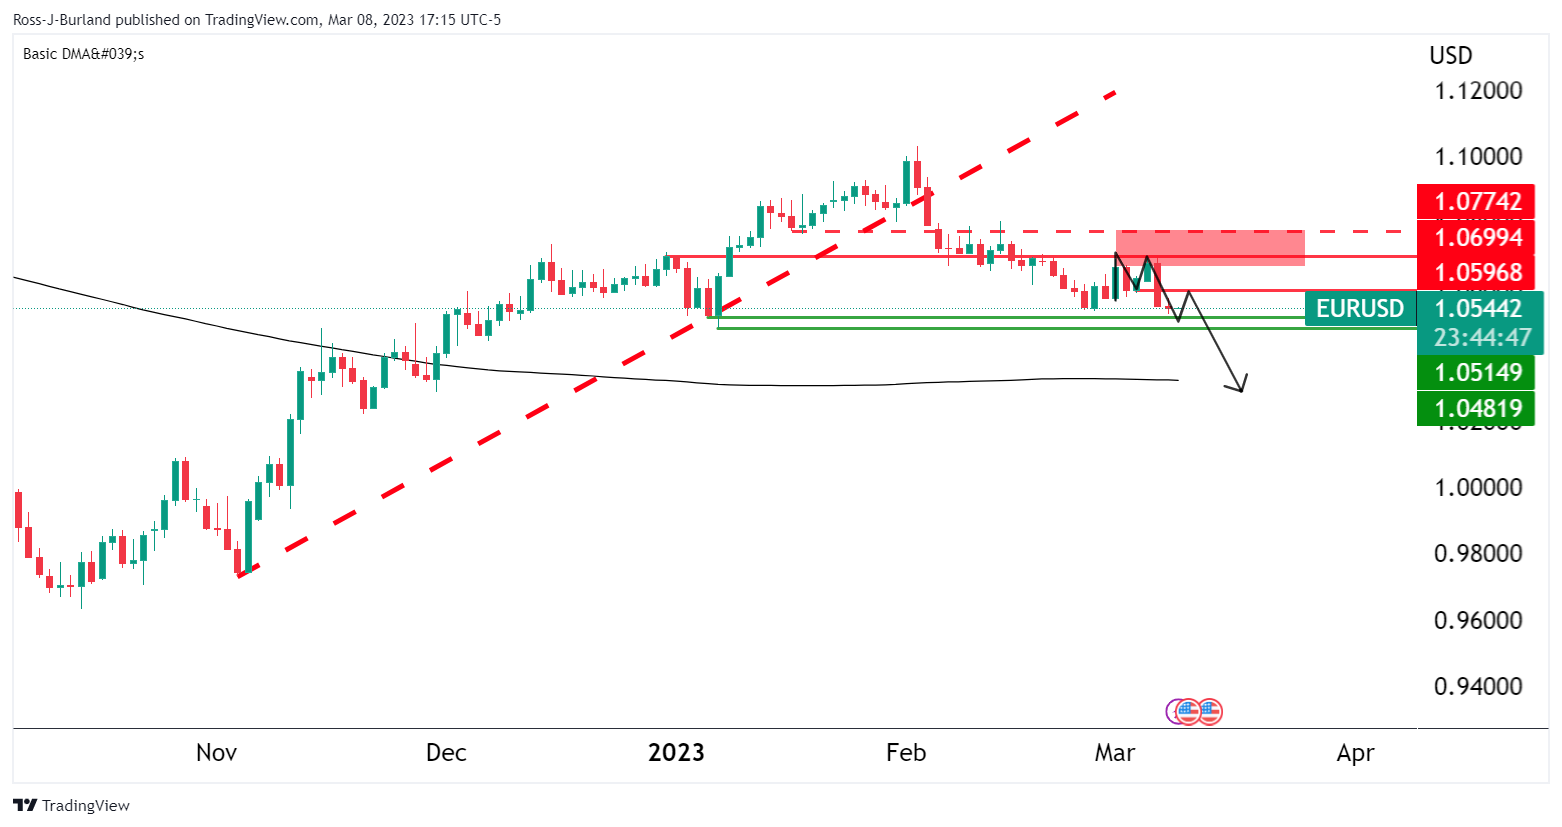
EUR/USD was little changed at 1.0547 but it fell to 1.0524 was trading just above this year’s low of 1.04820 reached on Jan. 6. after Federal Reserve Chairman Jerome Powell offered no major surprises on his second day of testimony before Congress and as investors waited for jobs data on Friday.

The Fed’s decisions will be hinging on data to be issued before the US central bank’s policy meeting in two weeks which makes this week’s US nonfarm Payrolls event key for EUR/USD. The price is rested above key structural support ahead of the event as the following illustrates:

EUR/USD daily charts

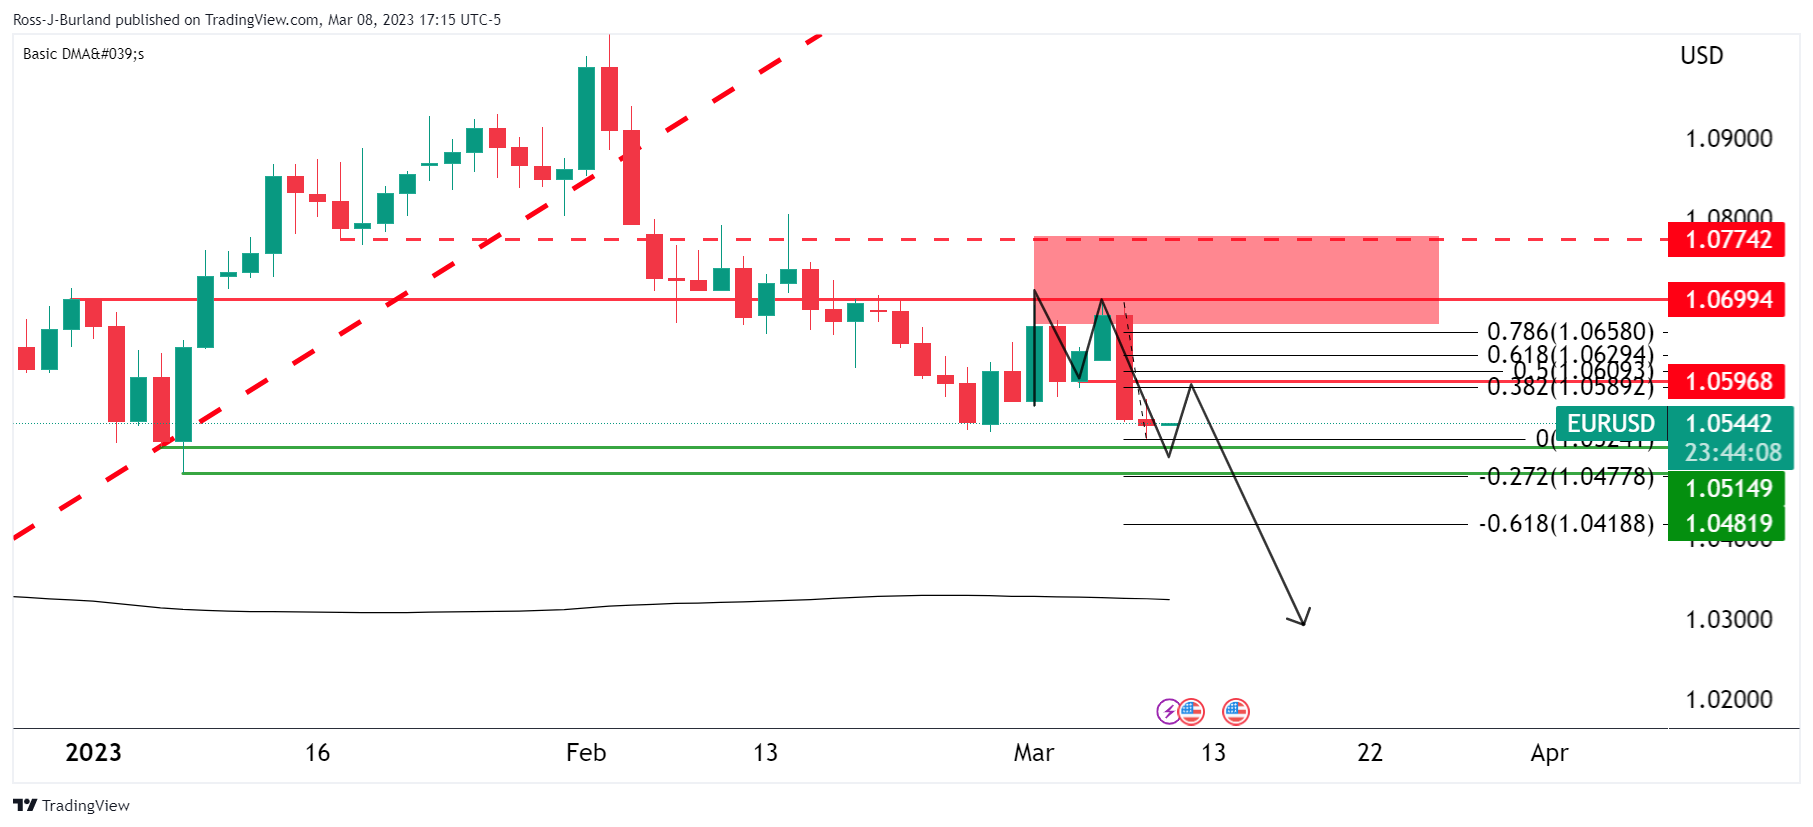
The price has carved out an M-formation which is a pattern that tends to see a retest of the neckline near a 50% mean reversion in this particular case.  1.0520 guards 1.0480 while bulls will need to get above 1.06 to open risk to 1.0700.

GBP/USD Price Forecast: Cable Enjoying a Bounce Ahead of UK GDP and NFP Data Releases

GBP/USD Price Forecast: Cable Enjoying a Bounce Ahead of UK GDP and NFP Data Releases

GBP/USD FUNDAMENTAL BACKDROP

GBPUSD enjoyed a 40-odd pip bounce following the European open before retracing a portion of the move to trade at 1.1875 (at the time of writing). Tuesday’s selloff was followed by consolidation yesterday as markets remain sensitive to high impact data events and central bank commentary.

Markets do seem to lack conviction though as comments by Fed Chair Powell regarding data guiding the Fed decisions seemingly keeping market participants slightly optimistic. However, looking at yesterday’s ADP numbers, it looks like we could be in for another positive NFP print which would then add further credence to a 50bps hike at the upcoming Federal Reserve meeting beginning on 21 March. The dollar index is slightly weaker this morning which is likely to help GBPUSD with a short-term bounce ahead of tomorrow’s NFP report and UK GDP data.

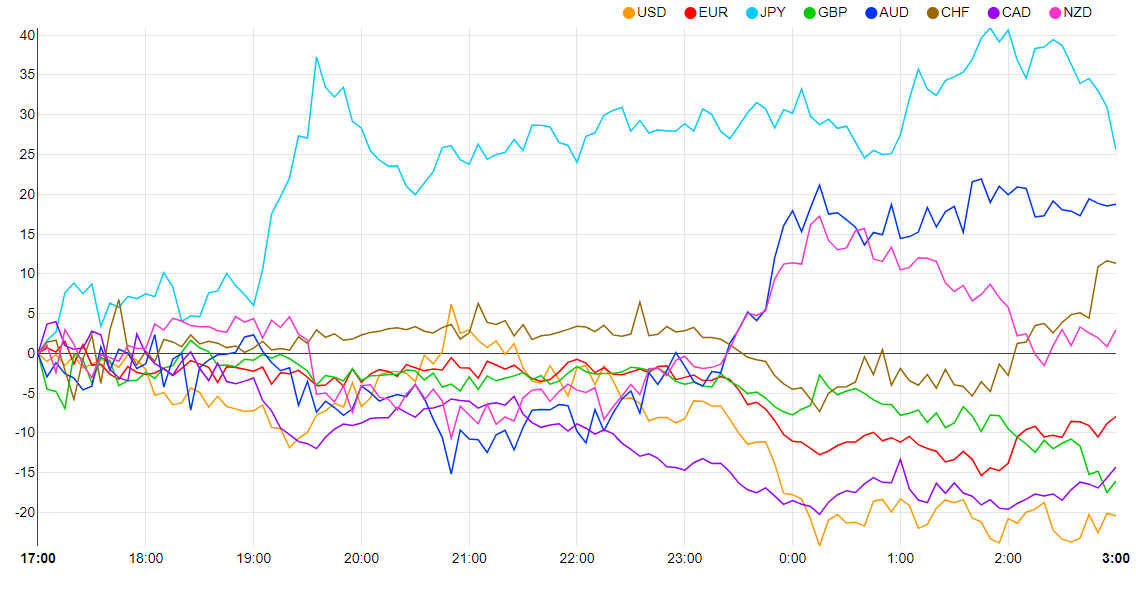
Currency Strength Chart: Strongest – JPY, Weakest – USD.

image1.png

The longer-term outlook for GBPUSD does favor further downside however particularly in light of the differing paths the two Central Banks are likely to adopt moving forward. There is speculation that the Bank of England (BoE) could soon pause its hiking cycle while the Fed looks set to continue hiking rates given Fed Chair Powell’s comments this week.

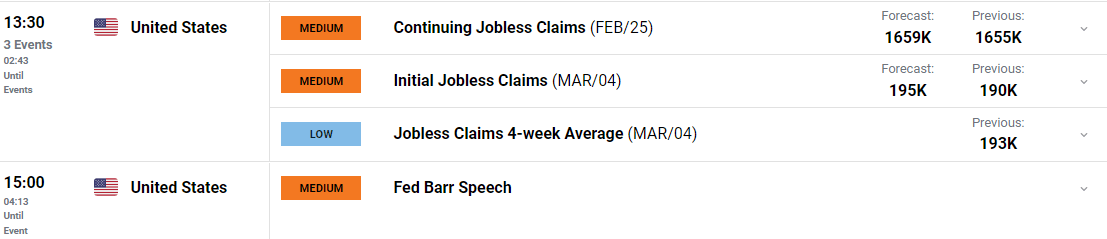
Later today we have initial jobless claims out of the US as well as comments from Fed policymaker Michael Barr as we approach the Feds blackout period. Tomorrow, we have GDP data out of the UK before all focus turns to the NFP report and average hourly earnings which is likely to be key as well given the impact it continues to have on stubborn inflation in the US.

image2.pngimage3.pngimage4.png

TECHNICAL OUTLOOK

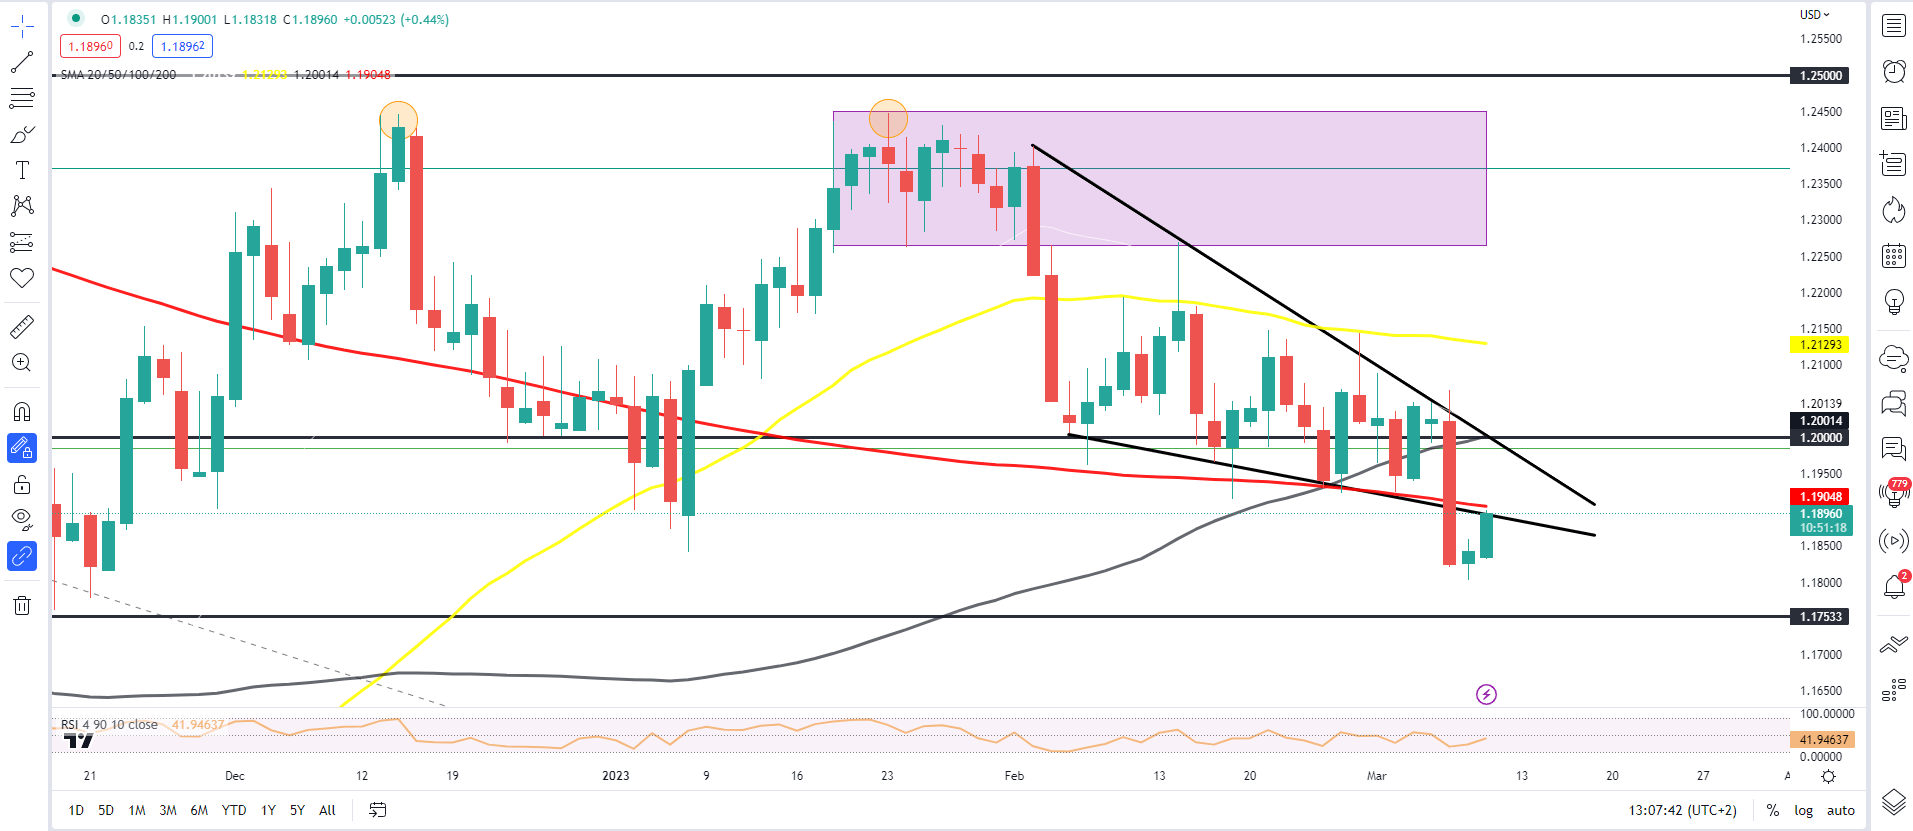
On the daily timeframe we are currently retesting the 200-day MA and the wedge pattern, having broken below both during Tuesday’s selloff. The 1.1900 level is a short-term resistance area and could cap gains, however a move above here could bring a retest of the 1.2000 psychological level which lines up with the 100-day MA.

Alternatively, a rejection of 1.1900 and a push lower brings resistance turned support at 1.1850 and 1.1800 into play with a daily candle close below the 1.1800-handle opening up a retest of 1.1750 and 1.1650 support areas respectively.

GBP/USD Daily Chart – March 9, 2023

image5.png


Euro Dollar Forecast: EUR/USD Turns Cautious as Traders Eye NFP’s

Euro Dollar Forecast: EUR/USD Turns Cautious as Traders Eye NFP’s

EUR/USD has found brief reprieve after Tuesday’s decline that drove the major currency pair back below 1.060. As market participants digest commentary from Fed Chair Powell’s testimony, price action has moved into a tight range, forming around 1.056.

EUR/USD Daily Chart

image1.png

After the semiannual monetary policy report raised the probability of a more aggressive rate hike at the March FOMC meeting, the USD gained, driving EUR/USD lower.

However, at the end of the two-day meeting, the repricing of the hawkish commentary and the lack of a fundamental catalyst helped ease the bearish momentum.

Visit the DailyFX Educational Center to discover how to trade the impact of politics on global markets

While key psychological levels continue to provide support and resistance for the pair, a quiet economic calendar has left prices stagnant.

That being said, tomorrow brings German inflation and US NFP’s into the spotlight, providing an additional catalyst for volatility.

image2.png

As inflation remains a key concern for central banks, February’s US job data could drive prices in either direction.

For the US central bank, a strong job report will likely increase the likelihood of a 50-basis point rate hike, supporting a stronger Dollar. This could drive EUR/USD lower, opening the door for a probable retest of 1.050.

In contrast, a weaker employment report could reignite the possibility for a 25-basis point rate hike, allowing the Euro to recover toward the 1.060 mark.

image3.png