China’s yuan jumps to 2-week high as market sees a less hawkish Fed

China’s yuan jumps to 2-week high as market sees a less hawkish Fed

The greenback slid following mixed US jobs data that showed slower wage growth, while authorities stepped in to cap the fallout from the sudden collapse of Silicon Valley Bank. Investors now expect the Fed to take a less aggressive monetary path.

Goldman Sachs’ analysts said they no longer expected the Fed to deliver a rate hike at its March meeting and there was considerable uncertainty about the path beyond March.

The prospect of the Fed being less hawkish put downward pressure on the dollar.

Prior to market opening, the People’s Bank of China (PBOC) set the yuan’s midpoint rate at 6.9375 per dollar, 280 pips or 0.4% firmer than the previous fix of 6.9655.

In the spot market, the onshore yuan opened at 6.9088 per dollar and at one point strengthened as far as 6.8662, the loftiest level since March 1.

By midday, it was changing hands at 6.8745, 450 pips firmer than the previous late session close.

Imminent pressure for the yuan to weaken past 7 per dollar has ebbed, said Ken Cheung, chief Asian FX strategist at Mizuho Bank.

“Market projections for the scope of Fed’s interest rate hike in March have changed significantly, in addition to broad risk-on sentiment,” Cheung said.

“And China’s monetary policy should remain stable as China kept its central bank governor in his post.”

China’s yuan weakens as slower inflation revives doubt on growth

Cheung added that investors would pay attention to US inflation data due on Tuesday for more clues on the health of the world’s largest economy.

Beijing surprised the market by keeping its central bank governor and finance minister in their posts at the annual session of the rubber-stamp parliament on Sunday, prioritising continuity as economic challenges loomed at home and abroad.

By midday, the global dollar index fell to 103.801 from the previous close of 104.576, while the offshore yuan was trading at 6.8729 per dollar.

The one-year forward value for the offshore yuan traded at 6.7141 per dollar, implying a 2.37% appreciation within 12 months.

EURUSD battles with 50-day SMA

EURUSD battles with 50-day SMA

EURUSD has been in a consolidation mode after breaking below its upward sloping channel pattern. Nevertheless, the pair has realised some gains in the past few daily sessions, with the 50-day simple moving average (SMA) capping its upside.

The momentum indicators currently suggest that bullish forces have gained the upper hand. Specifically, the RSI has crossed above its 50-neutral mark, while the stochastic oscillator is ascending near its 80-overbought zone.

If buying pressures persist, initial resistance could be met at the 1.0800 resistance zone.  Slicing through that region, the bulls could aim for the crucial 1.0937 region, which also provided strong resistance in April 2022. A violation of that territory might set the stage for the 11-month high of 1.1032.

On the flipside, bearish actions could send the price to test the recent support zone of 1.0663. Should that floor collapse, the pair could descend towards the March low of 1.0523 before the spotlight turns to the January bottom of 1.0480. If the pair fails to halt there, the 1.0290 barricade could provide further downside protection.

In brief, EURUSD seems to have the necessary momentum to edge higher and escape its recent rangebound pattern. For that scenario to materialise, the pair should initially pierce through the 50-day SMA.

XM TV


Watch Now


Latest News

Timeline: The Shocking Collapse of Silicon Valley Bank

Timeline: The Shocking Collapse of Silicon Valley Bank

Timeline: The Shocking Collapse of Silicon Valley Bank

Just days ago, Silicon Valley Bank (SVB) was still viewed as a highly-respected player in the tech space, counting thousands of U.S. venture capital-backed startups as its customers.

But fast forward to the end of last week, and SVB was shuttered by regulators after a panic-induced bank run.

So, how exactly did this happen? We dig in below.

Road to a Bank Run

SVB and its customers generally thrived during the low interest rate era, but as rates rose, SVB found itself more exposed to risk than a typical bank. Even so, at the end of 2022, the bank’s balance sheet showed no cause for alarm.
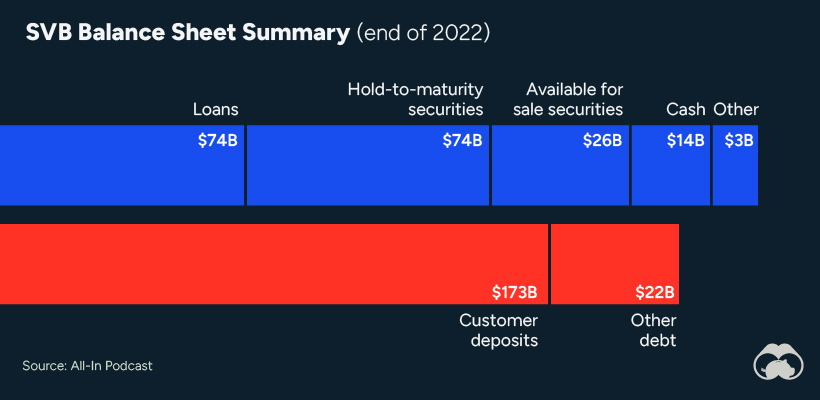
Summary of the SVB balance sheet at the end of 2022

As well, the bank was viewed positively in a number of places. Most Wall Street analyst ratings were overwhelmingly positive on the bank’s stock, and Forbes had just added the bank to its Financial All-Stars list.

Outward signs of trouble emerged on Wednesday, March 8th, when SVB surprised investors with news that the bank needed to raise more than $2 billion to shore up its balance sheet.

The reaction from prominent venture capitalists was not positive, with Coatue Management, Union Square Ventures, and Peter Thiel’s Founders Fund moving to limit exposure to the 40-year-old bank. The influence of these firms is believed to have added fuel to the fire, and a bank run ensued.

Also influencing decision making was the fact that SVB had the highest percentage of uninsured domestic deposits of all big banks. These totaled nearly $152 billion, or about 97% of all deposits.

ℹ️ The Federal Deposit Insurance Corporation (FDIC) insures up to $250,000 per account, per bank, for depositors.

By the end of the day, customers had tried to withdraw $42 billion in deposits.

What Triggered the SVB Collapse?

While the collapse of SVB took place over the course of 44 hours, its roots trace back to the early pandemic years.

In 2021, U.S. venture capital-backed companies raised a record $330 billion—double the amount seen in 2020. At the time, interest rates were at rock-bottom levels to help buoy the economy.

Matt Levine sums up the situation well: “When interest rates are low everywhere, a dollar in 20 years is about as good as a dollar today, so a startup whose business model is “we will lose money for a decade building artificial intelligence, and then rake in lots of money in the far future” sounds pretty good. When interest rates are higher, a dollar today is better than a dollar tomorrow, so investors want cash flows. When interest rates were low for a long time, and suddenly become high, all the money that was rushing to your customers is suddenly cut off.”

Year U.S. Venture Capital Activity Annual % Change
2021 $330B 98%
2020 $167B 15%
2019 $145B 1%
2018 $144B 64%
2017 $88B 6%
2016 $83B -3%

Why is this important? During this time, SVB received billions of dollars from these venture-backed clients. In one year alone, their deposits increased 100%. They took these funds and invested them in longer-term bonds. As a result, this created a dangerous trap as the company expected rates would remain low.

During this time, SVB invested in bonds at the top of the market. As interest rates rose higher and bond prices declined, SVB started taking major losses on their long-term bond holdings.

Losses Fueling a Liquidity Crunch

When SVB reported its fourth quarter results in early 2023, Moody’s Investor Service, a credit rating agency took notice. In early March, it said that SVB was at high risk for a downgrade due to its significant unrealized losses.

In response, SVB looked to sell $2 billion of its investments at a loss to help boost liquidity for its struggling balance sheet. Soon, more hedge funds and venture investors realized SVB could be on thin ice. Depositors withdrew funds in droves, spurring a liquidity squeeze and prompting California regulators and the FDIC to step in and shut down the bank.

What Happens Now?

While much of SVB’s activity was focused on the tech sector, the bank’s shocking collapse has rattled a financial sector that is already on edge.

The four biggest U.S. banks lost a combined $52 billion the day before the SVB collapse. On Friday, other banking stocks saw double-digit drops, including Signature Bank (-23%), First Republic (-15%), and Silvergate Capital (-11%).

Name Stock Price Change, March 10 2023 Unrealized Losses / Tangible Equity
SVB Financial -60%* -99%
First Republic Bank -15% -29%
Zions Bancorp -2% -47%
Comerica -5% -47%
U.S. Bancorp -4% -55%
Fifth Third Bancorp -4% -38%
Bank of America -1% -54%
Wells Fargo 1% -33%
JPMorgan -1% -21%

When the dust settles, it’s hard to predict the ripple effects that will emerge from this dramatic event. For investors, the Secretary of the Treasury Janet Yellen announced confidence in the banking system remaining resilient, noting that regulators have the proper tools in response to the issue.

But others have seen trouble brewing as far back as 2020 (or earlier) when commercial banking assets were skyrocketing and banks were buying bonds when rates were low.

US: Feds try to stop bank crisis of their own making

US: Feds try to stop bank crisis of their own making

US bank regulators on Sunday announced a massive response to last week’s run on Silicon Valley Bank (SVB) and the risk of copycat runs against other regional banks.

The Federal Reserve will provide one-year loans against banks’ security portfolios through a new Bank Term Funding Program, eliminating the risk that banks might be forced to sell their US$4.4 trillion in government securities at a loss.

The Federal Deposit Insurance Corporation (FDIC), meanwhile, will make whole all SVB depositors, as well as those of the Signature Bank of New York, closed by New York state authorities on “systemic risk” grounds.

Federal regulators have slapped a rather large bandage on a gaping wound that they cut into the banking system. By tightening credit to control a wave of inflation that had nothing to do with credit in the first place, the Treasury and Federal Reserve have created a credit problem where none existed before. There are few comparable instances of self-sabotage in the annals of bank regulation.

Although depositors won’t lose money, holders of bank bonds may take substantial losses. That augurs poorly for a recovery in credit markets already stressed by Federal Reserve tightening.

Sunday’s announcement will ease market fears that the run on SVB, which saw $45 billion in deposits leave the bank in little more than a day, might spread to other regional banks. The value of regional banks’ stocks collapsed on March 10 in response to the fear of a general run.

Unlike all previous periods of stress in the US banking system, the quality of bank assets isn’t an issue. During the Covid epidemic banks loaded up on the highest quality assets – bonds issued by the US Treasury and US government agencies – as the government showered $6 trillion in stimulus money on American consumers.

That pushed inflation to the highest level since the late 1970s, and the Federal Reserve responded by raising interest rates, reducing the market value of banks’ bond portfolios.

Graphic: Asia Times

Bank holdings of government debt nearly doubled during 2021 and 2022 to a peak of $4.5 trillion. Bond prices move inversely with interest rates, and the Fed’s interest rate hikes wiped $341 billion off the value of banks’ hold-to-maturity portfolios of $2.6 trillion.

Banks don’t have to book those losses unless they sell their securities. Investors feared that a run against deposits would force banks to sell bonds and recognize those losses. That turned into a positive feedback loop in the case of SVB.

Unlike the 2008 crisis, when dodgy bank mortgage lending and fantastic levels of leverage put the banks into a self-made crisis, last week’s bank tremors were the handiwork of the bungling US government.

By shoveling $6 trillion of consumer spending into an economy hamstrung by supply constraints, the US Treasury unleashed a wave of inflation driven by a huge disconnect between consumer demand and production capacity. That left the banks to hold the Treasury’s bag and finance a large part of the largesse on their balance sheets.

As the above chart makes clear, bank credit to businesses fell during the Covid epidemic. Unlike the great inflation of the 1970s, credit creation played no part in the inflation surge of 2021-2022, as I documented in a report for RealClearPolitics last year.

After spending most of a year denying that inflation was a problem, the Federal Reserve in 2022 responded by tightening credit conditions—which had nothing to do with the inflation surge—by raising its overnight interest rate to 4.75% from just 0.25% in 2021.

Rising rates crushed the value of the Treasury securities that the banks had bought to finance the gargantuan deficits of 2020 and 2021, leaving them unable to sell their government bonds without booking enormous losses. Banks can hold onto their government securities, but have to fund with deposits that cost more than the interest on their securities portfolios.

SVB was especially vulnerable. As Goldman Sachs analysts point out in a March 12 note to clients, almost none of SVB’s deposits qualified for protection from the FDIC, the US bank guarantor. Most regional banks had a 40% to 60% share of guaranteed deposits.

The SVB run dumped the consequences of the government’s serial blunders at the doorstep of the Federal Reserve.

AUD/USD Price Forecast: Australian Dollar Rallies on Fed Repricing

AUD/USD Price Forecast: Australian Dollar Rallies on Fed Repricing

AUSTRALIAN DOLLAR FUNDAMENTAL BACKDROP

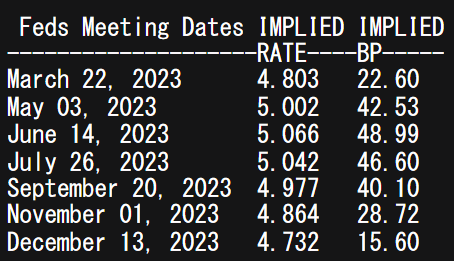
The Australian dollar garnered support this Monday morning after continued concern over the Silicon Valley Bank (SIVB) collapse despite US policy makers (Federal Reserve, US Treasury and the Federal Deposit Insurance Corporation) issuing statements in attempts to quell worries in and around the US banking system. The result was a dovish repricing of Fed interest rates with the 2023 terminal rate for thus cycle now marginally above the 5% mark (see table below) from over 5.6% just last week. Money markets have drastically reduced the potential for a 50bps towards a 25bps increment and possibly none at all – leaving the U.S. dollar on the backfoot!

Tomorrow’s US CPI report will make things interesting should inflation come in higher than expected, making the Fed’s task that much harder.

FEDERAL RESERVE INTEREST RATE PROBABILITIES

image1.png

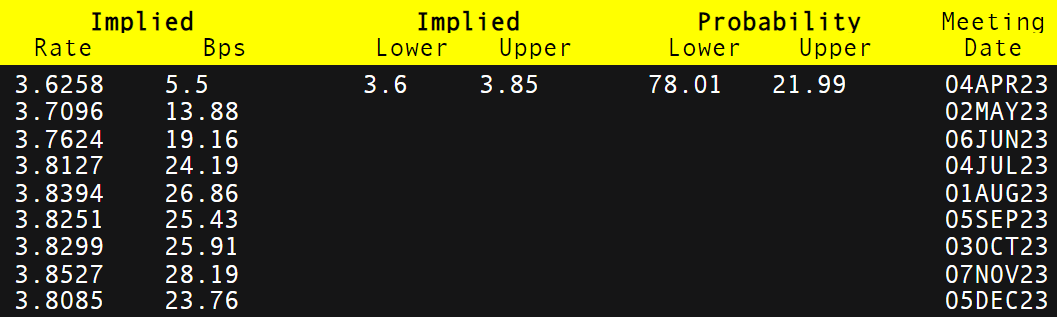
Looking at the RBA’s pricing below, consensus is for the central bank to keep interest rates on hold at 3.6% – still well above the neutral rate.

RESERVE BANK OF AUSTRALIA (RBA) INTEREST RATE PROBABILITIES

image2.png

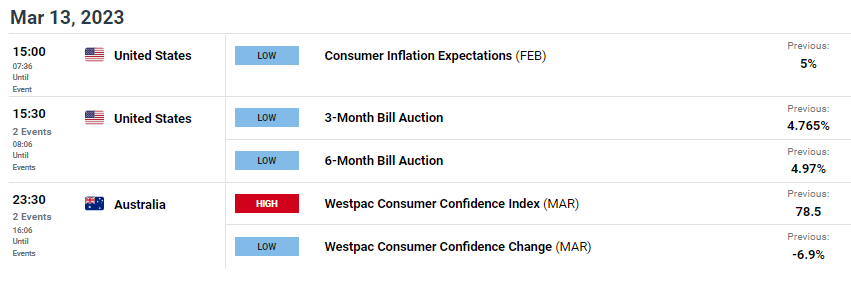
Looking ahead, Australia’s Westpac Consumer Confidence Index for March are scheduled and has been relatively pessimistic (over 100 indicates greater optimism) of recent. This is largely due to China’s re-opening uncertainty but with increased amounts of fiscal stimulus, commodity prices could receive support which is a net positive for the Aussie dollar.

ECONOMIC CALENDAR

image3.png

TECHNICAL ANALYSIS

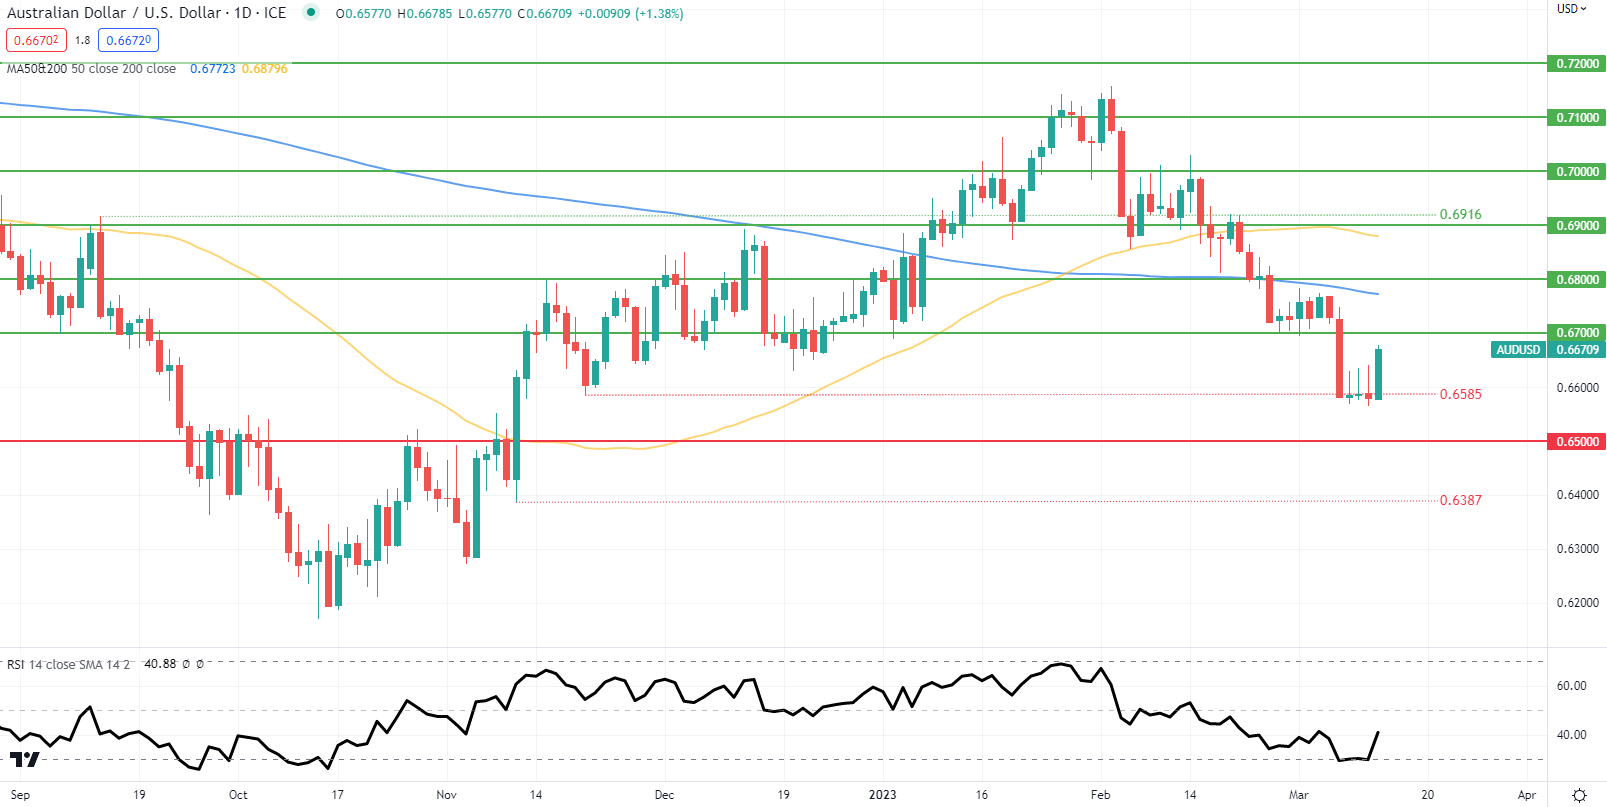
AUD/USD DAILY CHART

image4.png

Chart prepared by Warren Venketas, IG

Daily AUD/USD price action reflects the push higher towards the 0.6700 psychological handle coming off the oversold Relative Strength Index (RSI) reading. Today’s trading should be somewhat cautious and reactive to US banking stocks and any additional comments by US authorities but it is too soon to call for a turnaround ahead of tomorrow’s US inflation.

Key resistance levels:

  • 0.6800
  • 200-day MA (blue)
  • 0.6700

Key support levels:

  • 0.6585
  • 0.6500

IG CLIENT SENTIMENT DATA: MIXED

IGCS shows retail traders are currently LONG on AUD/USD, with 71% of traders currently holding long positions. At DailyFX we typically take a contrarian view to crowd sentiment but due to recent changes in long and short positioning we arrive at a short-term cautious bias.

EUR/USD bulls cheer SVB-led risk-on mood, easing hawkish Fed bets to cross 1.0700, US inflation, ECB eyed

EUR/USD bulls cheer SVB-led risk-on mood, easing hawkish Fed bets to cross 1.0700, US inflation, ECB eyed

EUR/USD rise to the highest levels in three weeks as an upbeat risk profile favors bulls amid early Monday. That said, the Euro pair advances nearly half a percent on a day to 1.0715 as it prints a three-day winning streak at the highest levels in three weeks with eyes on Thursday’s European Central Bank (ECB) monetary policy meeting, as well as Tuesday’s US Consumer Price Index (CPI).

US Treasury Department, Federal Reserve and the Federal Deposit Insurance Corporation (FDIC) took joint actions to tame the risks emanating from the SVB and Signature Bank during the weekend.  “All depositors of Silicon Valley Bank and Signature Bank will be fully protected,” said the authorities in a statement released afterward. While reacting to the US regulators’ actions, US President Joe Biden said, “American people and American businesses can have confidence that their bank deposits will be there when they need them.”

It should be noted that China’s dislike for the US interference in Taiwan matters and the better-than-expected US Nonfarm Payrolls (NFP) seem to probe the risk-on mood ahead of this week’s top-tier data/events.

On Friday, the US Nonfarm Payrolls (NFP) grew more than 205K expected to 311K in February, versus 504K (revised), while the Unemployment Rate rose to 3.6% for the said month compared to 3.4% expected and prior. Further, the Average Hourly Earnings rose on YoY but eased on monthly basis for February whereas the Labor Force Participation increased during the stated month. The data, however, failed to impress the US Dollar buyers as the market’s risk-off mood drowned the US Treasury bond yields and the greenback.

It’s worth observing that the market’s fears of no Fed rate hikes in March, due to the latest imbalance in the US banking sector due to the SVB and Signature Bank fallout, also seem to weigh n the US Dollar.

Amid these plays, S&P 500 Futures bounced off a 2.5-month low, up nearly 1.0% around 3,905 by the press time whereas the US Treasury bond yields recover from the monthly low, after posting the biggest daily loss of the year 2023 on Friday.

Moving on, market plays may witness a sluggish session on Monday amid a cautious mood ahead of top-tier data/events. That said, the ECB is likely to announce a 0.50% rate hike and can join the latest risk-on mood to propel the EUR/USD price. Though, strong prints of the US consumer-centric data and inflation may renew hawkish Fed bias and can exert downside pressure on the major currency pair moving forward.

Technical analysis

The EUR/USD pair’s higher highs on price fail to gain support from the Relative Strength Index (RSI) 14 as it forms a lower high, which in turn suggests a lack of enough bullish momentum to cross the immediate key hurdle, namely the 200-SMA level surrounding 1.0710.

UK government and BOE confirms facilitated sale of SVB UK to HSBC

UK government and BOE confirms facilitated sale of SVB UK to HSBC

n a joint statement from the UK Treasury and the Bank of England (BOE), the UK Finance Minister, Jeremy Hunt, said on Monday that the “deposits will be protected, with no taxpayer support.”

The UK authorities confirmed that HSBC bank agreed to rescue the Silicon Valley Bank’s (SVB) UK arm.

Additional takeaways

“The announcement supersedes statement that intended to mark SVB UK as insolvent.”

“No other UK banks are directly materially affected by these actions.”

EUR/USD stays firmer above 1.0700 amid unabated USD selling

EUR/USD stays firmer above 1.0700 amid unabated USD selling

EUR/USD is holding strong gains above 1.0700 in early Europe. Recovery in risk sentiment weighs on the safe-haven US Dollar amid renewed dovish Fed bets. US regulators’ efforts to tame financial markets risk from SVB, Signature Bank favor risk profile. US CPI next of note.

EUR/USD faces interim resistance at 1.0600 just before 1.0620, where the 50-period Simple Moving Average (SMA) on the four-hour chart is located. With a four-hour close above the latter, the pair could target 1.0660 (broken ascending trend line) and 1.0700 (psychological level, static level).

On the downside, 1.0570 (20-period SMA) acts as dynamic support before 1.0530 (static level) and 1.0500 (psychological level).

EUR/USD has continued to edge higher toward the 1.0600 area in the early European morning on Friday after having registered modest daily gains on Thursday. Although the US Dollar (USD) stays under modest bearish pressure amid retreating US Treasury bond yields, the currency’s performance against its major rivals could be impacted in a significant way on the US February jobs report.

After the data published by the US Department of Labor revealed on Thursday that the weekly Initial Jobless Claims rose by 21K to 211K, the USD struggled to find demand.

Later in the day, the US Bureau of Labor Statistics’ (BLS) monthly report is forecast to show an increase of 205,000 in Nonfarm Payrolls (NFP) in February, following January’s strong 517,000 growth. Earlier in the week, FOMC Chairman Jerome Powell acknowledged that they are prepared to increase the pace of rate hikes but noted that they have not made a decision about the next policy step.

Hence, February labour market data could impact the market pricing of the size of the next Federal Reserve rate hike. According the CME Group FedWatch Tool, the probability of a 50 basis points (bps) Fed rate increase at the next policy meeting stands at 53%.

With a positive NFP print, at or above 250K, hawkish Fed bets are likely to return and provide a boost to the US Dollar. On the flip side, a weak NFP reading below 100K should cause markets to lean toward a 25 bps rate hike in March and hurt the USD. In that scenario, EUR/USD is likely to gather bullish momentum heading into the weekend.

In case the headline NFP arrives near market consensus, at around 200K, wage inflation could drive the market action. On a yearly basis, Average Hourly Earnings are forecast to rise to 4.7% from 4.4% in February. A hotter-than-anticipated wage inflation figure is likely to help the USD gather strength against its rivals and vice versa.

Natural Gas Technical Outlook: Prices Reverse 20% as Broader Bearish Bias Holds

Natural Gas Technical Outlook: Prices Reverse 20% as Broader Bearish Bias Holds

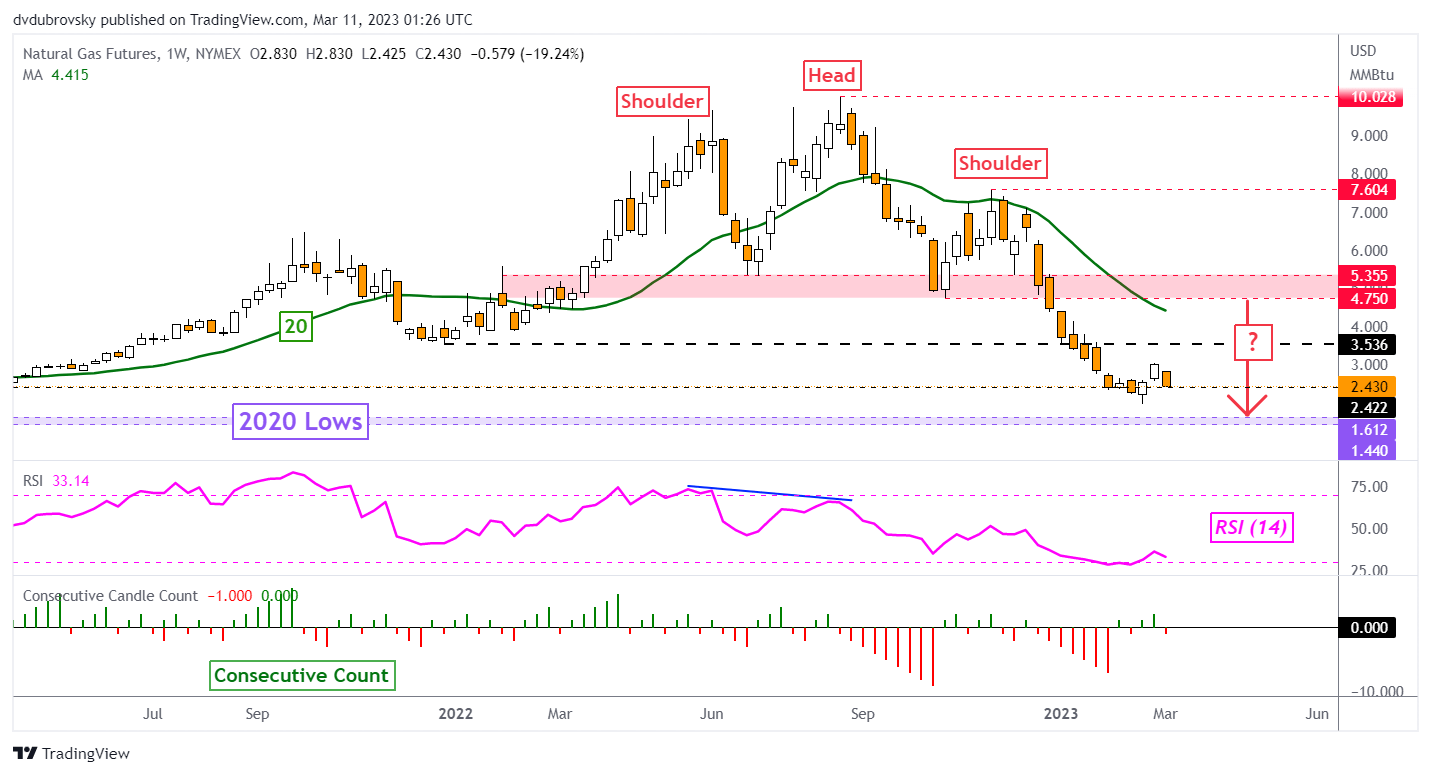
Natural gas prices sank almost 20% last week, marking the worst 5-day period since December. This followed a couple of weeks of upside price action that was quickly reversed. Having said that, the commodity needs to make further downside progress to technically argue that prices are readying to extend the dominant downtrend. The breakout under a bearish Head & Shoulders chart formation at the end of 2022 remains in play. Down the road, that could guide prices down to lows from 2020, making for a key range of support between 1.44 and 1.612.

Weekly Chart – Worst 5-Day Performance Since December

Daily Chart – Prices Aiming for a Retest of the February Low?

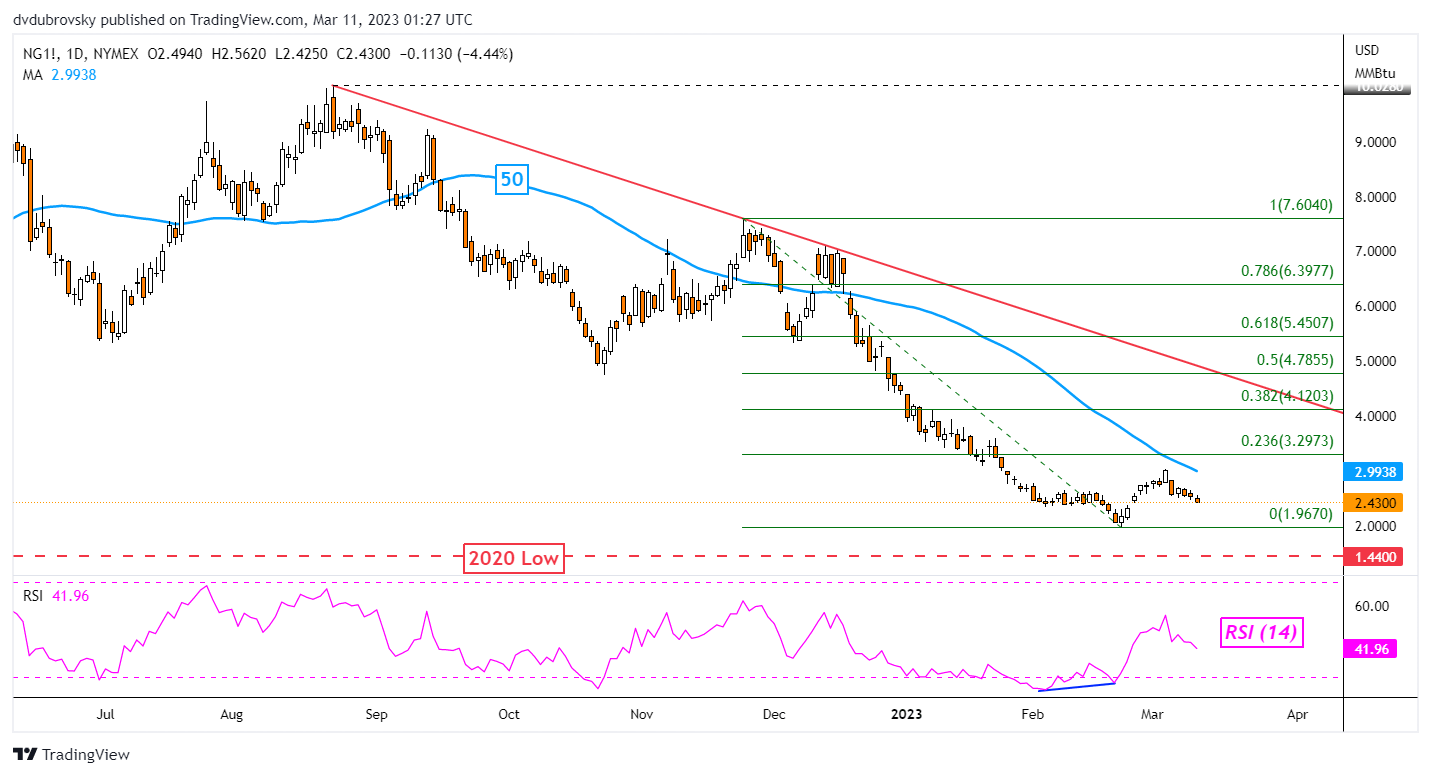
Taking a look at the daily chart, natural gas closed at the lowest since February 23 at the end of last week. Prices were unable to test the 50-day Simple Moving Average (SMA), which continues to offer a downside technical bias and key resistance point. Now, prices are facing the February low at 1.967. Around this price is a key area of support that has been in play since last month. As such, the near-term view seems to be neutral. Clearing support would open the door to extending the dominant downtrend. Otherwise, turning higher places the focus on the 23.6% Fibonacci retracement level at 3.2973.

Daily Chart – Prices Aiming for a Retest of the February Low?

4-Hour Chart – Falling Wedge in Focus

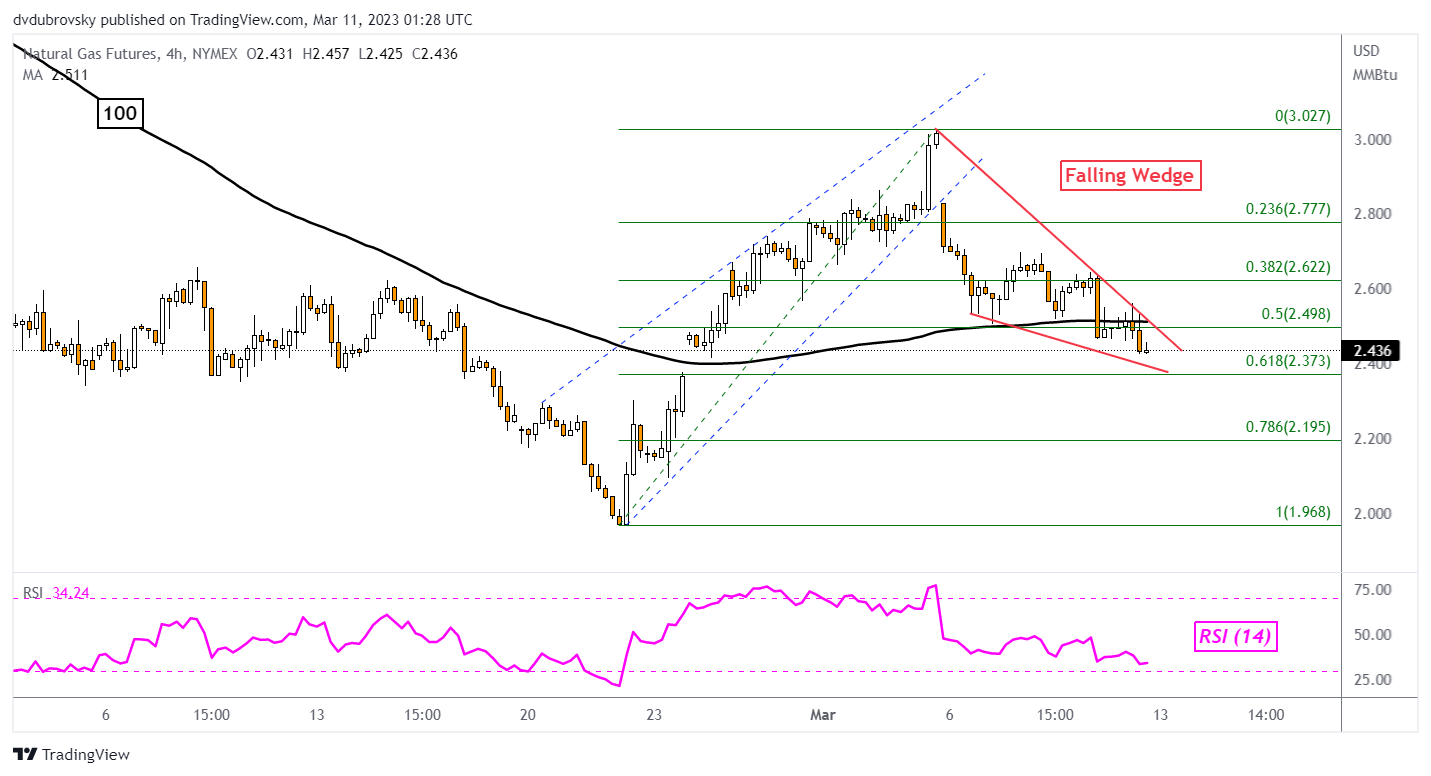
Zooming in further on the 4-hour chart can give us a better picture of what we could expect specifically in the week ahead. A breakout under a bearish Rising Wedge from early March remains in play, offering a very short-term downward bias. But, there is a caveat.

Since the beginning of this month, a bullish Falling Wedge chart formation has been brewing. It seems that very soon, we will see a breakout occur. An upside push through the ceiling could open the door to a turn higher toward the early March high at 3.027. But, keep a close eye on the 100-period SMA. Prices confirmed a breakout under the latter, opening the door to downtrend resumption.

4-Hour Chart – Falling Wedge in Focus


US Dollar Slides as SVB Repercussions Stalled by the Fed and the Treasury Department

US Dollar Slides as SVB Repercussions Stalled by the Fed and the Treasury Department

The US Dollar is under the pump to start the week as uncertainty from the fallout of the collapse of Silicon Valley Bank (SVB) permeates markets.

Signature Bank also fell into receivership over the weekend, but the Federal Reserve and the US Treasury Department have moved swiftly to provide a backstop to minimise contagion.

Nonetheless, everything from credit default swaps to Asian tech companies to Argentinian bonds is facing scrutiny today.

While the greenback is under pressure, Wall Street futures are notching up gains as the market appears to be comfortable at this stage with the steps that authorities have taken so far.

Most notably, authorities have reassured depositors at these banks that they will be able to withdraw their money and that the Federal Reserve will provide liquidity for eligible financial firms.

The Federal Reserve announced that “it will make available additional funding to eligible depository institutions to help assure banks can meet the needs of all their depositors.”

Furthermore, they said, “additional funding will be made available through the creation of a new Bank Term Funding Program (BTFP), offering loans of up to one year in length to banks, savings associations, credit unions, and other eligible depository institutions pledging U.S. Treasuries, agency debt and mortgage-backed securities, and other qualifying assets as collateral.”

Authorities have made it clear that any government assistance will be going to depositors and will not be used to bail out bond or equity investors.

The Treasury Department has recognised that other banks are in a similar position as SVB and Signature Bank, but they have said that it is a very different situation to 2008.

US President Joe Biden will be speaking on Monday morning US time on the SVB situation, and his administration will be briefing Congress.

This episode has disrupted the outlook for rates going forward ahead of next week’s Federal Open Market Committee (FOMC) meeting on the 22nd of March. The market had previously been leaning toward a 50 basis point hike but now sees 25 bp as more likely.

To complicate matters, the Fed has gone into a blackout period, meaning that board members will not be making any public comments until after the meeting.

Expectations of the terminal rate of the Fed funds target rate have been lowered from near 5.70% last week to around 5.13% today. The 2s 10s yield curve is inverted by only -75 bp, more than 30 bp tighter than last Wednesday.

The strong US jobs numbers on Friday paled against the small banking crisis and US CPI on Tuesday may not have the impact on the FOMC meeting that it previously would have.

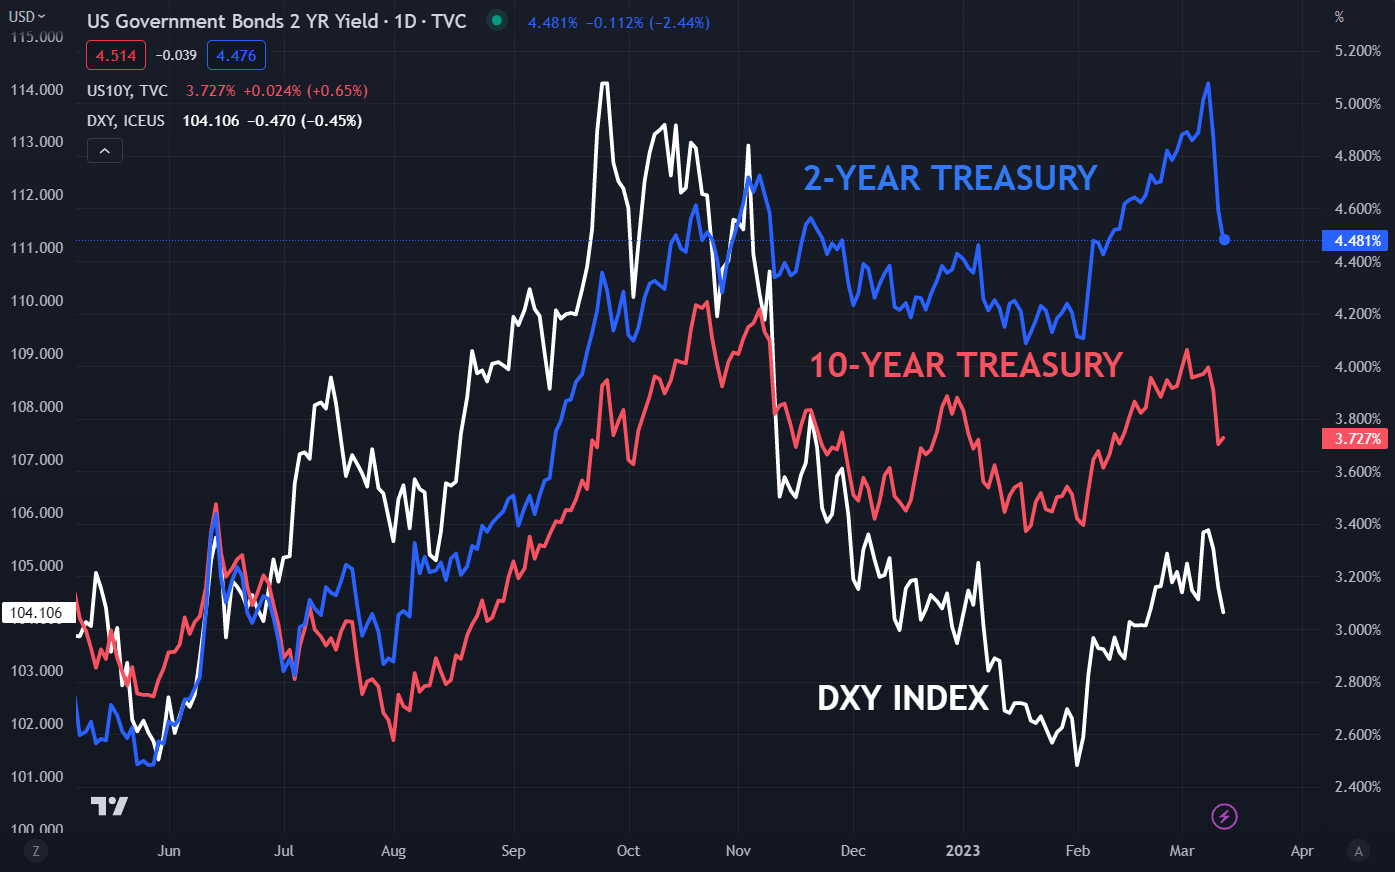
Treasury yields have collapsed and if they continue to trade lower, The US Dollar might be further undermined. The 2-year note is now around 70 bp lower than the peak of 5.08% last week, which was the highest yield since July 2007.

Conversely, if the authorities are successful in corralling contagion risks, Treasury yields might find support.

DXY (USD) INDEX AGAINST TREASURY 2- AND 10-YEAR YIELDS

image1.png

Chart Created in TradingView