Japanese Yen May Weaken if US Banking Sector Volatility Continues Calming

Japanese Yen May Weaken if US Banking Sector Volatility Continues Calming

Asia-Pacific Market Briefing – Markets Calm After a Volatile Monday

The Japanese Yen underperformed against its major counterparts on Tuesday. This was a day when global market volatility cautiously cooled following a relief rally in banking stocks amid elevated uncertainty in the wake of last week’s collapse of Silicone Valley Bank. On Wall Street, the S&P 500 and tech-heavy Nasdaq Composite rallied 1.68% and 2.14%, respectively.

This is as the VIX market ‘fear gauge’ sharply reversed lower, dropping 10.45% and hinting that the worst of the turmoil might have passed. There was a sharp push higher in front-end Treasury yields as traders started to price out anticipated rate cuts later this year because of SVB’s collapse. In fact, over the past 24 hours, about 30 basis points in tightening wre added back into the outlook for the six-month horizon.

This is where the Japanese Yen comes in and why it underperformed. For starters, JPY is often seen as an anti-risk currency, sometimes behaving similarly to the US Dollar in times of market uncertainty. The revival in risk appetite weighed on the currency. Then there is the effect of rising Treasury yields given the still-dovish Bank of Japan. A relatively more hawkish Fed would sap the appeal of JPY versus USD.

Speaking of that front, February’s US inflation report crossed the wires. While the headline gauge clocked in as expected, the Core reading surprised higher on the month-to-month setting. This suggests that underlying inflation remains sticky, putting the Fed in a tough spot.

Looking at Wednesday’s Asia-Pacific trading session, notable economic event risk will stem from China. These include local industrial production and retail sales data. Outside of that, if markets continue to calm in the hours ahead, traders may continue adding back Fed rate hike expectations. That could be a recipe that allows USD/JPY to continue higher.

Japanese Yen Technical Analysis

On the daily chart, USD/JPY was unable to fall under the 50-day Simple Moving Average (SMA), reinforcing the line as key support. A bullish Golden Cross remains in play between the 20- and 50-day lines. Prices are also sitting on the 23.6% Fibonacci retracement level at 133.05. A turn higher would place the focus on highs from early March. Otherwise, extending lower exposes February lows.

{{NEWSLETTER}}

USD/JPY Daily Chart
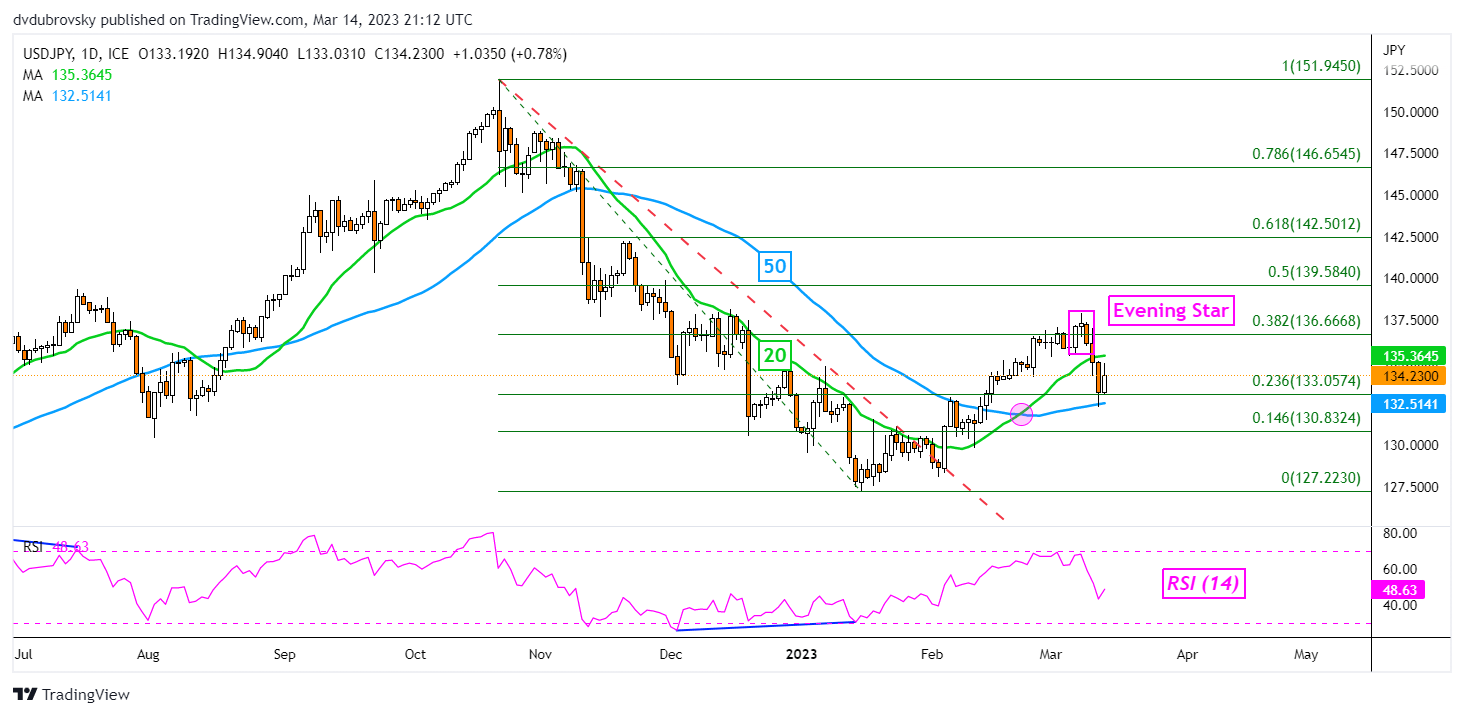
image1.png


Crude Oil Price Slumps Post CPI As Volatility Lifts Ahead of the Fed. Lower WTI?

Crude Oil Price Slumps Post CPI As Volatility Lifts Ahead of the Fed. Lower WTI?

Crude oil sunk to a 3-month low overnight after headline US inflation hit forecasts, coming in at 6.0% year-on-year and 0.4% month-on-month. Monthly core CPI was a slight beat at 0.5% instead of the 0.4% anticipated but the annual number was in line at 5.5%.

The market appears to have backtracked toward a 25 basis point (bp) hike from the Federal Reserve next week after pondering a pause in the aftermath of the failure of Silvergate Corp., SVB Financial and Signature Bank over the last few days.

With the Fed now viewed as hawkish again, recession fears seem to be lingering with the tightening cycle yet to play out.

Having said that, the terminal rate is now being priced by interest rate markets almost 100 bp lower than where it was at this time last week. Next week’s Federal Open Market Committee (FOMC) meeting might provide more guidance on the veracity of the market outlook for the Fed’s rate path.

Adding to bearish sentiment, crude oil inventories rose 1.155 million barrels to the end of last week in the US according to reports from the American Petroleum Institute (API). At the same time, gasoline inventories fell by 4.6 million barrels

That data may support the current level of the crack spread between the WTI crude and RBOB gasoline futures contracts. The crack spread bifurcates the difference in price between WTI crude oil and refined RBOB gasoline.

It shows the refined product remaining elevated relative to the crude product. This might eventually be supportive of WTI.

Conversely, the move down has seen overall volatility tick higher and may suggest the oil market is looking to cover exposure in the move. The OVX index measures the volatility of oil in a similar way that the VIX index measures the implied volatility on the S&P 500.

Separately, the May 2023 25-delta risk-reversal moved further in favour of puts overnight as it moved toward -6.7 from around -3.0 where it had been trading for the last few weeks.

The risk reversal is the price of a call option in volatility terms less the price of a put option in volatility terms for the same date and delta. This could suggest that more ‘insurance’ is being taken out for downside protection rather than on the upside.

The front two WTI futures contracts reveal a slight bias toward contango, which at the margin might allow for some softening in price.

While the macro environment might be stabilising after the shock collapse of the three banks, the oil market will be watching the official US Energy Information Agency (EIA) inventory data that is due later today.

WTI CRUDE OIL, CRACK SPREAD, BACKWARDATION/CONTANGO, VOLATILITY (OVX)

image1.png


Gold and Silver Outlook: SVB Collapse Pushes Retail Traders to Boost Downside Bets

Gold and Silver Outlook: SVB Collapse Pushes Retail Traders to Boost Downside Bets

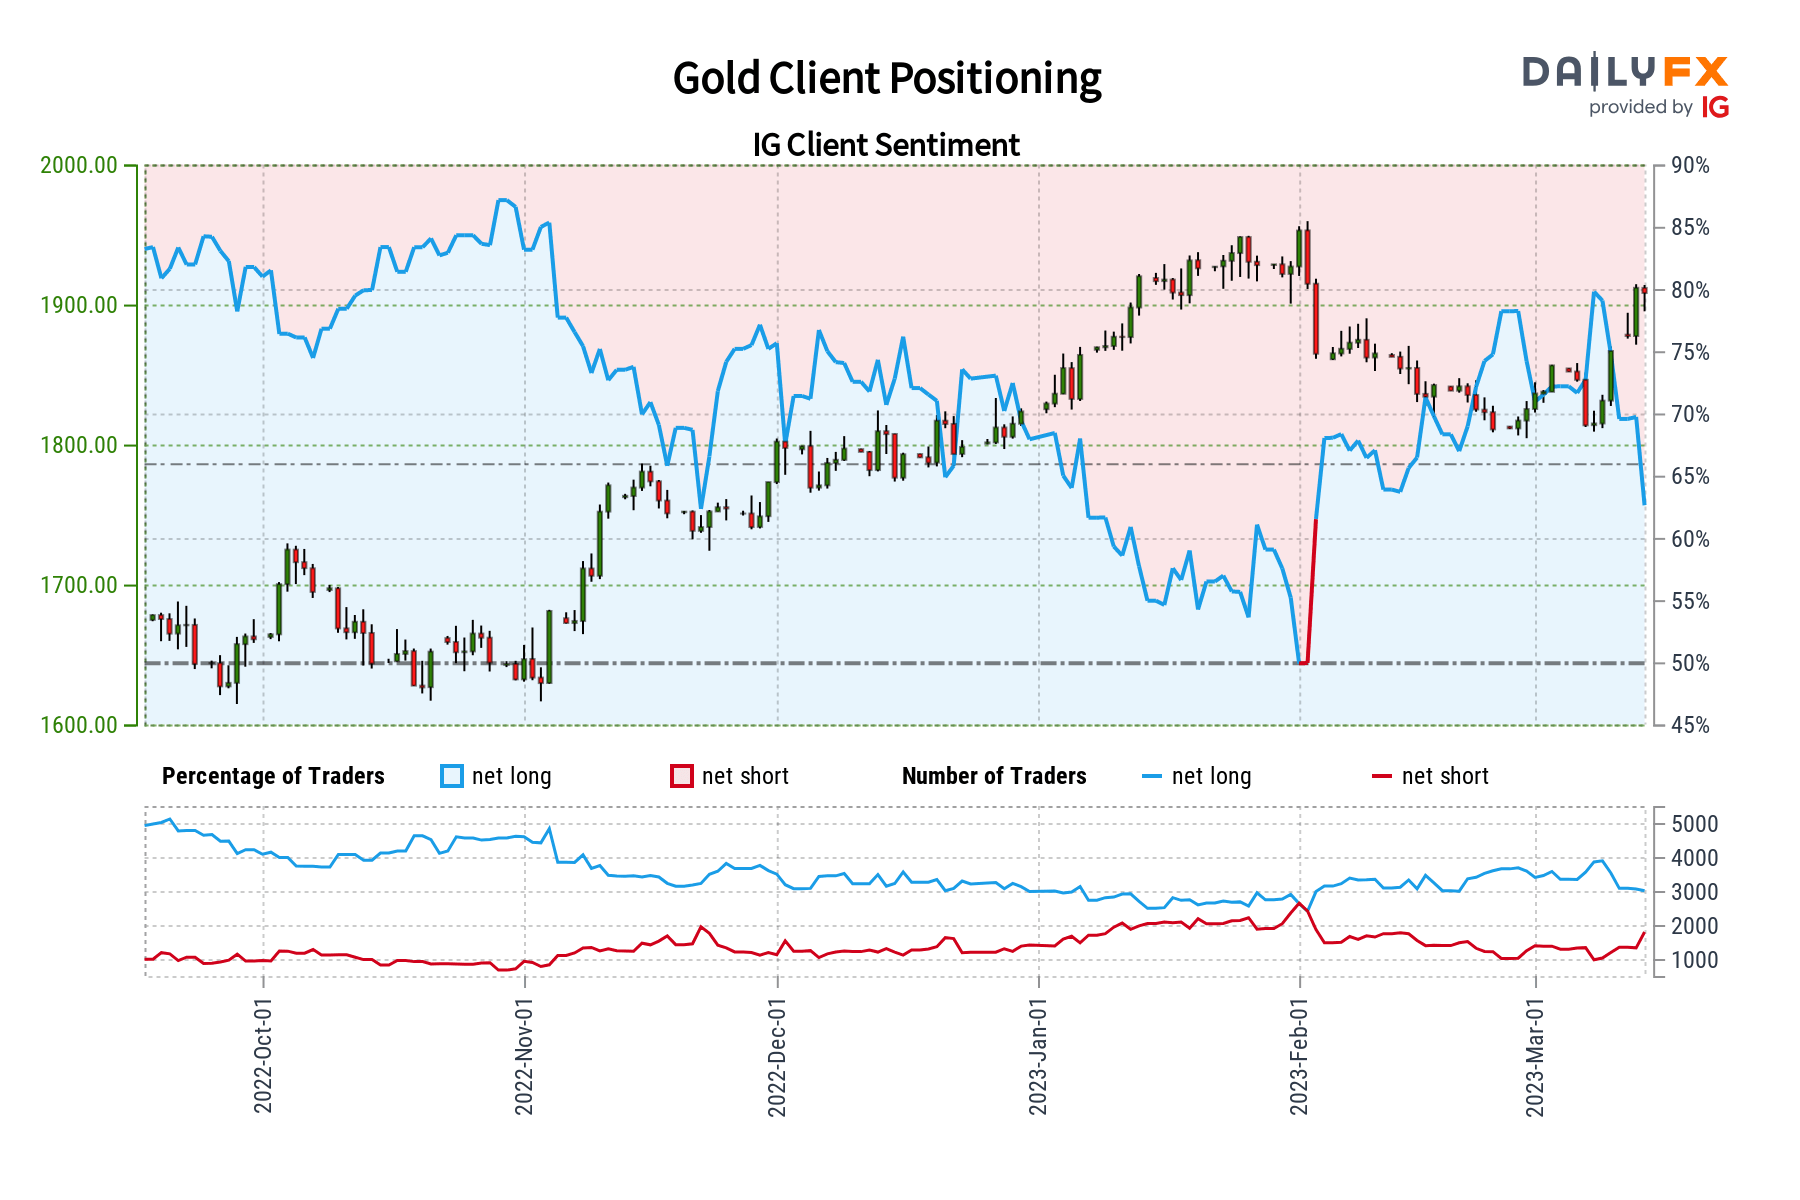
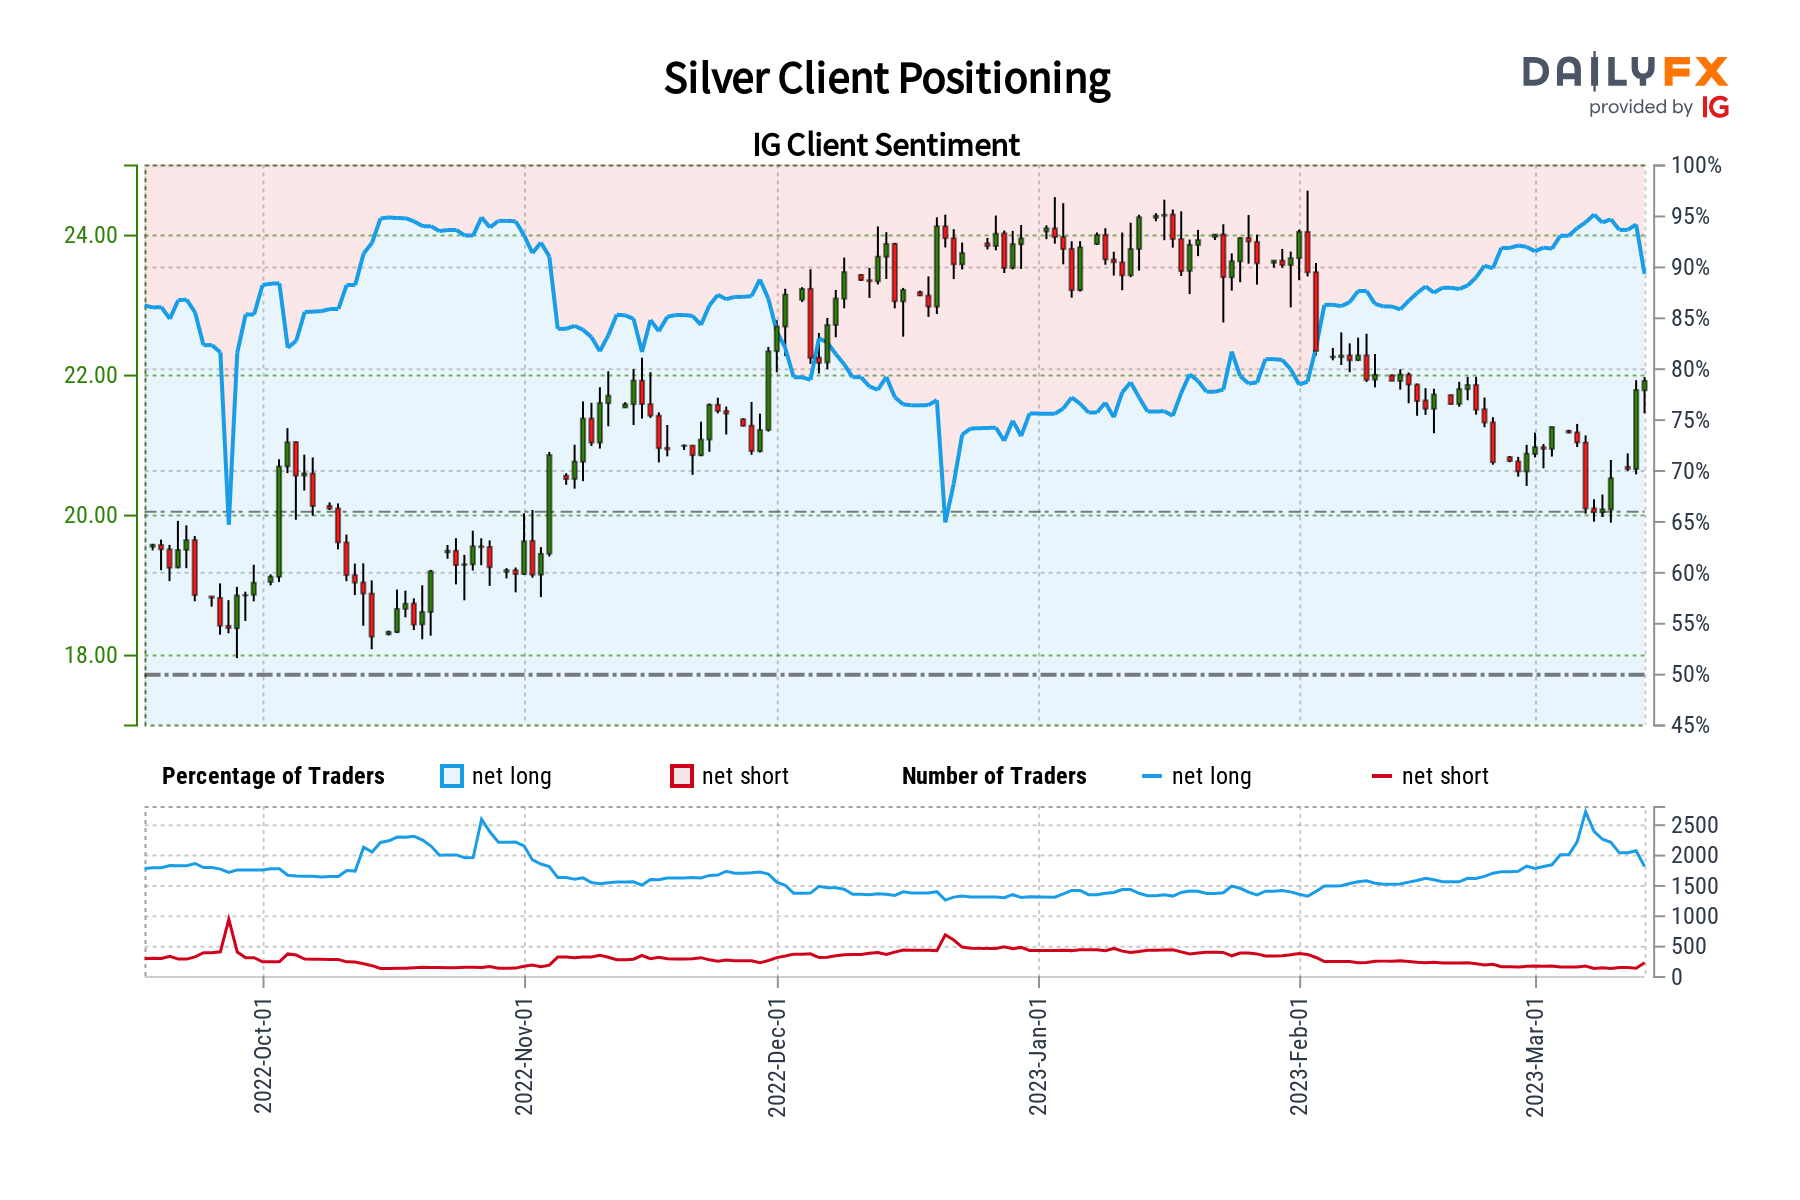
In the wake of last week’s collapse of Silicon Valley Bank, gold and silver prices have soared as Treasury yields declined. Retail traders have responded by increasing downside bets in XAU/USD and XAG/USD. This can be seen by looking at IG Client Sentiment (IGCS). IGCS tends to function as a contrarian indicator. With that in mind, if retail traders continue boosting bearish bets, could gold and silver see further upside?

Gold Sentiment Outlook – Bullish

The IGCS gauge shows that about 60% of retail traders are net-long gold. Since most of them are net-long, this hints prices may continue falling. But, downside exposure has increased by 7.85% and 92% compared to yesterday and last week, respectively. With that in mind, recent shifts in positioning hint that the price trend may soon reverse higher.

Gold Sentiment Outlook - Bullish

XAU/USD Daily Chart

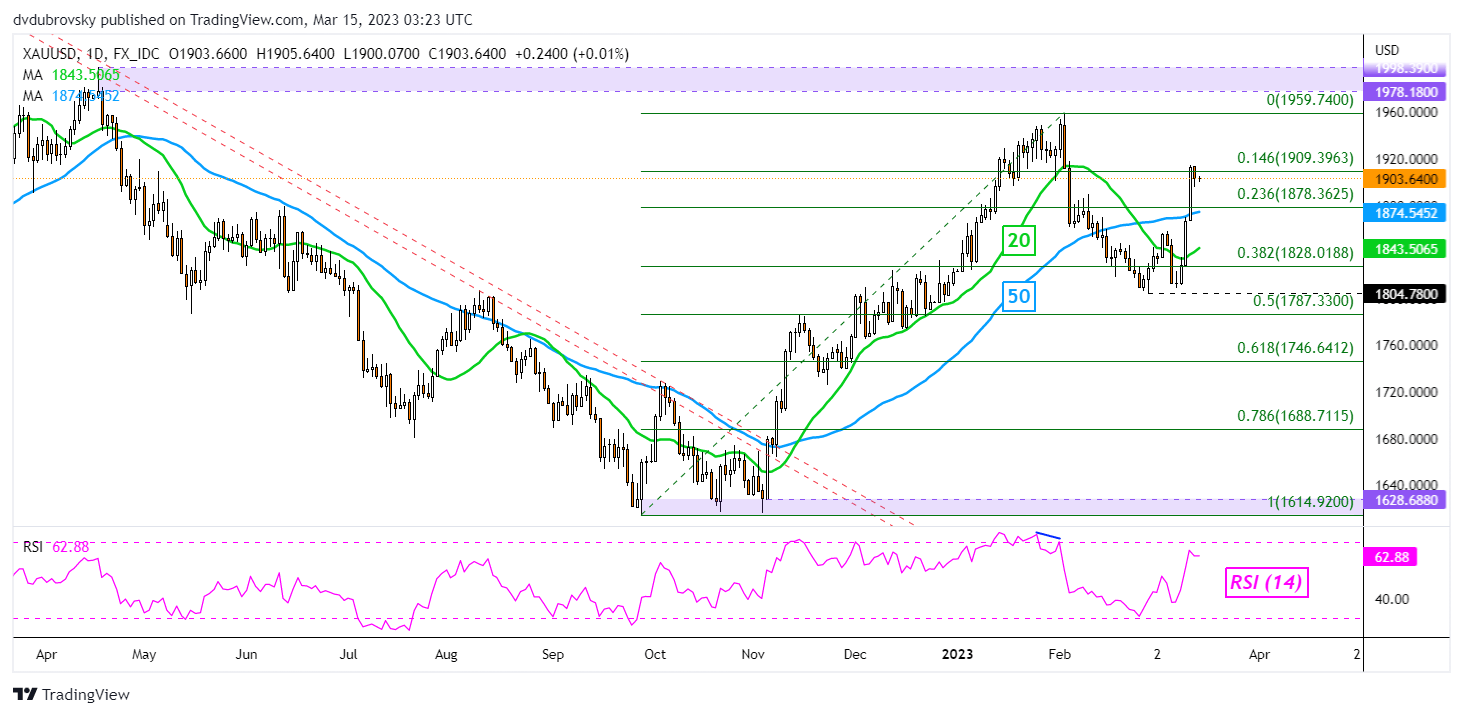
On the daily chart, gold confirmed a breakout above the 50-day Simple Moving Average (SMA) as well as the 20-day equivalent. This is offering an increasingly neutral setting. There is now the potential for a bullish Golden Cross to form in the days ahead. Immediate resistance seems to be the minor 14.6% Fibonacci retracement level at 1909. Confirming a breakout above that price exposes the February peak at 1959.74. Pushing under 1804 could reinstate a more bearish bias.

XAU/USD Daily Chart

Silver Sentiment Outlook – Bullish

The IGCS gauge reveals that about 88% of retail traders are net-long silver. Since most of them are still biased higher, this hints prices may continue falling. But, downside exposure has increased by 2.71% and 62.14% compared to yesterday and last week, respectively. With that in mind, recent shifts in exposure hint that the price trend may soon reverse higher.

Silver Sentiment Outlook - Bullish

XAG/USD Daily Chart

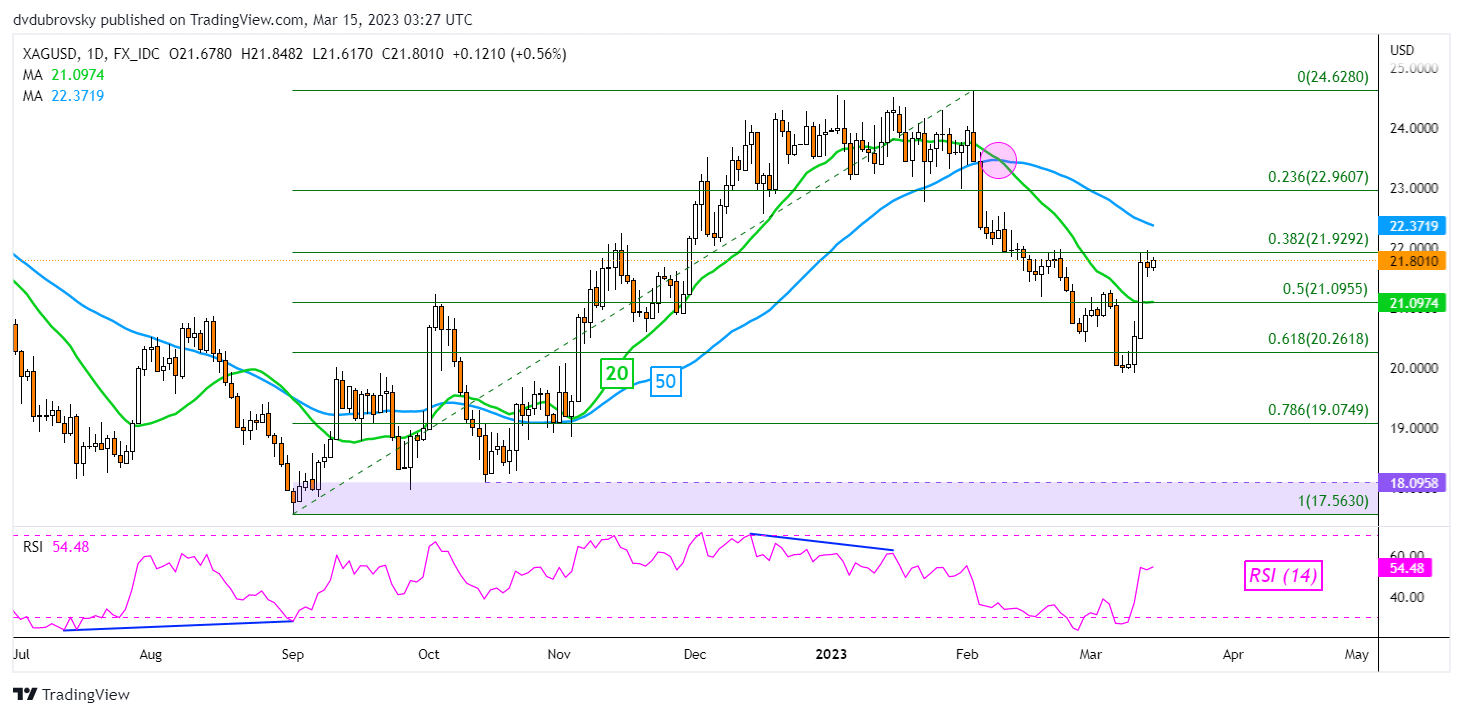
Unlike gold, silver prices have only confirmed a breakout above the 20-day SMA, with the 50-day line still standing above. As well as that line, another key point of immediate resistance is the 38.2% Fibonacci retracement level at 21.92. Confirming a breakout above these 2 points could offer an increasingly near-term bullish trajectory, placing the focus on January peaks. Otherwise, downtrend resumption entails pushing under the early March low.

image4.png


Euro Poised Amidst Market Turmoil Ahead of CPI Data and ECB. Higher EUR/USD?

Euro Poised Amidst Market Turmoil Ahead of CPI Data and ECB. Higher EUR/USD?

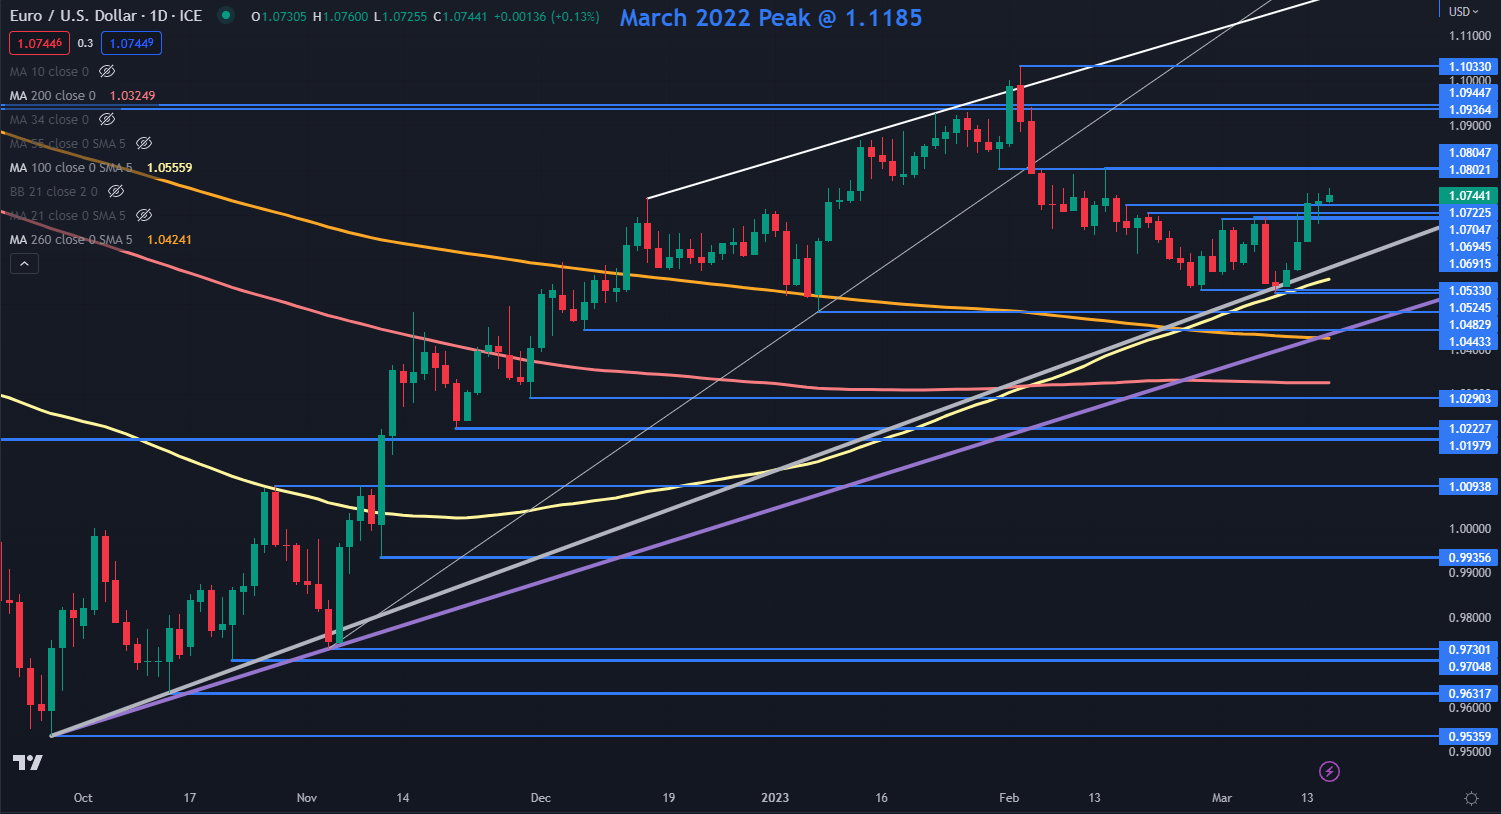
The Euro has continued to climb today as the market digests the broader implications of the failure of 3 US banks and their subsequent rescue by authorities. Despite this, the US Dollar remains under pressure and EUR/USD is pushing toward a 4-week high above 1.0750.

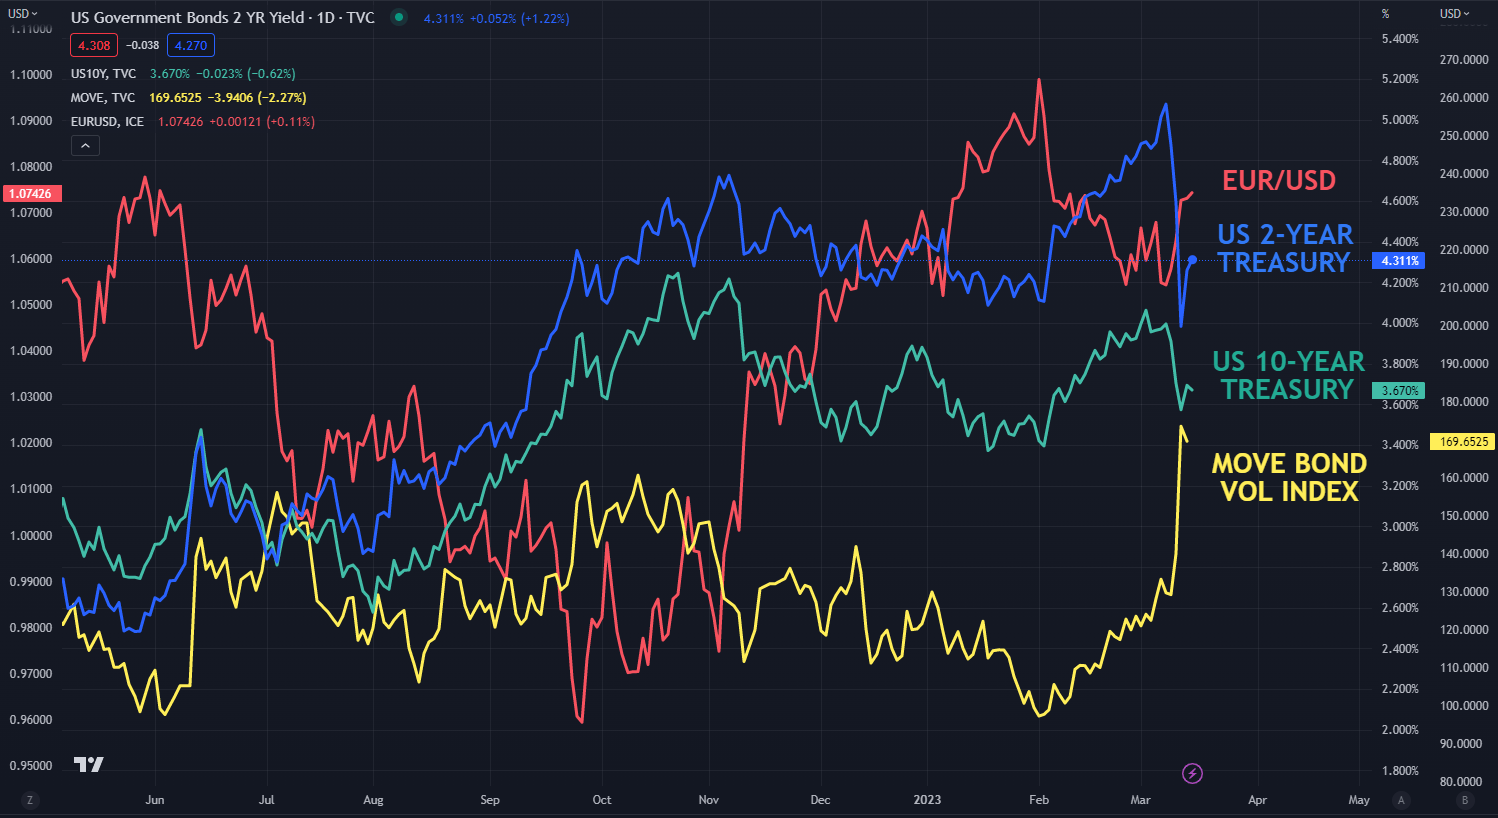
In general, financial markets stabilised on Wednesday after the tempestuous start to the week that saw wild swings across many asset classes. Of note was the moves in the 2-year Treasury bond. This has seen the MOVE index go to its highest level since 2008.

The MOVE index is a measure of bond market volatility in a similar sense to the way that the VIX index is a measure of implied volatility in the S&P 500.

Treasury yields went higher across the curve in the US session, but they have eased a touch from 5 years and beyond going into the European session.

EUR/USD AGAINST 2- AND 10-YEAR TREASURY NOTES AND MOVE INDEX

image1.png

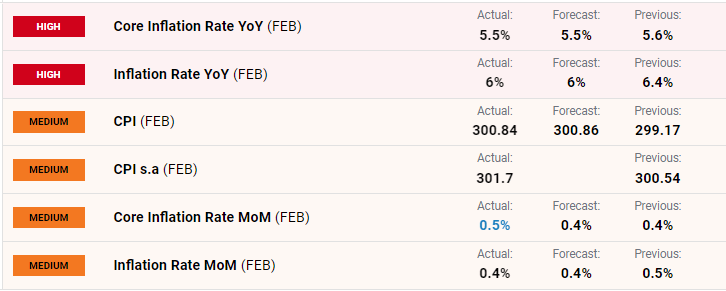
Headline US CPI came in at 6.0% year-on-year and 0.4% month-on-month as anticipated. The monthly core CPI was a slight beat at 0.5% instead of the 0.4% forecast but the annual number was in line at 5.5%.

This has sharpened the focus on next week’s Federal Open Market Committee (FOMC) meeting for the rate path ahead in light of the recent chaos.

APAC equities are all in the green to varying degrees today following on from Wall Street’s positive lead as calm appears to have been restored. Hong Kong’s Hang Seng Index (HSI) led the way, rallying over 1% after mixed Chinese data.

Industrial production there was a small miss at 2.4% YoY to the end of February rather than the 2.6% anticipated and retail sales were in line for the same period at 3.5%. Fixed assets ex-rural were a beat at 5.5% instead of the 4.5% forecast, again for the same period.

Additionally, the People’s Banks of China (PBoC) added more liquidity than expected at the 1-year medium-term lending facility (MLF).

Crude oil recovered after selling off again yesterday. The WTI futures contract is near US$ 72.50 bbl while the Brent contract is around US$ 78.50 bbl at the time of going to print. Gold is steadily straddling US$ 1,900 going into the Euro session.

There will be more CPI data across Europe today that may feed into expectations for the European Central Bank’s (ECB) meeting tomorrow. The interest rate market is leaning toward a 50 bp lift there.

EUR/USD TECHNICAL ANALYSIS

EUR/USD remains in an ascending trend channel after testing the lower band last week. The price remains above the 100-, 200- and 260-day simple moving averages (SMA) and this may suggest that underlying long bullish momentum could be intact for now.

Resistance could be at the breakpoints and prior peaks of 1.0805, 1.0936, 1.0945 and 1.1030. On the downside, support may lie at the recent lows in the 1.0525 – 1.0535 area ahead of the prior lows of 1.0483 and 1.0443.

image2.png


Euro Price Forecast: Wait & See for EUR/USD, US CPI

Euro Price Forecast: Wait & See for EUR/USD, US CPI

EURO FUNDAMENTAL BACKDROP

The euro is trading cautiously this morning which is to be expected as markets prepare for the upcoming US CPI report (see economic calendar below). There has been little follow through from the recent SVB and Signature collapse today but the Federal Reserve and European Central Bank (ECB)’s dovish repricing has now shifted so significantly that a inflation miss could really drive this narrative to fruition and possibly see a Fed rate pause or cut in the March meeting. Generally, the Fed stops hiking rates when conditions are poor, exposing high beta FX currencies to downside risk while the US dollar’s safe-haven allure comes into play. In short, if this is the Fed’s last interest rate hike, history suggests being short the USD could be an unwise decision.

EUR/USD ECONOMIC CALENDAR

image1.png

As mentioned above, the ECB rate probabilities (refer to table below) have been significantly repriced as well which has limited EUR upside and now challenges the almost certain 50bps rate hike that was assured by ECB President Christine Lagarde.

ECB INTEREST RATE PROBABILITIES

image2.png

The trading day will close out with the Fed’s Bowman’s address and it will be interesting to get the perspective from a Fed official who may reflect the overall thoughts of the Fed itself.

TECHNICAL ANALYSIS

EUR/USD DAILY CHART

image3.png

Daily EUR/USD price action has the dollar stronger this morning against most G10 currencies now hovering around the 1.0700 psychological resistance level/50-day MA (yellow). There is unlikely to be any significant movement between now and the US CPI release with no real directional bias evident. The Relative Strength Index (RSI) indicates no momentum preference to neither bulls nor bears thus highlighting the importance of US inflation and markets current cautious approach.

shows

Resistance levels:

  • 1.0700
  • 1.0615

Support levels:

  • 1.0500

IG CLIENT SENTIMENT DATA: BEARISH

IGCS shows retail traders are currently SHORT on EUR/USD, with 53% of traders currently holding short positions (as of this writing). At DailyFX we typically take a contrarian view to crowd sentiment; however, due to recent changes in long and short-term we arrive at short-term downside disposition.

Gold Price – XAU/USD Eyes Support as CPI Nears and US Bond Yields Rebound

Gold Price – XAU/USD Eyes Support as CPI Nears and US Bond Yields Rebound

The global interest rate background has changed dramatically over the last few days with interest rate hikes being priced out by the hour. The collapse of SVB Bank and Signature Bank in the US has prompted markets to reduce rate hike expectations sharply, with one 25bp rate hike in the US seen as a coin toss at the March meeting, before rate cuts are seen from the end of Q2 onwards.

image1.png

US Dollar Grips on as SVB Fallout Brings US CPI Into View Ahead of the Fed

US Treasury yields have fallen sharply in the last few days as rate expectations change. The US 2-year touched a high of 5.08% last Thursday before slumping to a multi-month low of 3.83% earlier in today’s session. The yield has reversed higher in Europe but still remains vulnerable to further losses.

US 2-Year Yield

image2.png

Gold has benefitted not just from the global re-pricing of rate cuts but also from its haven status. The precious metal is part of a group of goto safe-haven assets that include US Treasuries, the Japanese Yen and the Swiss Franc. The precious metal broke above $1,900/oz. on Monday as traders sought safety from possible bank contagion. Gold remains above $1,900/oz. but is likely to test this new level of support, especially if the US inflation number comes in hot. Below here $1,878/oz. comes into view and this level may hold any short-term sell off unless the interest rate background turns hawkish again.

Gold Price Daily Chart – March 14, 2023

image3.png

Bitcoin and Ethereum Extend Gains on Hopes of Less-Hawkish Fed

Bitcoin and Ethereum Extend Gains on Hopes of Less-Hawkish Fed

Bitcoin and Ethereum shake off Fed fears, extending gains

Bitcoin prices jumped on Monday after the collapse of SVB triggered fear throughout the banking system. While US regulators rushed to ease fears on Sunday evening, the injection of additional liquidity and the safeguarding of client deposits drove cryptocurrency higher.


Although the sudden closure of Signature and New York Bank posed an additional threat to digital assets, the assurance by the US treasury, Fed and FDIC (Federal Deposit Insurance Corporation) helped boost demand for risk assets.

Additionally, the recent incident has reduced expectations of another aggressive rate hike at the upcoming FOMC. Because both Bitcoin and Ethereum are sensitive to rising interest rates, a shift in the narrative pushed yields 2-year yields to a six-month low, weighing on Dollar strength.

Image taken from Nick Cawley’s article: Gold Price – XAU/USD Eyes Support as CPI Nears and US Bond Yields Rebound

US 2-YEAR YIELD

image1.png

Bitcoin Price Analysis

With BTC/USD progressing toward the next zone of psychological resistance at $25k, ETH/USD reached $1,700 which remains as major resistance for the imminent move. After the formation of a hammer candle on the daily chart, the aggressive move higher has seen Bitcoin rise over 20% since Friday’s close.

As the current daily high holds around the $24,917 handle, a potential rising-three methods formation (a five candlestick pattern) on the weekly chart suggests that bullish continuation may be possible if prices can clear $25,000.

Bitcoin (BTC/USD) Daily Chart

image2.png

Breaking News: Headline US Inflation Drops to 6%, US Dollar Undecided

Breaking News: Headline US Inflation Drops to 6%, US Dollar Undecided

Headline inflation (y/y) in the US fell by 0.4% to 6% in February, in line with analysts’ expectations, while core inflation nudged 0.1% lower to 5.5%, also in line with forecasts. According to the US Bureau of Labor Statistics,

‘The index for shelter was the largest contributor to the monthly all items increase, accounting for over 70 percent of the increase, with the indexes for food, recreation, and household furnishings and operations also contributing. The food index increased 0.4 percent over the month with the food at home index rising 0.3 percent. The energy index decreased 0.6 percent over the month as the natural gas and fuel oil indexes both declined.’

image1.png

US Dollar Grips on as SVB Fallout Brings US CPI into View Ahead of the Fed

The recent bout of banking contagion fear, sparked by the Silicon Valley Bank failure, will remain uppermost in the Fed’s thinking when they announce their latest monetary policy decision on March 22nd. While the central bank’s actions in making depositors whole have eased concerns, the fear that other, smaller, banks are sitting on unrealised bond losses will continue, especially if the Fed continues to hike interest rates. Market expectations for further rate hikes have been pared back sharply in the last few days, but if inflation remains high then chair Powell and his colleagues will have to decide whether to continue to push down on inflation by tightening monetary conditions or to wait and see if prior rate hikes start passing through the system and dampen price pressures.

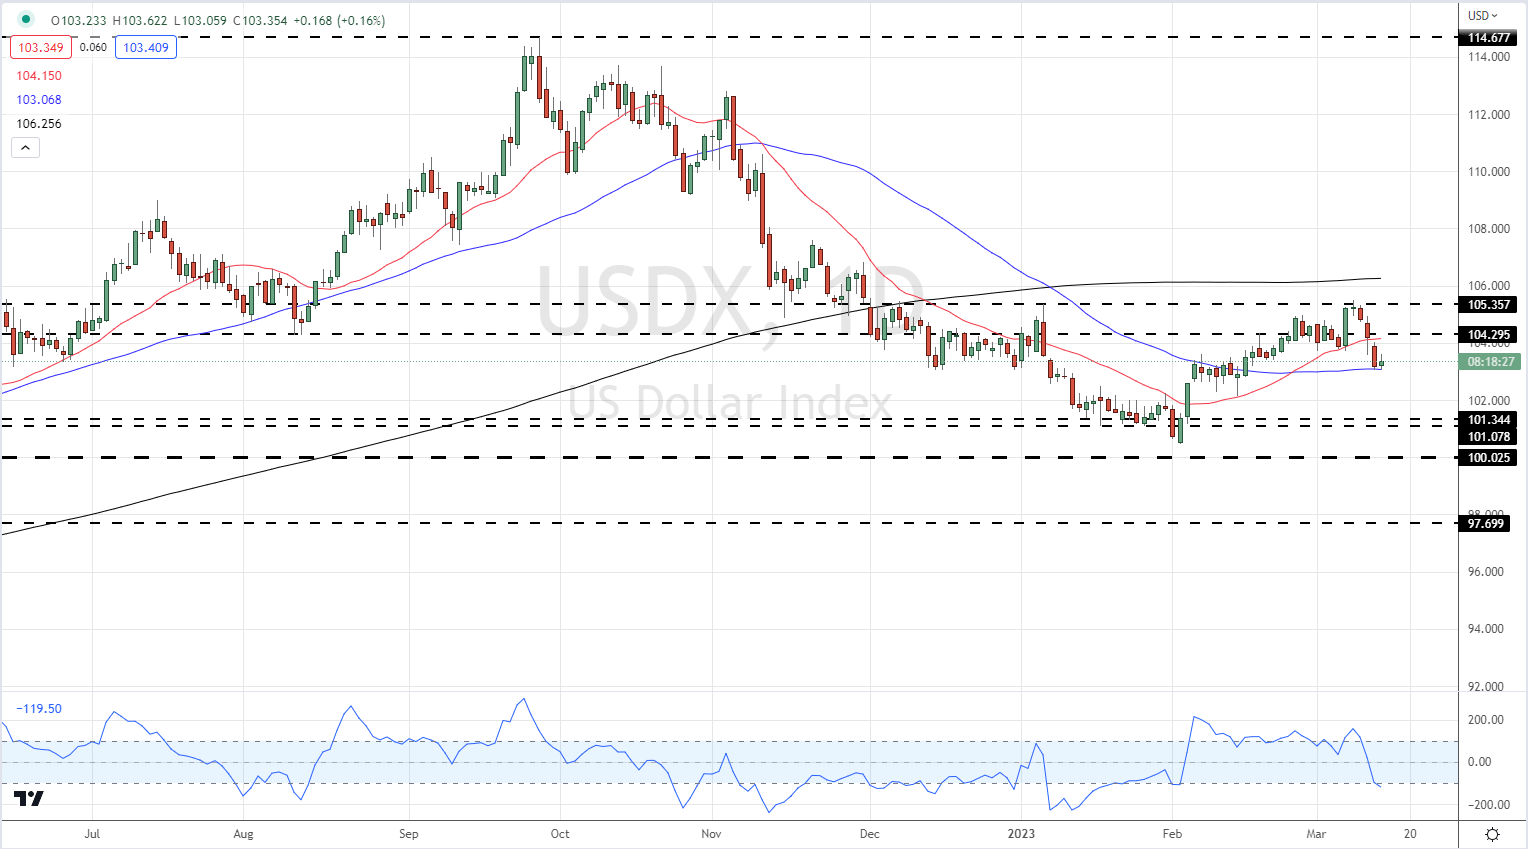
The US dollar slipped 15 pips after the release before recouping these small losses and trading flat. The US dollar is currently battling contrasting forces of banking contagion fears and lower US Treasury yields and remains highly volatile.

US Dollar (DXY) March 14, 2023

image2.png

Chart via TradingView

Crude Oil Futures: Scope for further losses

Crude Oil Futures: Scope for further losses

Open interest in crude oil futures markets increased for the fifth consecutive day on Monday, this time by around 4K contracts according to preliminary readings from CME Group. Volume followed suit and went up by nearly 226K contracts, reversing the previous daily drop.

WTI: Next on the downside comes $70.00

The WTI started the week on the back foot amidst increasing open interest and volume, which is indicative that further weakness lies ahead for the commodity, at least in the very near term. Against that, the loss of the 2023 low at $72.30 (February 6) could put the key $70.00 mark per barrel back on the traders’ radar.

Share: Share on Twitter Share on Facebook Copy to clipboard
Ready or Not! Here Comes US Inflation Data

Ready or Not! Here Comes US Inflation Data

A look at the day ahead in European and global markets from Ankur Banerjee

Investors are struggling to find their risk appetite this week, with markets jittery in the wake of the stunning collapse of Silicon Valley Bank and measures by U.S. authorities to stem contagion risks.

And yet, global banking stocks have been brutally hit, with Japanese banks sinking to their lowest in nearly three months on Tuesday. The dollar remains pinned near a one-month low, while oil prices fell more than $1 and MSCI ex-Japan index languishing at more than two month lows. And while the two-year U.S. Treasury yield was up 16 basis points at 4.109% on Tuesday, it remained far off last week’s high of 5.085%.

All of that means that the market is ready to believe the Fed may just stay pat and not hike next week, with peak rates not far off. Traders are even pricing in rate cuts by the end of the year, a far cry from expectations last week of interest rates staying above 5% through 2023.

The tentativeness might not pass through to Europe, though, as futures indicate stocks might be in for a higher open. Whether they sustain any gains remains to be seen. Investors will be keen to see if the worst is over for European banking stocks, with eyes on the STOXX banking index, which clocked its biggest one-day percentage drop in a year on Monday.

The spotlight will be firmly on U.S. inflation data for February, due later in the day, when consumer prices are seen to have risen at a solid pace, but economists are divided on whether the data will be enough to push the Fed Reserve to hike rates again next week.

Graphic: US 2-year Treasury yield sinks SVB, Signature Bank closures- https://www.reuters.com/graphics/USA-BONDS/gdpzqmzkmvw/graphic.jpg

Graphic: Bank run fears drive change in odds for March rate hike- https://www.reuters.com/graphics/USA-BONDS/gdpzqmzkmvw/graphic.jpg

Key developments that could influence markets on Tuesday:

Economic events: CPI data from Netherlands, Finland, Spain and the United States