Producer and Import Price Index fell by 0.2% in February

Producer and Import Price Index fell by 0.2% in February

14.03.2023 – The Producer and Import Price Index fell in February 2023 by 0.2% compared with the previous month, reaching 109.0 points (December 2020 = 100). In particular, petroleum and natural gas as well as petroleum products saw lower prices. Electricity, on the other hand, became more expensive. Compared with February 2022, the price level of the whole range of domestic and imported products rose by 2.7%. These are the results from the Federal Statistical Office (FSO).

In particular, higher prices for electricity were responsible for the increase in the producer price index compared with the previous month. Articles of concrete, cement and plaster, glass and glass products as well as paper and paperboard also became more expensive. In contrast, prices of petroleum products, pharmaceutical products, aluminium products and meat declined.

The import price index registered lower prices compared with January 2023, particularly for petroleum and natural gas. Petroleum products, organic products of the chemical industry, plastics in primary forms, flat glass, computers and pharmaceutical preparations also became cheaper. On the other hand, rising prices were observed for basic pharmaceutical products, non-ferrous metals and products made therefrom as well as flat steel products and hollow glass. The same applied to ceramic flags, tyres for vehicles and articles of concrete, cement and plaster.
US CPI Reading Takes a Temporary Back Seat to Banking Crisis

US CPI Reading Takes a Temporary Back Seat to Banking Crisis

The most important event on the economic calendar ahead of the Federal Reserve’s monetary policy meeting this month is no longer the latest reading on inflation. Tuesday’s consumer price index reading is being overshadowed by turmoil in the banking industry.

Silicon Valley Bank on Friday became the biggest US lender to fail in more than a decade just days after Silvergate Capital Corp. announced it was shutting its bank. Then on Sunday, New York state financial regulators seized Signature Bank. The collapses led the Fed to launch a new emergency program to backstop banks. So now inflation is no longer top of mind for investors.

“The usual statistics — even one as critical as CPI — take a back seat to a banking crisis,” said Steve Sosnick, chief strategist at Interactive Brokers.

The events are triggering traders to recalculate the magnitude and pace of the Fed’s interest-rate hiking path to tame inflation. Pacific Investment Management Co.’s Daniel Ivascyn said Monday the Fed could pause rate increases as soon as this month, while economists at Goldman Sachs Group Inc. said they no longer expect the central bank to deliver a rate hike at its March meeting.

“Systematic issues like this, like a potential bank run or liquidity event, is going to supersede economic data in the near term,” said Matt Miskin, co-chief investment strategist at John Hancock Investment Management, adding that a few days before the turmoil broke out in the banking sector, Fed Chair Jerome Powell had hinted that the central bank could be raising rates by as much as 50 basis points at its next meeting.

Those comments now seem outdated. As a more aggressive Fed seems unlikely, yields on 10-year Treasuries fell 18 basis points Monday in New York to 3.52%, following a 20-basis-point drop on Friday. Meanwhile, the yield on the two-year at one point Monday fell nearly 60 basis points to 3.99%.

However, some market watchers say this is all temporary and attention will soon turn back to inflation.

Sylvia Jablonski, CEO and CIO at Defiance ETFs, said that even though recent events could be disinflationary in that they remove capital from the system, the problems of inflation and a hot jobs market remain.

“The Fed is likely to stay the course with further hikes. Perhaps there is a slowdown, or a pause sooner, but I do not think the Fed is done or that a hike is off the books, no matter how CPI comes in,” Jablonski said.

CPI “will come back to the forefront at some point soon enough, but maybe gets lost in it for the time being,” Joanne Bianco of BondBloxx Investment Management told Bloomberg’s ETF IQ show.

Bitcoin Price Forecast: BTCUSD Rallies 18% as $25000 Psychological Level Comes into Focus

Bitcoin Price Forecast: BTCUSD Rallies 18% as $25000 Psychological Level Comes into Focus

Bitcoin continued its rally today benefitting from the US Treasury announcement that it would act as a lender of last resort, effectively guaranteeing all US bank deposits, even the uninsured ones. The world’s largest cryptocurrency by market capitalization rallied around 18% on the day and is now up around 25% since Friday last week.

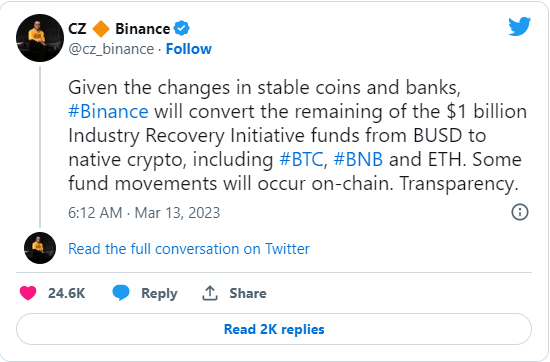
The rally has been somewhat of a surprise given the implosion of SVB and Signature bank, both of whom were seen as crypto friendly institutions. We also saw the decline in USDC over the weekend losing its peg against the US dollar and dropping below the 0.92 handle on Saturday as news around SVB filtered through the crypto market, before rebounding to regain its US dollar peg on Monday. Safety of stablecoins became a hot topic over the weekend particularly on social media as evidenced by the announcement by Changpeng Zhao, CEO of the largest global exchange, Binance. Zhao announced the conversion of some of its branded stablecoin, Binance USD to Bitcoin, Ethereum and its in-house BNB.

image1.png

COLLAPSE OF SVB A EUREKA MOMENT FOR BITCOIN AND CRYPTO?

Many Bitcoin and Crypto observers however see the collapse of SVB bank as somewhat of Eureka moment for the industry. Some believe that the collapse highlights the flaws in the fractional reserve and traditional money systems and may facilitate an uptick in the adoption and interest of self-custody in the form of hardware wallets.

Looking at the numbers today it is hard to disagree with the view that the spectacular failure of SVB and Signature bank may serve as an ad for the adoption of self-custody and promote cryptocurrencies in a world where the holding of physical cash has become somewhat obsolete and, in some cases, ‘frowned upon’. According to data from Coinglass some $160 million in short bitcoin positions and some $300 million in Crypto positions were liquidated on Monday.

Could it be that despite the growing scrutiny on the Crypto industry and the spectacular downfall of FTX late last year, these recent developments breathe new life into crypto and self-custody adoption…..? I think it is too early to tell, but that hasn’t hampered the enthusiasm of Bitcoin advocates, having the opposite effect instead.

TECHNICAL OUTLOOK

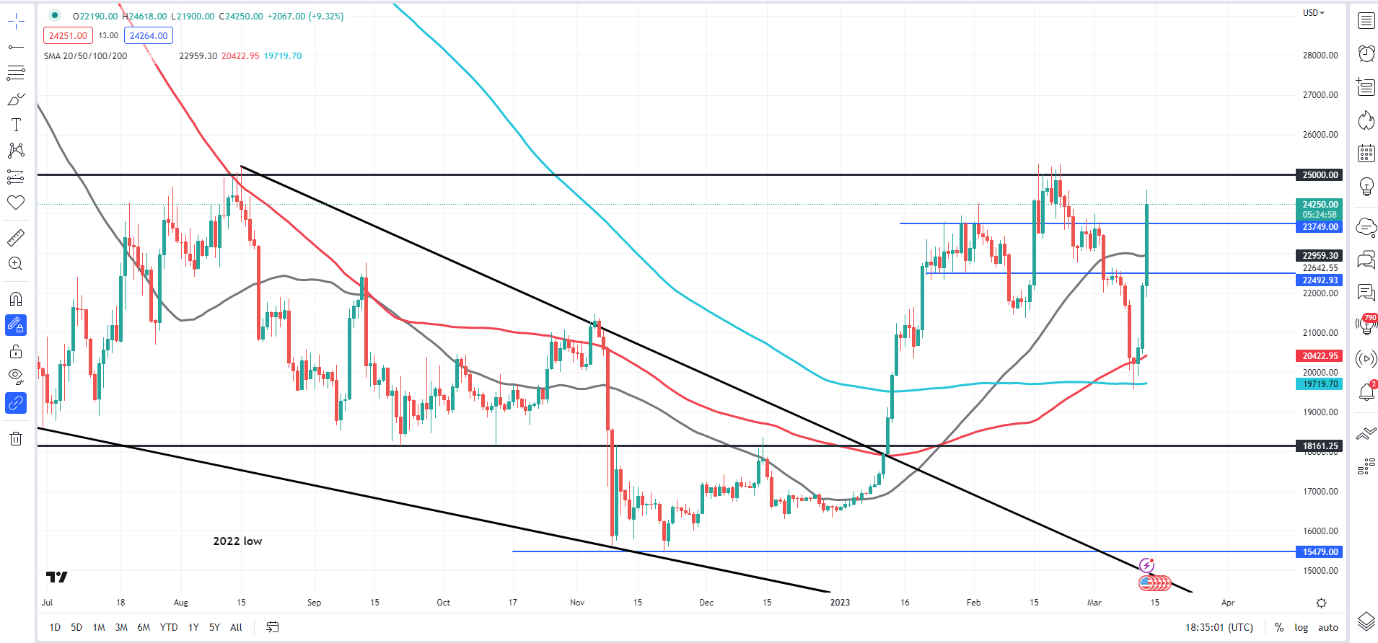
From a technical standpoint the current rally in BTCUSD began on Friday March 10 as it found support at the 200-day MA around the $19700 handle. We had seen a golden cross a few days earlier and one could point to the recent rally as a delayed reaction, however given the macro conditions at play the rally in nonetheless impressive.

On the daily timeframe we have broken two key areas of resistance (Blue lines on the chart) at around $22500 and $23750 respectively with a daily candle close above needed for confirmation of the momentum of the rally. However, the key psychological $25000 handle remains key if we are to see further upside as we have struggled to break above this price point since June 2022. A daily candle close above the $25000 mark opens up the potential for a retest of resistance at $28000 (May 2022 swing low) and beyond that the $30000 mark.

Alternatively, a rejection could see price retest the resistance levels now support at $23750 and $22500 respectively. Exciting times ahead for Crypto and Bitcoin which usually thrives in periods of heightened volatility.

BTCUSD Daily Chart, March 13, 2023.

image2.png


US Dollar Sinks as Yields Collapse After SVB’s Failure, US Inflation Data Ahead

US Dollar Sinks as Yields Collapse After SVB’s Failure, US Inflation Data Ahead

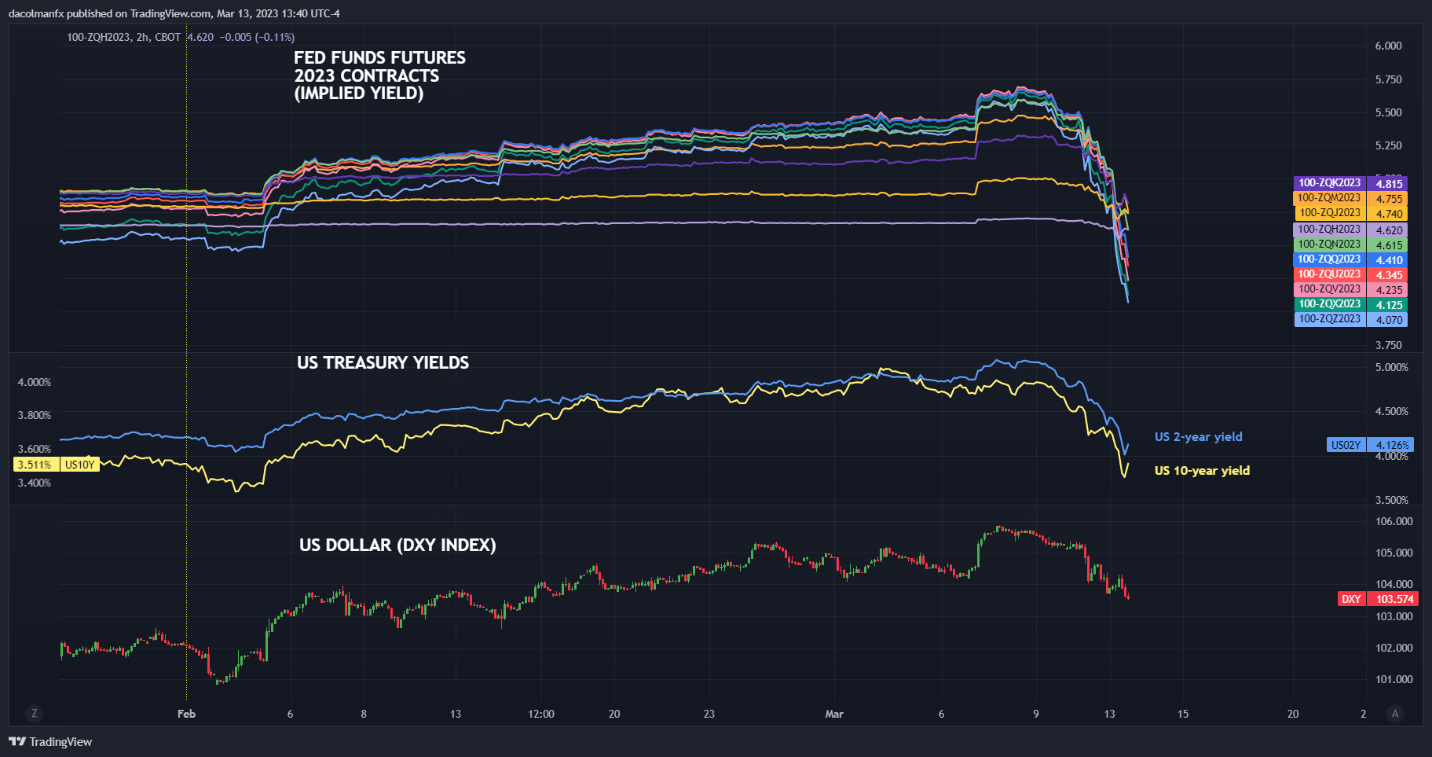
The U.S. dollar, as measured by the DXY index, plunged on Monday, falling nearly 1% and reaching its lowest level in nearly a month, dragged lower by the downward shift in the U.S. Treasury curve in the wake of the Silicon Valley Bank’s collapse.

U.S. bond yields have plummeted since last Thursday amid a dovish reassessment of the Fed’s policy outlook following SVB’s demise, the second largest bank failure in U.S. history. The chart below shows how markets have responded to the ongoing chaos in the U.S. banking sector.

FED FUNDS FUTURES, TREASURY YIELDS AND US DOLLAR CHART

Chart  Description automatically generated

Financial upheaval has caused traders to reprice lower the FOMC’s hiking path on the assumption that policymakers will ultimately abandon their inflation-fighting efforts, at least for now, to avoid a “credit event” that could be catastrophic for the U.S. economy. If proven correct, incoming data, such as the February CPI report due out Tuesday morning, could carry less weight in the FOMC’s reaction function.

Fed Chair Powell embraced an ultra-hawkish position at his Congressional hearing last week, pledging to stay the course, but financial instability is changing the calculus quickly. In fact, recent developments suggest minds are already being swayed, with the central bank launching a lending facility to backstop depository institutions on Sunday, an emergency action that smacks of panic.

In any case, to limit contagion and prevent the current crisis from becoming systemic, the Federal Reserve may soon adopt a more cautious approach and put its aggressive tactics on hold. It is true that price pressures remain strong, but higher inflation for longer would be a less negative outcome than a collapse of the U.S. banking system triggered in part by overly restrictive monetary policy. Judging from recent events, it appears that the cost of additional rate hikes could outweigh its benefits.

With markets starting to discount a Fed dovish pivot, the U.S. dollar could extend losses in the near term unless haven demand picks up pace and boost defensive assets.

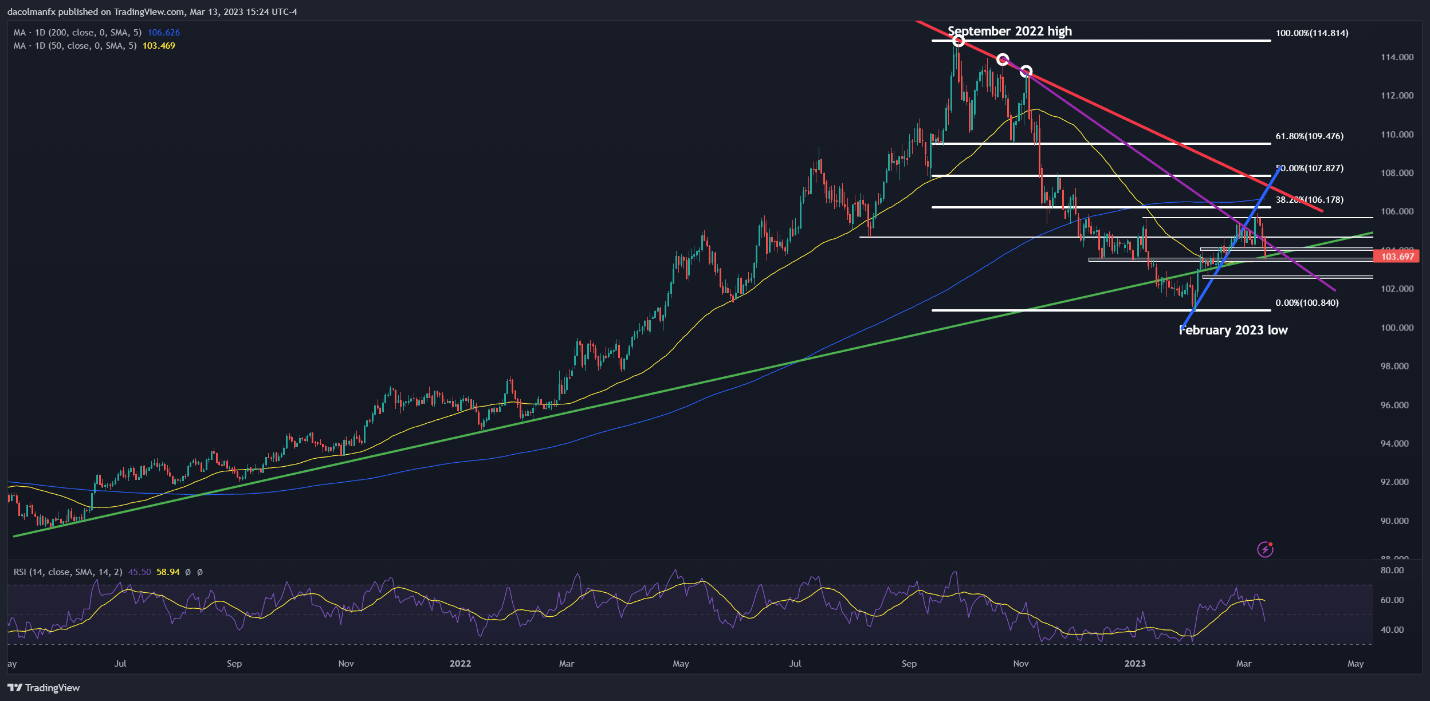
Focusing on technical analysis, the DXY index is currently probing support after the recent selloff, with prices sitting above a long-term rising trendline and the December lows around 103.50. If this area of support is breached, we could see a move towards 102.60, followed by a retest of this year’s trough.

On the flip side, if the index stages a bullish comeback, resistance appears near the psychological 104.00 level, and 104.65 thereafter.

US DOLLAR (DXY) TECHNICAL CHART

Chart, line chart, histogram  Description automatically generated


Dow Jones, Nasdaq 100 Mixed Reaction to SVB Collapse Speaks to Strong Fed Pivot Bets

Dow Jones, Nasdaq 100 Mixed Reaction to SVB Collapse Speaks to Strong Fed Pivot Bets

Asia-Pacific Market Briefing – Markets Strongly Bet on the Fed Pivot

Global market volatility remained tense to start off the new trading week in the wake of last week’s failure of Silicon Valley Bank (SVB). On Wall Street, the Dow Jones fell 0.28% on Monday. But, the tech-heavy Nasdaq 100 rallied 0.45%. The FAANG Index (stocks of the 5 most prominent US tech companies) soared over 1%.

This market reaction comes despite efforts from the US government to shore up confidence in the banking system. These included fully paying off depositors in SVB and Signature Bank. Also, a new lending facility was created at the Federal Reserve where banks can be made eligible for loans if they pledge (mainly) Treasuries and mortgage-backed securities.

Despite these measures, investors heavily punished regional banks on Monday. Shares from Western Alliance (-47%) and First Republic (-62%) were a couple of the standouts. Meanwhile, traders heavily bought up Treasuries. The 2-year bond yield plummeted as markets quickly and rapidly repriced the Federal Reserve rate outlook.

At a first glance, the market reaction looks to be focusing more on the immediate implications of a potential Fed pivot. The US Dollar, the go-to haven, has been punished since Wednesday. Meanwhile, anti-fiat gold prices soared. This was the exact opposite reaction you saw from these instruments as we in the few months leading into the 2008 recession. Bitcoin soared on Monday.

As such, traders ought to proceed here with caution. Historically speaking, the bottoming of the yield curve (in this case, the spread between 10-year and 2-year rates) has been associated with preceding recessions. This spread soared a massive 54% on Monday (although it remains inverted). As a reminder, the 2-year rate topped in June 2006 before accelerating lower one year later. The recession was in Q3 08.

Looking toward Tuesday’s Asia-Pacific trading session, volatility remains a key risk for regional indices. There is a chance that markets will continue to focus on the Fed pivot. That may end up boosting stocks in certain sectors. But, keep in mind that in less than 24 hours, the next US inflation report crosses the wires. Another sticky print could further elevate market uncertainty.

Dow Jones Technical Analysis

The Dow Jones appears to be trading within the boundaries of a Descending Channel since the end of December. Prices recently tested the floor as well as the key 31738 – 32017 support zone. From here, a bounce would place the focus on the 50-day Simple Moving Average (SMA). Otherwise, breaking lower opens the door to extending the near-term downtrend.

Daily Chart

Dow Jones Technical Analysis

Nasdaq 100 Technical Analysis

The Nasdaq 100 also appears to be trading within a Descending Channel. Prices tested the floor but closed above it. Also, the Nasdaq was unable to clear the 50-day SMA, establishing it as key support. Prices have been unable to break this SMA since the beginning of this month. A turn higher places the focus on the channel ceiling. Otherwise, extending losses exposes the 61.8% Fibonacci retracement level at 11717.

Daily Chart

image2.png

Gold Price Surges as US Dollar is Eroded by SVB Collapse Ahead of US CPI

Gold Price Surges as US Dollar is Eroded by SVB Collapse Ahead of US CPI

Gold made a six-week high overnight as the fallout from the failure of Silvergate Financial Corp., SVB Financial and Signature Bank continues to ricochet through markets.

The US Dollar has been hit hard, undermined by the Treasury yields protracted retreat with the 2-year note trading more than 100 basis points lower from its 15-year peak above 5% last week, touching 3.94% yesterday.

Yields collapsed further out along the curve but to a lesser extent the longer the duration. Importantly for the gold price, real yields collapsed with the closely watched 10-year falling to 1.16% from the high seen last week at 1.72%. Real yields are the nominal yield less the market priced inflation rate for the same tenor.

With gold being a non-interest bearing asset, the disintegration of returns from other assets might assist the yellow metal.

In a similar way that the VIX index is an indicator of market-priced volatility for the S&P 500, the OVZ index is a measure of gold volatility. Not surprisingly, it has climbed in this current rally for the precious metal as markets recalibrate in wake of the recent disruptions.

Elsewhere in the gold options market, the 1-month 25 delta risk reversal has sprung higher. This indicates that the market is potentially clambering to buy gold calls more than gold puts and may signal that demand is picking up for perceived haven assets.

US CPI due out later today may not have the same impact on Fed rate hike expectations that it would have had without the collapse of the banks. The interest rate market is now placing a 70% probability of a 25 basis point lift rather than a 50 bp move that was priced in last week.

If CPI prints below forecasts of 0.4% month-on-month for February, it may see the chance of a rise in rates by the Fed next week deteriorate. This could see the US Dollar come under pressure, potentially adding to gold’s allure.

GOLD AGAINST US DOLLAR (DXY), US 10-YEAR REAL YIELDS AND VOLATILITY (GVZ)

image1.png


Crude Oil Faces Perfect Storm if US Inflation Pours Gasoline on Uncertainty Flame

Crude Oil Faces Perfect Storm if US Inflation Pours Gasoline on Uncertainty Flame

WTI crude oil prices fell 2.55% on Monday as market volatility remained elevated in the fallout of last week’s collapse of Silicon Valley Bank. Since last Wednesday, the commodity is down about 3.3%.

Sentiment-linked crude oil was and may continue to remain vulnerable in the coming days/weeks/months as traders assess the likelihood of the United States economy entering a recession. Despite steps taken by the government to shore up confidence in the banking system, investors punished regional bank stocks on Monday.

However, a closer glance reveals that the market reaction on Monday seems to place much more emphasis on expectations of a Federal Reserve pivot than worries about a recession (for now). In fact, traders have priced in about 150 basis points in rate cuts by the Fall of this year. In response, the haven-linked US Dollar sank, and traders piled into tech stocks. The Nasdaq 100 outperformed the Dow Jones.

During Tuesday’s Asia-Pacific trading session, sentiment woes continued deteriorating crude oil prices, with WTI falling almost 1.25% by 3 GMT.

Over the remaining 24 hours, market uncertainty could be pushed further. All eyes are on the 12:30 GMT US CPI report. In February, inflation is seen slowing further to 6.0% y/y from 6.4%. As a reminder, January’s print was stickier than anticipated. Another surprisingly strong print could bring back Fed rate hike expectations, placing crude oil at risk.

Crude Oil Technical Analysis – Daily Chart

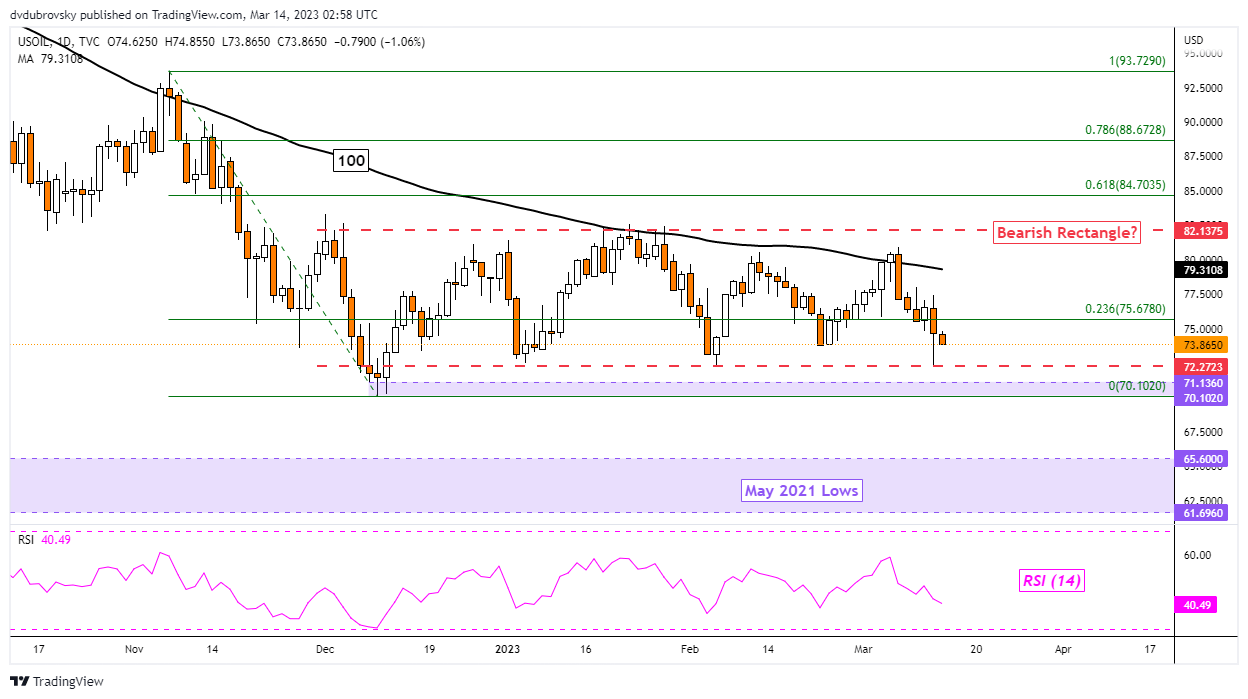
On the daily chart, crude oil is fast approaching the floor of a Bearish Rectangle chart formation. The price seems to be around 72.27. However, immediately below is the December low at 70.10 – 71.13. Confirming a breakout under the latter exposes lows from May 2021.

Crude Oil Technical Analysis – Daily Chart

Crude Oil Sentiment Analysis – Bearish

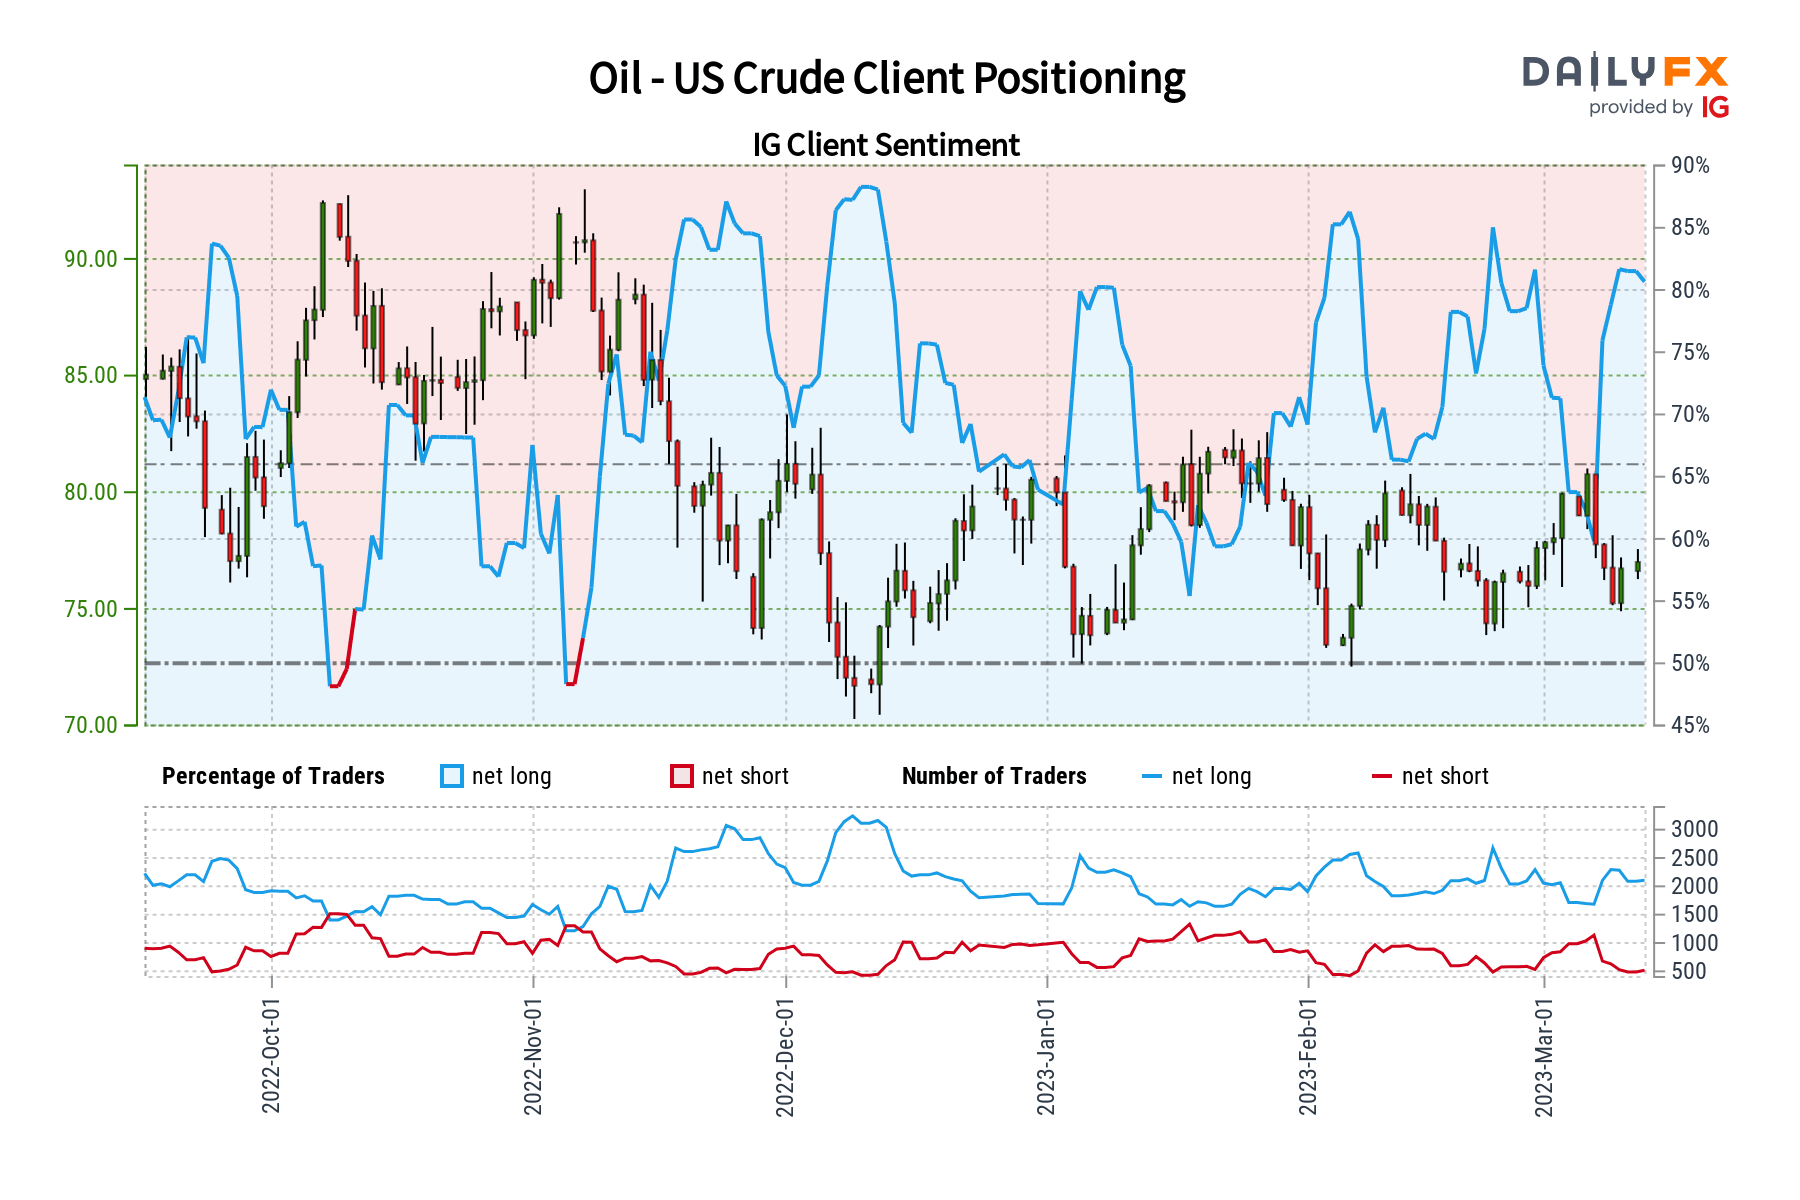
Looking at IG Client Sentiment (IGCS), which tends to be a contrarian indicator, about 82.78% of retail traders are net-long crude oil. Since most of them are biased to the upside, this hints that prices may continue falling. Meanwhile, upside exposure increased by 9.56% and 30.63%, respectively. With that in mind, the combination of overall positioning and recent changes in exposure offers a stronger bearish bias.

Crude Oil Sentiment Analysis - Bearish

US Dollar Grips on as SVB Fallout Brings US CPI into View Ahead of the Fed

US Dollar Grips on as SVB Fallout Brings US CPI into View Ahead of the Fed

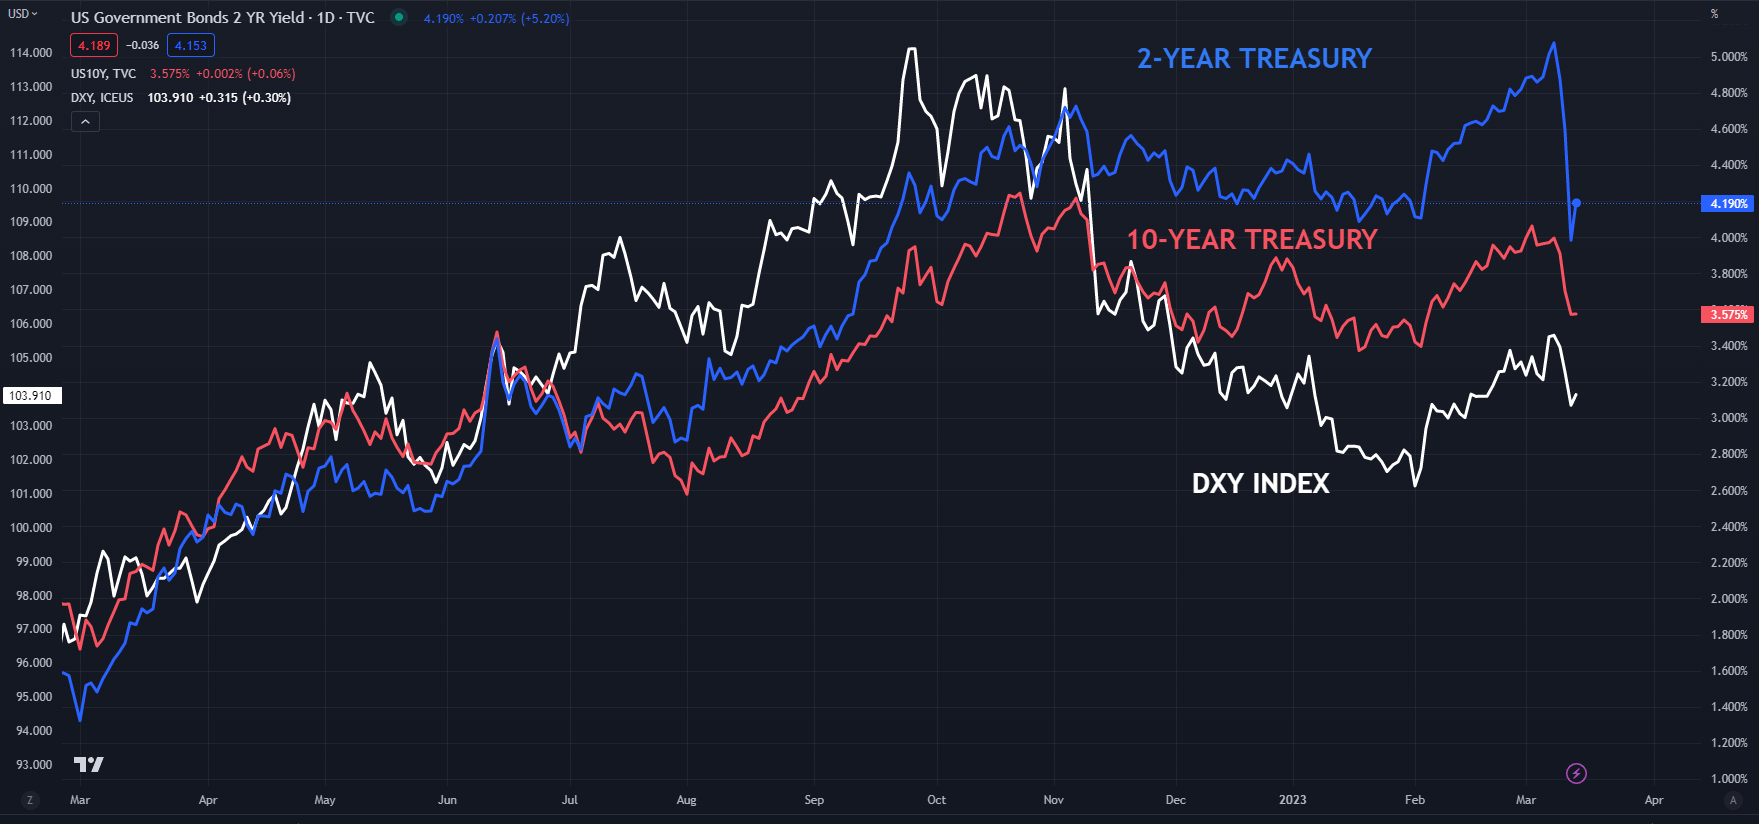
The US Dollar descent has paused so far today after a torrid start to the week. Treasury yields have climbed across the curve, but they remain a long way from the heights seen last week.

The benchmark 2-year note nudged 4.20% in the Asian day after having dipped to 3.94% overnight, well below 5% plus this time last week.

The repercussions of the failure of SVB and Signature Bank are still playing out. The stock prices of US regional banks are seeing enormous losses, but the large-cap banks are holding up relatively well, although still in the red.

Regardless the KBW bank index, an index of 23 listed banking names in the US, is down from nearly 116 at the start of this month to trade below 80 overnight.

Broader Wall Street steadied in the Monday cash session and futures are so far pointing toward a positive start to their day ahead.

APAC equity indices are all underwater with Japan leading the way lower. Sharp declines in banking stocks there dragged the TOPIX index down over 3% at one stage.

Given the pressure on the technology sector, it is no surprise that Korea’s KOSDAQ index is also notably lower, down over 2.5%.

In all the turmoil, gold has held onto recent gains as a combination of collapsing real yields, USD weakness and a run to perceived safety appear to have boosted the precious metal.

Crude oil dipped lower in the North American session before recovering into the close. It has slipped a touch going into the European session with the WTI futures contract near US$ 74 bbl while the Brent contract was around US$ 80 bbl at the time of going to print.

This brings into focus today’s US CPI number and its consequences for the Federal Open Market Committee (FOMC) meeting next week. No matter what the print is, uncertainty appears to be the only certainty. A Bloomberg survey of economists is anticipating a 0.4% month-on-month CPI increase for February.

Pan-European inflation figures will continue to come through today and tomorrow ahead of the European Central Bank’s (ECB) meeting on Thursday.

The full economic calendar can be viewed here.

DXY (USD) INDEX AGAINST TREASURY 2- AND 10-YEAR

image1.png


Breaking News: UK Unemployment Rate Remains Steady at 3.7%, GBP/USD Edges Lower

Breaking News: UK Unemployment Rate Remains Steady at 3.7%, GBP/USD Edges Lower

The latest data out from the UK continues to display the strength of the UK labor market as the number of people working in the UK grew by 65k (3-month period to end of Jan 23) well above the forecast figure of 52k. The increase was largely driven by part-time employees and self-employed workers.

Graphical user interface, text  Description automatically generated with medium confidence

Customize and filter live economic data via our DailyFX economic calendar

The unemployment rate held relatively steady on the quarter at 3.7% while the number of people unemployed for over 12 months increased slightly in the latest three-month period.

Average Earnings Excl. Bonus in the UK decreased to 6.50 percent in January from 6.70 percent in December of 2022 while the average earnings incl. bonus eased to 5.7 percent year-on-year in the three months to January 2023. In real terms (adjusted for inflation), growth in total and regular pay fell on the year in November 2022 to January 2023, by 3.2% for total pay (largest decline since the February to April 2009 period) and by 2.4% for regular pay.

image2.png

Source: Office for National Statistics

UK BUDGET (SPRING STATEMENT) OUTLOOK

Looking ahead to tomorrow we have the UK Budget (Spring Statement) to be delivered by Chancellor Jeremy Hunt. The recent spate of data out of the UK has shown resilience which has been echoed by both the Prime Minister and Chancellor in recent weeks, however both were keen to stress that work still needs to be done.

Lower gas prices are a huge plus for the Chancellor with some reports estimating the cost of the energy price guarantee for the 2023 financial year to have fallen from an estimated GBP13 billion (Autumn Statement) to around the GBP2billion mark ahead of tomorrow’s budget announcement. This decline should allow the Chancellor the opportunity to scrap the proposed increase in gas and electricity prices in April. Fears over any contagion from the SVB bank debacle have taken a backseat following the announcement by HSBC UK that it had acquired the SVB UK unit in what it termed a “Strategic acquisition to strengthen HSBC’s banking franchise in UK”. The move should allow the Chancellor to focus on more pressing domestic matters as summer approaches.

The medium- and longer-term outlook for the UK remains more challenging, particularly from a government debt perspective. There have been positives here as well however, with borrowing so far coming in lower than expected for the current fiscal year. Inflation remains uncomfortably high however and with lower growth expected for the rest of 2023 the Chancellor is expected to maintain many of his policies from the Autumn statement in an effort to bring down Government debt and keep a tight lid on spending.

MARKET REACTION

The initial market reaction following the news has seen GBPUSD decline around 15 pips, which is surprising given the resilience displayed by the jobs data. However, GBPUSD did enjoy a significant rally during the US session yesterday as the dollar struggled with the SVB uncertainty weighing on the greenback.

Yesterday’s bullish move has seen the pair break above the 50-day MA which had served as a key dynamic resistance for GBPUSD since February 3. Resistance to the upside rests at the 1.2270 handle and above that the YTD high at around the 1.2445 mark.

Alternatively, a push lower here has to deal with support provided by the 50-day MA and below that the 100-day MA which rests just above the psychological 1.2000 level.

GBPUSD Daily Chart, March 14, 2023

Chart, histogram  Description automatically generated

LiteFinance to tackle Nigeria’s unemployment challenges – Country Reps

LiteFinance to tackle Nigeria’s unemployment challenges – Country Reps

LiteFinance Executive Director, Alexander Mestovski has said that the company will tackle unemployment in Nigeria by creating jobs as a part of the new development program to create a large-scale system of innovative financial and investment products.
LiteFinance (formerly known as LiteForex) is a ECN broker in the online Forex market, which offers its clients access to liquidity in the currency, commodity, and stock markets for several years.
Being a high-performance platform LiteFinance provides low floating spreads, professional assistance, access to exclusive analytical materials and signals, and offers market execution without requotes.
According to the company’s representatives, an electronic communication network (ECN) has many advantages, including instant execution, no broker’s intervention, requotes, no conflict of interests, and no limits on trading strategies.
It is also worth noting that trades are sent directly to market liquidity. “LiteFinance offers the best copy trading system in the industry. The company’s web platform brings global traders together to form a successful community where they can achieve their goals.
“LiteFinance affiliate program allows users to receive a commission and benefits for attracting new traders and new partners (all commissions and benefits are paid automatically as soon as a referral opens a trade). The automatic processing of withdrawal requests of up to 5000 USD from each trading account. This sum speeds up the money withdrawal and reduces client waiting times so that they can get instant payoffs.
“This option is fully automatic, and no action is required from the client.It’s easy to start trading with LiteFinance.The registration process takes only one minute. The low initial deposit lets anyone become a fully-fledged market participant. The easy-to-manage web platform makes it effortless even for beginners to start trading.
“More than one and a half million people from all over the world are LiteFinance clients. Our company has received numerous awards, including Best Broker in Africa, Asia, and Latin America, and the fastest growing broker in Western Europe and Asia. Also, UK’s leading financial magazine “World Finance” has included LiteFinance in the “100 World Finance” list.Currently, the company has representative offices in more than 15 countries. Also, the number of LiteFinance partners representing the brand in 216 countries is increasing every year, allowing customers to receive a high level of service in their native language anywhere in the world .
“Islamic swap-free accounts offered by LiteFinance do not consider swaps when a position is carried over to the next day, and at the same time, they possess all the account trading advantages. Islamic account is an easy-to-use financial instrument that lets LiteFinance’s clients worldwide, including Islamic countries, freely manage their funds.”

LiteFinance to tackle Nigeria’s unemployment challenges – countryReps