Markets Today: Sharp rise in China’s PMI data; inflation concerns in the U.S. – 2 March 2023

Markets Today: Sharp rise in China’s PMI data; inflation concerns in the U.S. – 2 March 2023

Summary:  China’s PMI data came in stronger than expected and signaled the economic recovery is picking up steam. The data triggered sharp rallies in the Hang Seng Index and commodity prices, particularly industrial metals. U.S. bond yields rose and equities slid, following the ISM price paid index rising to 51.3 and Fed officials’ hawkish comments keeping a 50-bp hike in the March FOMC on the table.

Market Data 2023-03-02What’s happening in markets?

Nasdaq 100 (NAS100.I) and S&P 500 (US500.I) slump to new lows on higher Fed rate bets

Stocks were pressured after fresh economic data highlighted persistent inflationary pressures remain – pushing the S&P500 to close at its lowest level in six weeks after shedding 0.5%. It’s the second straight day the S&P closed under its 50-day moving average. While most sectors declined within the S&P500, energy rallied strongly by nearly 2%. The strong China PMI data helped sentiment in the materials and industrial sectors, both rising on Wednesday. Nasdaq 100 slid 0.9%. The extra pressure on equities came as the prices paid component of the ISM in surging above the 50 expansion/contraction threshold and higher for longer comments from Fed officials (see below).

Key U.S. company news

In regular trading, First Solar (FSLR:xnas) shares surged about 16% to its highest since 2009 after the panel maker’s backlog of orders look like they’ll take the 2nd half of the decade to fill. The surging demand comes as the company is benefiting from the Inflation Reduction Act- signed last year by President Joe Biden. Meanwhile, after close of trade – software giant Salesforce (CRM:xnys) gave a surprisingly upbeat forecast for the year ahead – and plans to step up share buybacks to $20 billion, which is positive vs its $167b market cap. Operating margins will be about 27% in fiscal 2024, exceeding Bloomberg consensus estimates of 22.4% growth. This also potentially eases pressures CRMs faces from a group of activist investors. Salesforce shares rose 14% in post market trade, after closing at $167.35 in normal trade. Next, we will be watching – Campbell Soup (CPB:xnys) which reports after market close Thursday.

US Treasury curve (TLT:Xmas, IEF:xnas, SHY:xnas) sold off on Fed comments

The 10-year yield breached above 4% briefly during the session before closing a touch below that at 3.99%, following comments from the Fed’s Kashkari saying undecided between a 25bp and 50bp hike at the March FOMC and Bostic’s 5-5.25% “well into next year” remarks. Yields on the 2-year notes rose 6bps to 4.88%, the highest level since 2007. The jump of the ISM Prices Paid (see below) also added fuel to the selloff.

Hong Kong’s Hang Seng Index (HSI.I) and China’s CSI300 (000300.I) jumped on strong China PMIs

Hang Seng Index surged 4.2% and CSI300 gained 1.4% on Wednesday following the release of strong PMI data in China much above consensus estimates. Hang Seng Tech Index jumped 6.6% as technology hardware, China internet, and EV makers advanced sharply. The percentage increase in the Hang Seng Index was the largest since early November and turnover in the Stock Exchange of Hong Kong reached HKD154 billion, the highest since late January.

Chinese developers were among the top winners, with Longfor (00960:xhkg) up 9.6% and Country Garden (02007:xhkg) up 8.3% leading the charge higher. The chairman of Country Garden announced retirement. ASMPT (00522:xhkg) jumped 9% after the semiconductor equipment maker reported Q4 revenues beating estimates. After market close, Techtronic (00669:xhkg) reported H2 EPS of USD0.27 and revenues of USD6.2 billion, both below the consensus estimates due to soft demand for power tools.

In A-shares, telco, digital economy, software, gaming, media, and AI-generated content stocks were the top winners.

Australian equities (ASXSP200.I) rise to four-day highs on commodities rebounding  – beware of companies going ex-dividend ahead

After China PMIs beat expectations, with new orders surging back to 2017 level – focus is on commodities strongly rebounding – with the iron ore (SCOA) price rising to a five-day high $126.70, the spot Copper (HG1) price trading at a five-day high, while aluminium is also higher. Coles (COL), Woolworths (WOW) go ex-dividend today, along with Pilbara Minerals (PLS).  As a reminder – dividend paying giants, BHP and Rio go ex-dividend this time next week, which could pressure equities.

FX: Dollar unable to bask in yields glory

The US dollar was weaker on Wednesday mostly pressured by the gains in Chinese yuan in the Asian session after the upbeat China activity data sent the China reopening theme roaring once again. USDCNH dropped from 6.96 to sub-6.88. Some reversal in the dollar was seen in the US session but it was not enough to reverse earlier losses. Some other currencies also got a bid from the China theme, particularly EURUSD that surged to highs of 1.0691 also underpinned by rising hawkish ECB expectations after hot regional inflation prints. NZDUSD was the outperformer in G10 FX, rising to 0.6276 with Q4 terms of trade returning to positive territory at 1.8% from last month’s -3.9% QoQ. GBPUSD stayed below 1.2100 despite Bailey signaling more BOE hikes may be needed, and saying that the experience in the 1970s showed that doing “too little with interest rates now” may mean more increases later on.

AUD reverses course, rising above its 100-day moving average

The Australian dollar against the US (AUDUSD) advanced for the first time following four days of losses, after China’s manufacturing activity boosted sentiment – hitting a decade high – with new orders improving in February, surging to 54.1 – the highest level since September 2017. This enthusiasm is buoying commodity prices on the notion that demand will rise – the iron ore (SCOA) has risen to a five-day high of $126.70, spot Copper (HG1) hit a five-day high, while aluminium is also higher. This optimism is offsetting the slowing Australian prints released yesterday- with GDP grinding down to pace of 2.7% YoY in the 4Q as expected- while monthly CPI cooled to 7.4% YoY vs the 8.1% price growth forecast. It’s also important to note, short covering has also added to the Aussie dollar rising. Our view is that the Aussie dollar could see strength return in Q2, in line with our view that the commodity bull market will strongly restart in Q2.

Crude oil struggling to lean on Asia/Europe vs. US demand

Crude oil prices remained near recent highs despite the strong signal on Chinese demand recovery from upbeat PMI data. In addition, the inventory data was also bullish signalling a recovery of demand in Asia and Europe. US commercial crude oil inventories gained less than expected last week, rising only 1.2 million barrels as US exports of crude hit a record daily high of 5.6 million barrels last week (+22.4% w/w). However, on the other hand, US ISM data and hawkish Fed speakers continued to highlight inflation fears are here to stay and sparking some US demand concerns. WTI futures traded just below $78/barrel while Brent touched $84.50.

Metals complex excited about China

Copper, aluminum, zinc and iron all traded higher following the outperformance of Chinese PMI data on Wednesday, driving a return of focus to the China reopening theme. Copper, which earlier found support at $4 surged to $4.17 in the Asian morning today, and may take another look at $4.20. However, our head of Commodity Strategy Ole Hansen wrote that the next sustained move higher is unlikely to be triggered until the second quarter or later, the timing to a certain extend depending on the economic outlook for the rest of the world and whether recession, as we believe, will be avoided.

What to consider?

Mixed US ISM survey details – but steady message on inflation

The US ISM manufacturing marginally rose to 47.7 from 47.4, coming in below expectations of 48.0. New orders lifted to 47.0 (prev. 42.5), while employment fell to 49.1 (prev. 50.6), entering contractionary territory. But the message on price pressures continued to roil markets. ISM priced paid rose back into expansionary territory to 51.3, well above the prior 44.5 and the expected 45.1, re-affirming that it may be too soon to call goods inflation disinflationary.

Hawkish Fed talk brings 10-year yields to top 4%

Fed member Kashkari (voter) signaled an openness for a 50bps hike at the March meeting, saying he is open to both 25bps and 50bps. Still, he emphasized that the terminal rate is more important than the size of rate hikes, where also he hinted that it could be revised higher from December. Another member Bostic (non-voter) maintained his view that the Fed policy rate needs to rise to 5.00-5.25% range, but said that the rate should be left there “until well into 2024”. 10-year Treasury yields rose above the key 4% mark for the first time since November, sending another warning signal to equities.

China’s PMIs signaled recovery picking up steam

The headline official NBS PMI surged to 52.6 in February, the highest print since 2012, from 50.1 in January. The strength was across the board with production and new orders improving markedly and the new export orders unexpectedly surging to 52.4, the first time into the expansion territory in 23 months. The NBS non-manufacturing PMI and the Caixin Manufacturing PMI, also released today, both bounced strongly and signaled economic expansion. Readers can find more on China’s PMI here.

Hot German inflation print creates further pressure for the ECB

Coming on the heels of hotter than expected inflation prints in France and Spain for February, German CPI print was also hotter than expected at 9.3% YoY (vs. +9.0% exp and +9.2% prior). The message on disinflation has therefore continued to weaken, and both Fed and ECB are likewise pressured to do more on policy tightening to ensure the inflation comes back to target. Th aggregate Eurozone print is out today and expectations of a softening to 8.3% from 8.6% last month may be tested.

Tesla plots a path to renewable energy at Tesla Investor Day

As part of Tesla’s “Master Plan” for the company, Musk said Tesla’s next phase of growth will be built around building clean energy sources – that can serve a much larger world population – without great economic sacrifice. Moving into sustainable energy might mean moving into heat pumps- as they can dramatically cut home and office heating costs. Tesla dubs them one of the low hanging fruits in the sustainable energy transition. Tesla’s shares are up 97% from their January low.

Breaking News: German CPI Misses Forecasts – Inflation Remains ‘Sticky’

Breaking News: German CPI Misses Forecasts – Inflation Remains ‘Sticky’

German inflation unchanged as CPI shows no sign of easing

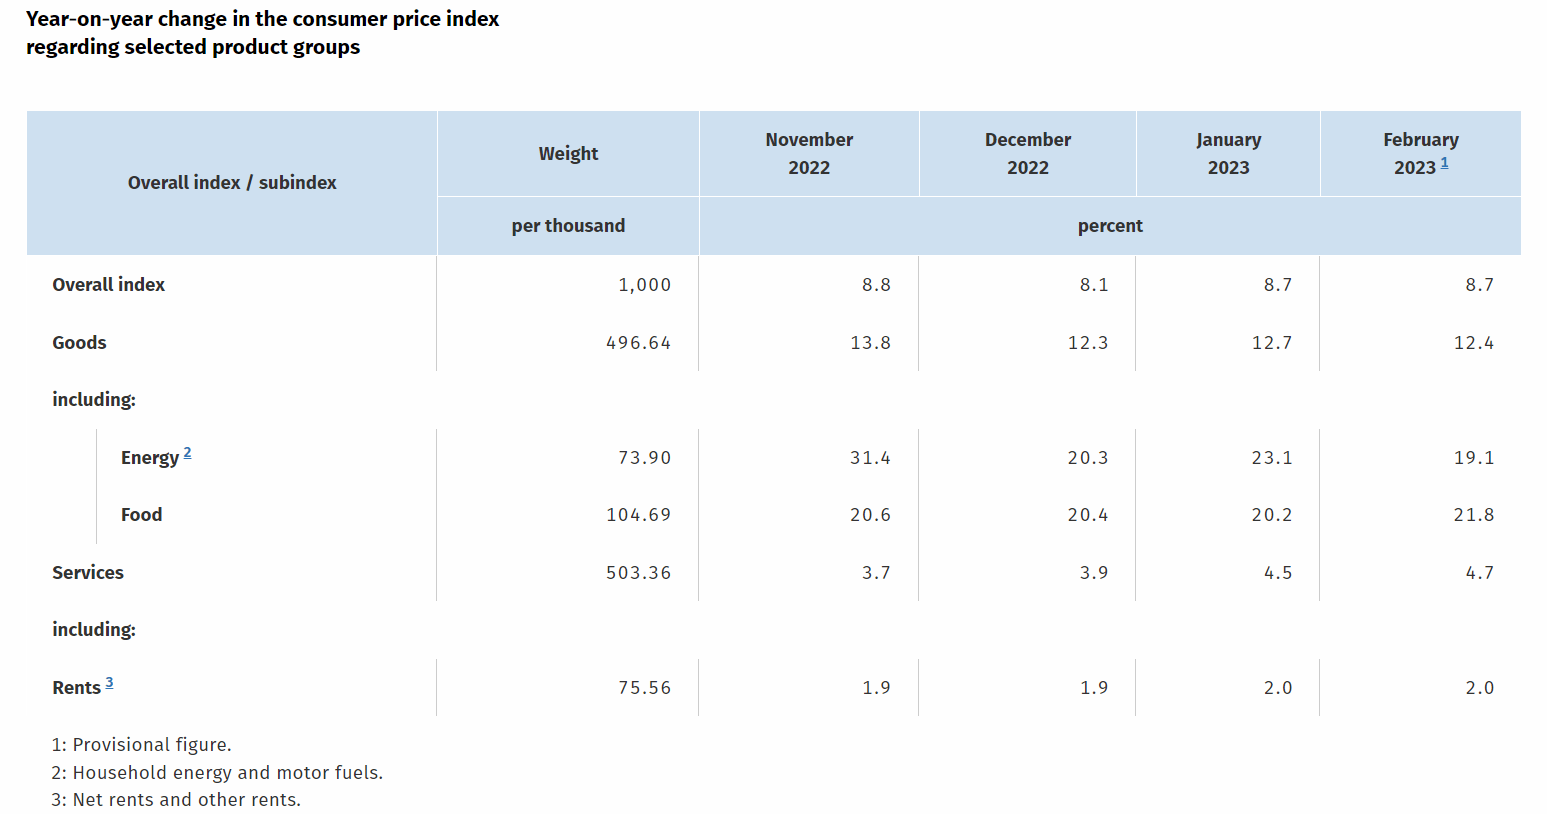
German CPI data for February has been released, with the figures beating expectations on both an annual and month-on-month basis. As the YoY inflation rate remains unchanged at 8.7%, harmonized inflation (including food and energy) rate has risen to 9.3%.

A picture containing text  Description automatically generated

The data that measures the change in the prices of goods and services over a predetermined period suggests that price pressures could remain elevated for longer.

Graphical user interface, table  Description automatically generated with medium confidence

Source: German Federal Statistics

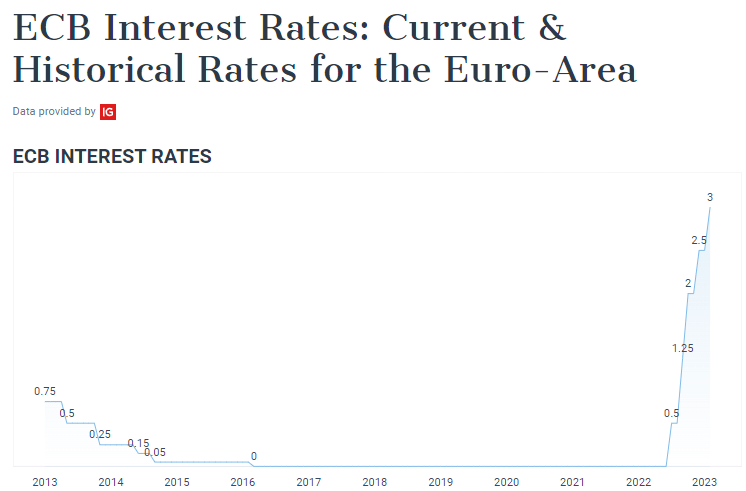
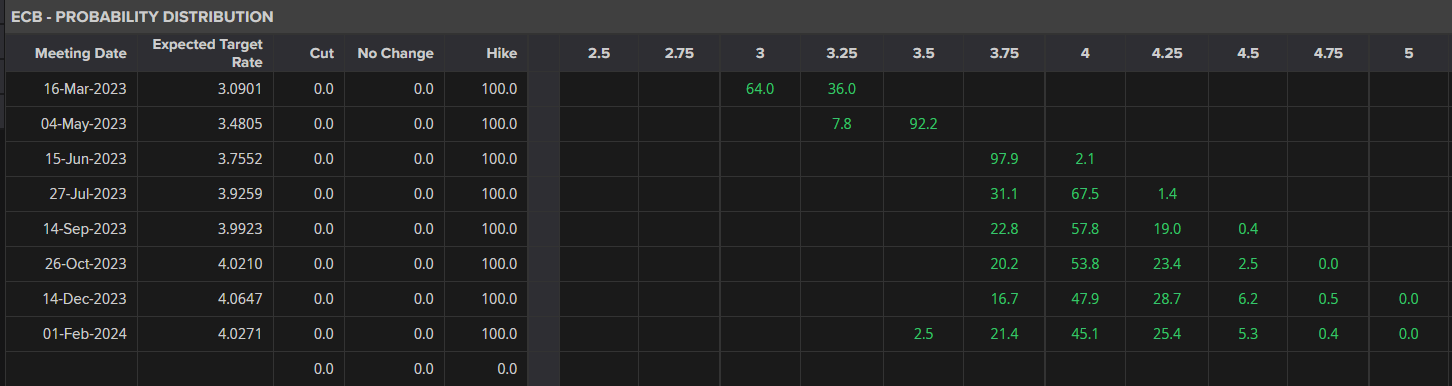
While the ECB (European Central Bank) planned to raise rates by an additional 50 basis-points later this month (16 March), the recent readings from Spain, France and Germany poses an additional threat to the European growth outlook.

Graphical user interface  Description automatically generated

Under ‘normal’ circumstances, higher interest rates reduce consumer spending, driving inflation lower. However, in the aftermath of the Coronavirus pandemic, ballooned balanced sheets and the conflict in Ukraine has forced policymakers to take a more aggressive approach. For the central bank monetary policy remains focused on achieving ‘full employment’ while maintaining price stability.

With ECB president Christine Lagarde stressing the commitment to tame inflation through additional rate hikes, market participants are now expecting terminal rates to reach 4% by July (currently at 2.75%).

A screenshot of a computer  Description automatically generated with medium confidence

With Eurozone inflation on deck (released 2 March at 10:00 GMT), the repricing of information has supported German yields, pushing the two-yields to their highest levels since 2008.

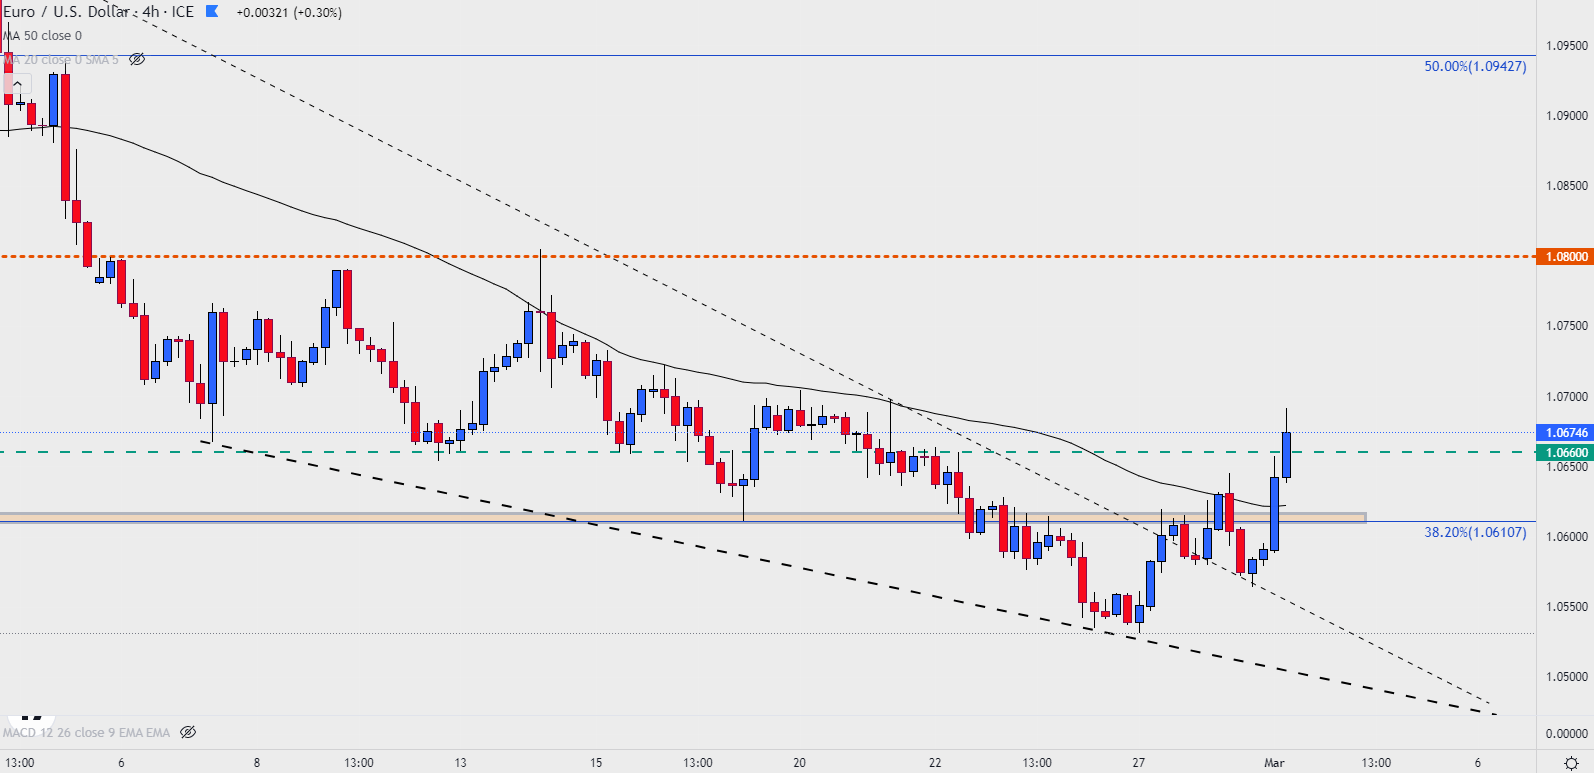
In response to the latest forecasts, EUR/USD has risen, with investors now anticipating that the ECB will remain more hawkish for longer than its Federal Reserve counterpart.

EUR/USD Price Chart

Chart  Description automatically generated

Australian Dollar Dunked After GDP Miss Provides Volatility. Will AUD/USD Go Lower?

Australian Dollar Dunked After GDP Miss Provides Volatility. Will AUD/USD Go Lower?

The Australian Dollar sunk below 67 cents after 4Q quarter-on-quarter GDP came in at 0.5% rather than the 0.8% forecast and against the previous 0.7% that was revised up from 0.6%. The currency recovered later in the day on solid Chinese data.

Annual GDP to the end of December was 2.7% as anticipated reveal more upward revisions to prior quarters. The prior read was 5.9%.


Today’s GDP figures arrive ahead of the Reserve Bank of Australia’s monetary policy meeting next Tuesday. They are anticipated to increase their cash rate target by 25 basis points (bp) to 3.60%. If they do, it will be the tenth hike since the lift-off in May last year.

The latest inflation read is way above the RBA’s target band of 2-3% at 7.8% year-on-year. Today’s data comes on the back of yesterday’s retail sales and current account.


The fourth quarter current account surplus came in at AUD 14.1 billion against AUD 5.5 forecast and the previous print revised up to AUD 0.8 billion from AUD -2.3 billion.

Month-on-month retail sales for January were up 1.9% rather than 1.5% anticipated and -4.0% prior.

The fundamental data points toward mixed signals for the economy but the RBA seem to have little choice but to tighten further in the near term with inflation so rampant.


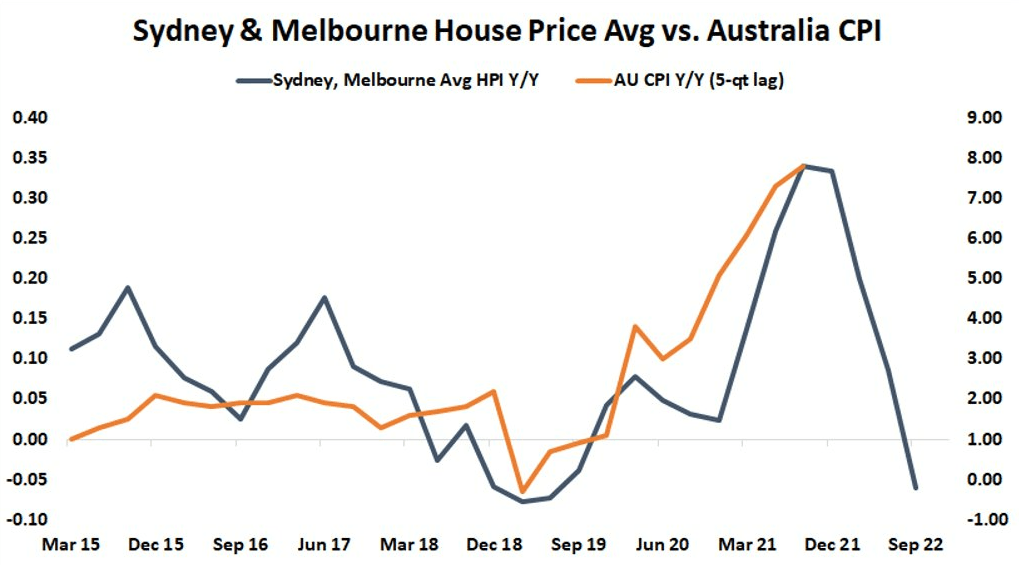
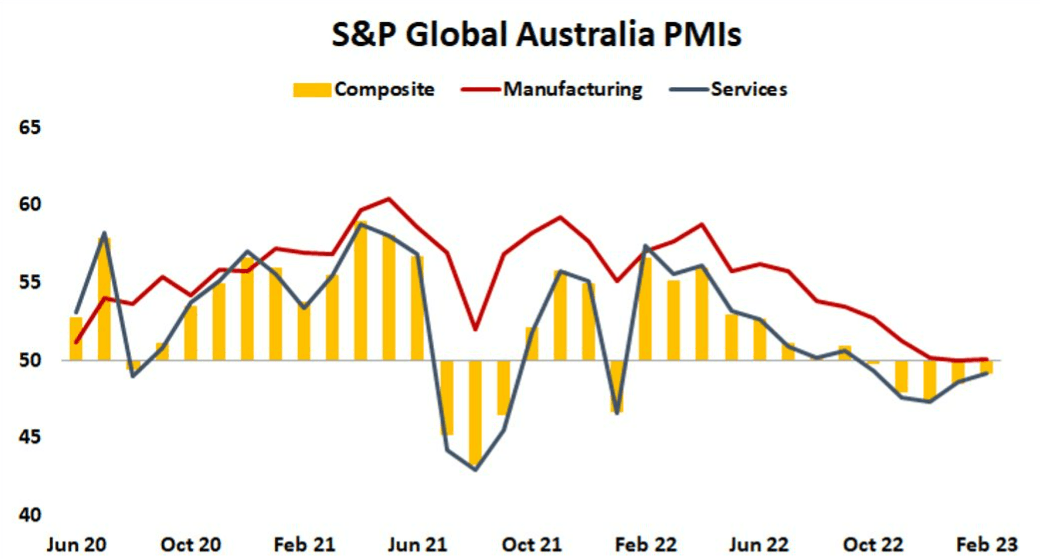
The picture down the track seems to be somewhat opaque with a high degree of uncertainty. Some leading indicators might be a harbinger of the headwinds ahead. Housing prices have continued to slip lower and business sentiment surveys are deteriorating.


image1.png

Source; Bloomberg


image2.png

Source; Bloomberg


Potentially compounding the problem could be the so-called ‘mortgage cliff’ where fixed rate borrowers will be re-adjusting the repayments at over 300 bp higher.


All of this illustrates the tricky road ahead for the RBA. The latest unemployment data showed the labour market loosening a fraction but still relatively tight by historical measures with the unemployment rate at 3.7%. Reining in price pressures at a time of softening aggregate demand might lead to deepening stagflation.


This scenario might be bearish for AUD/USD but in turn, a lower exchange rate may assist the domestic economy, especially if China is able to ignite its growth plans. The upcoming National; People’s Congress (NPC), which starts this weekend, may offer some insights into this prospect.

US Treasury Yields Price Action: Rally is Looking Tired

US Treasury Yields Price Action: Rally is Looking Tired

The recent rally in US Treasury yields is showing signs of fatigue ahead of key US economic data.

Stronger-than-expected US data this month – the Economic Surprise Index is at its highest level since April — has led to a dramatic repricing higher in Fed rate hike expectations on the growing ‘higher-for-longer’ rates view. Rate futures are now pricing in the Fed’s target rate to peak around 5.42% in September from the current 4.50-4.75%, compared with under 5% at the end of January.

US Treasury 30-year yield Daily Chart

image1.png

Despite the most recent beats in US data, especially Friday’s PCE price index data, yields failed to break past key resistance zones. Moreover, recent comments by Fed officials, though hawkish, hasn’t tilted toward last year’s jumbo rate hikes, suggesting that for now, policymakers prefer to stick with the current gradual tightening trajectory as the impact of previous hikes spills over the economy.

US Treasury 10-year yield Daily Chart

image2.png

While the broader trajectory remains up, most recently Treasury yields also seem to be in a wait-and-watch mode – the back-to-back small candlesticks/ doji patterns in recent days on the yield charts suggests the market is looking for further cues – from data or further Fed guidance on rates.

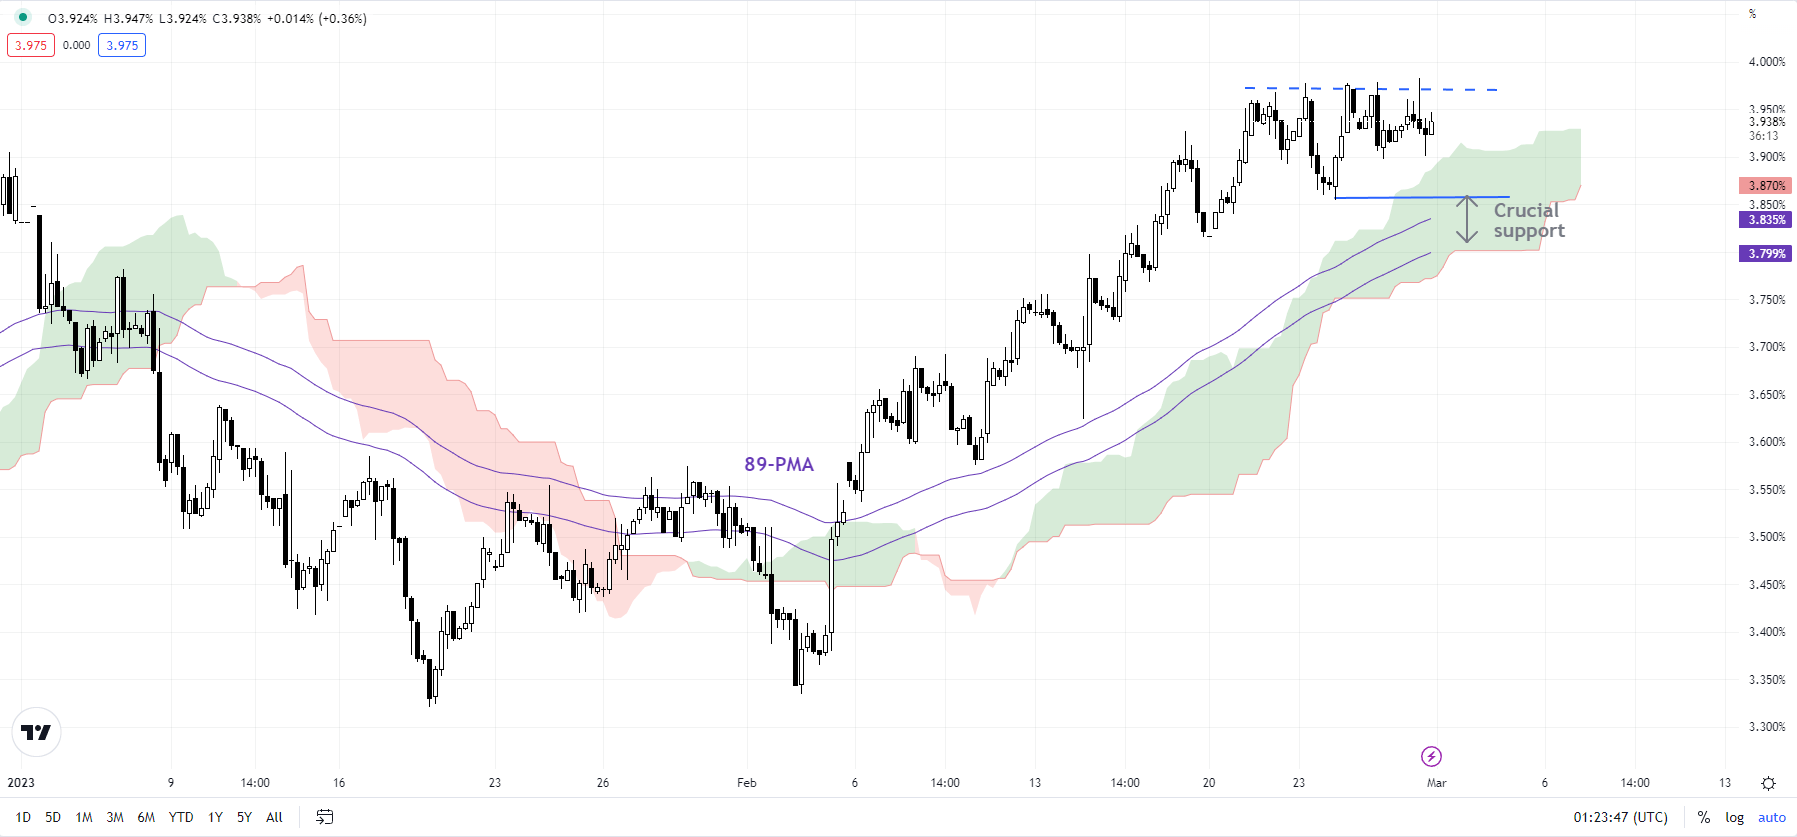
US Treasury 10-year yield 240-minute Chart

image3.png

In this regard, the key focus is now on US ISM Manufacturing and Services PMI data due later today and Friday respectively. US Fed Chair Powell is due to speak tomorrow and Friday at the semi-annual testimony. In his remarks following the upbeat jobs data in early February, he maintained the ‘disinflation’ emphasis and didn’t tilt toward the aggressive side.

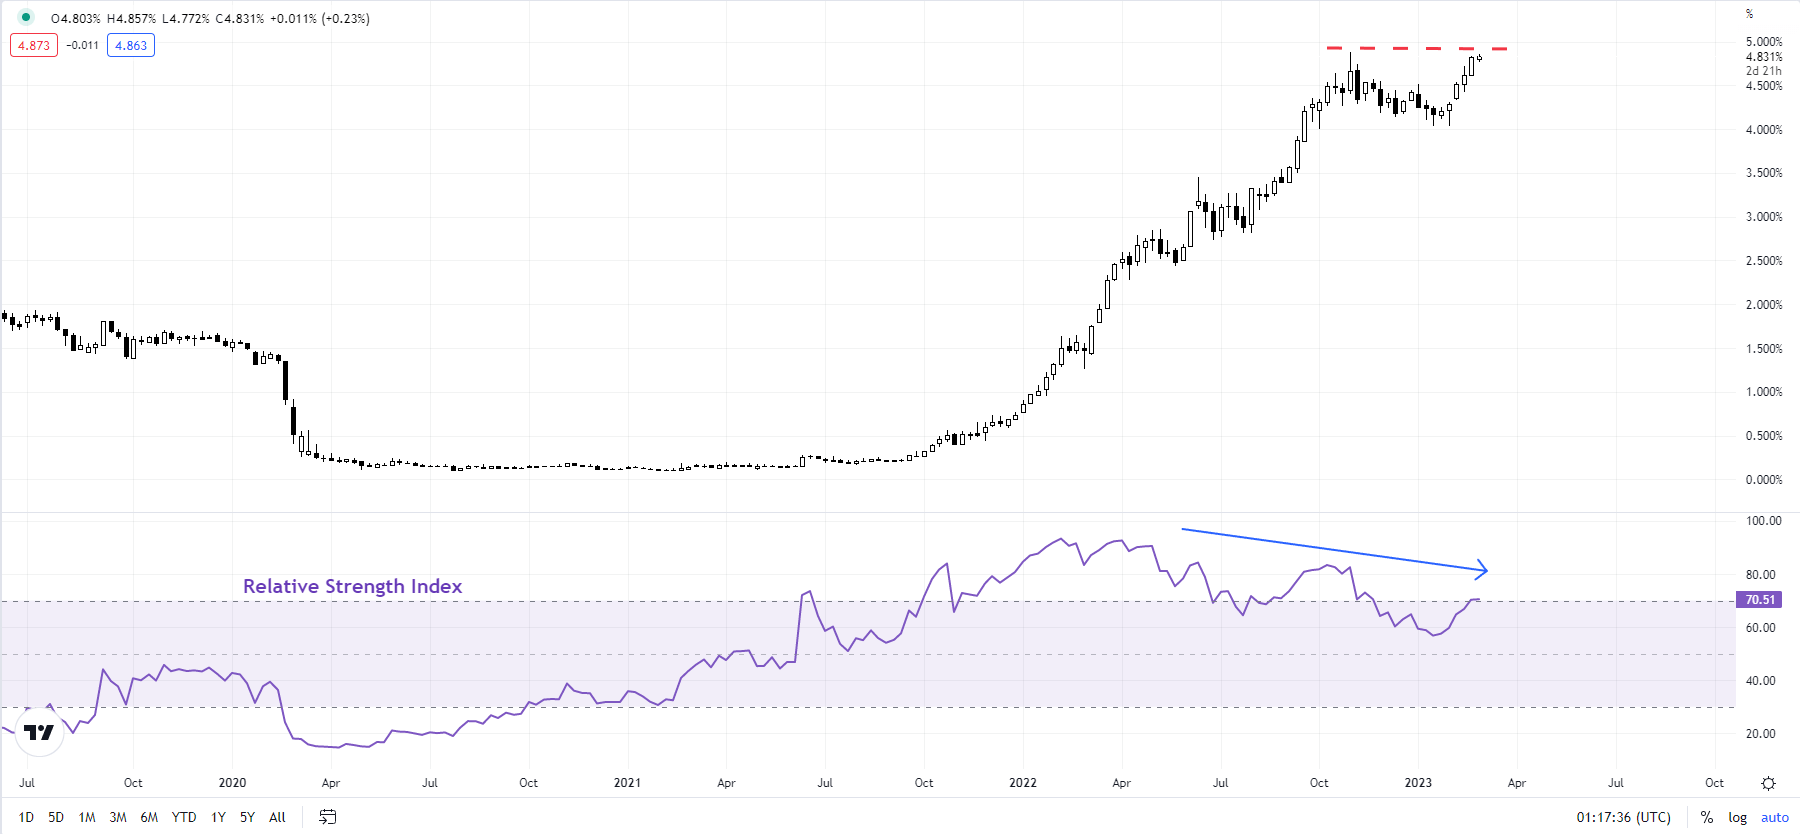
US Treasury 2-year yield Weekly Chart

image4.png

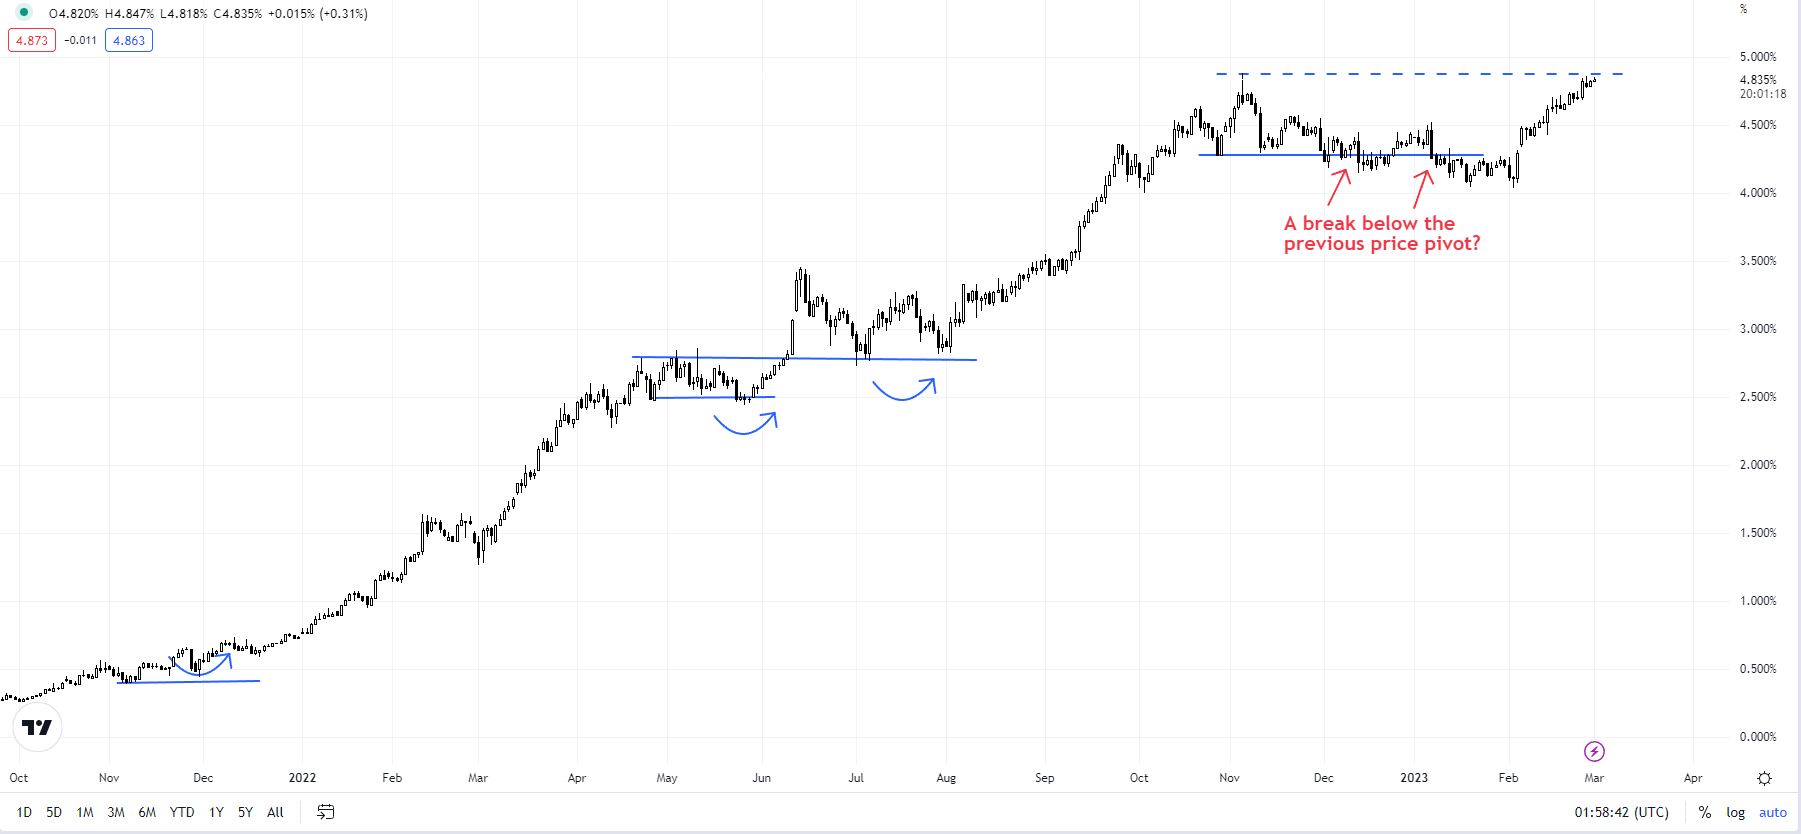
The US Treasury 2-year yield chart is testing a major barrier at the November high of 4.88%. Negative divergence on the weekly charts – higher yields associated with a declining 14-week Relative Strength Index – suggests the yield rally is looking tired. On the daily charts, the yield’s fall at the end of last year below the key price pivot at the end-October low of 4.27% could be a sign that the yield rally is beginning to crack, at least in the interim.

US Treasury 2-year yield Daily Chart

image5.png

The US Treasury 10-year yield and the 30-year yield are flirting with key hurdles at their respective January highs. To be fair, the stalling of the price action could imply a pause before the next leg higher in yields. However, in the absence of a strong bullish (higher yields) catalyst, the path of least resistance appears to be sideways to down. The 10-year yield has a vital cushion at Friday’s low of 3.85% (see 240-minute chart). Any break below would confirm that this month’s upward pressure in yields had faded.

Gross domestic product in the fourth quarter of 2022: Swiss economy stagnates

Gross domestic product in the fourth quarter of 2022: Swiss economy stagnates

Switzerland’s GDP adjusted for sporting events saw no growth in the fourth quarter of 2022 (+0.0%), following a 0.2% increase in the third quarter.1,2 The challenging international environment curbed manufacturing output and also exports. Domestic demand showed robust growth. The global economic slowdown took its toll on manufacturing (−0.3%) in the fourth quarter of 2022. While the less cyclically sensitive chemical and pharmaceutical industry (+1.7%) recorded further growth in value added, the other industrial sectors contracted. This led to lower exports in metals and precision instruments

The leading indicator of the CPI places its annual variation at 6.1%

The leading indicator of the CPI places its annual variation at 6.1%

The estimated annual inflation of the CPI in February 2023 is 6.1%, according to the leading indicator prepared by the INE. This indicator provides a preview of the CPI which, if confirmed, would mean a increase of two tenths in its annual rate, since in the month of January this variation was of 5.9% This evolution is due to the fact that electricity prices rise this month, compared to the decrease registered in February 2022, since food and non-alcoholic beverages increase more than in February last year. Conversely, the drop in the prices of fuels and lubricants stands out, the which increased in February 2022

China urban employment, per capita spending logged rare declines in 2022

China urban employment, per capita spending logged rare declines in 2022

BEIJING: China’s urban employment fell for the first time in six decades last year and per capita spending also marked a rare decline, as harsh COVID-19 curbs ravaged the world’s second-biggest economy.

The new data from the National Bureau of Statistics also showed the smallest income growth in more than three decades.

The number of China’s urban jobs dropped by 8.4 million to 459.31 million, the first drop since 1962.

“The decline of the urban labour force reflects the severe economic challenge China faced last year,” Zhiwei Zhang, president at Pinpoint Asset Management, wrote in a note to clients.

He cited the shrinking size of China’s labour force, job losses due to the pandemic and the deceleration of rural workers migrating to cities as the main reasons for the decline.

Zhang added, however, that he expects this to be a temporary drop now that China has abandoned draconian zero-COVID policies aimed at stamping out every outbreak.

China had economic growth of just 3 per cent in 2022- one of the weakest levels in nearly half a century.

Per capita spending fell 0.2 per cent in real terms, the statistics bureau data showed. That followed a jump of 12.6 per cent in 2021 and marking only the third such decline since records for that data point began in 1980. Retail sales also fell 0.2 per cent, the second worst performance since 1968.

Xu Tianchen, an economist at the Economist Intelligence Unit, said a steep drop in income growth for China’s lowest income earners was a key factor behind the weak spending data.

“Before the pandemic, the lowest income group was one of the fastest growing, but now, quite remarkably, it has become the slowest income group, dropping from 10.1 per cent (income growth) to 5.2 per cent.”

Disposable income per capita in China grew by just 2.9 per cent in real terms, the second smallest rise since 1989.

Unadjusted, disposable income per capita grew to 36,883 yuan (US$5,310) last year, while spending per capita increased to 24,538 yuan.

Rural areas performed better than urbanised zones, with the disposable incomes of rural households growing 4.2 per cent in real terms, compared with 1.9 per cent growth for urban residents.

US Dollar Rand Outlook: USD/ZAR Remains Bullish Above 18.00

US Dollar Rand Outlook: USD/ZAR Remains Bullish Above 18.00

US Dollar Strengthens While the Rand Lacks Clarity – Prices Stall Around 18.200

USD/ZAR is currently hovering around 18.200, finding support above the psychological level of 18.00.

With the emerging market (EM) currency currently on track to achieve six consecutive weeks of gains, the resilient US economy has helped drive the pair lower.

As South Africa continues to suffer from hours of planned electricity outages (known as load shedding), the country has succumbed to the effects of declining productivity.

Although the major power utility Eskom has been granted a $13.9 billion bailout, a strong Dollar and a robust labor market have bolstered demand for the safe-haven greenback. For the volatile Rand, both technical and fundamental factors continue to weigh on price action.

USD/ZAR Technical Analysis

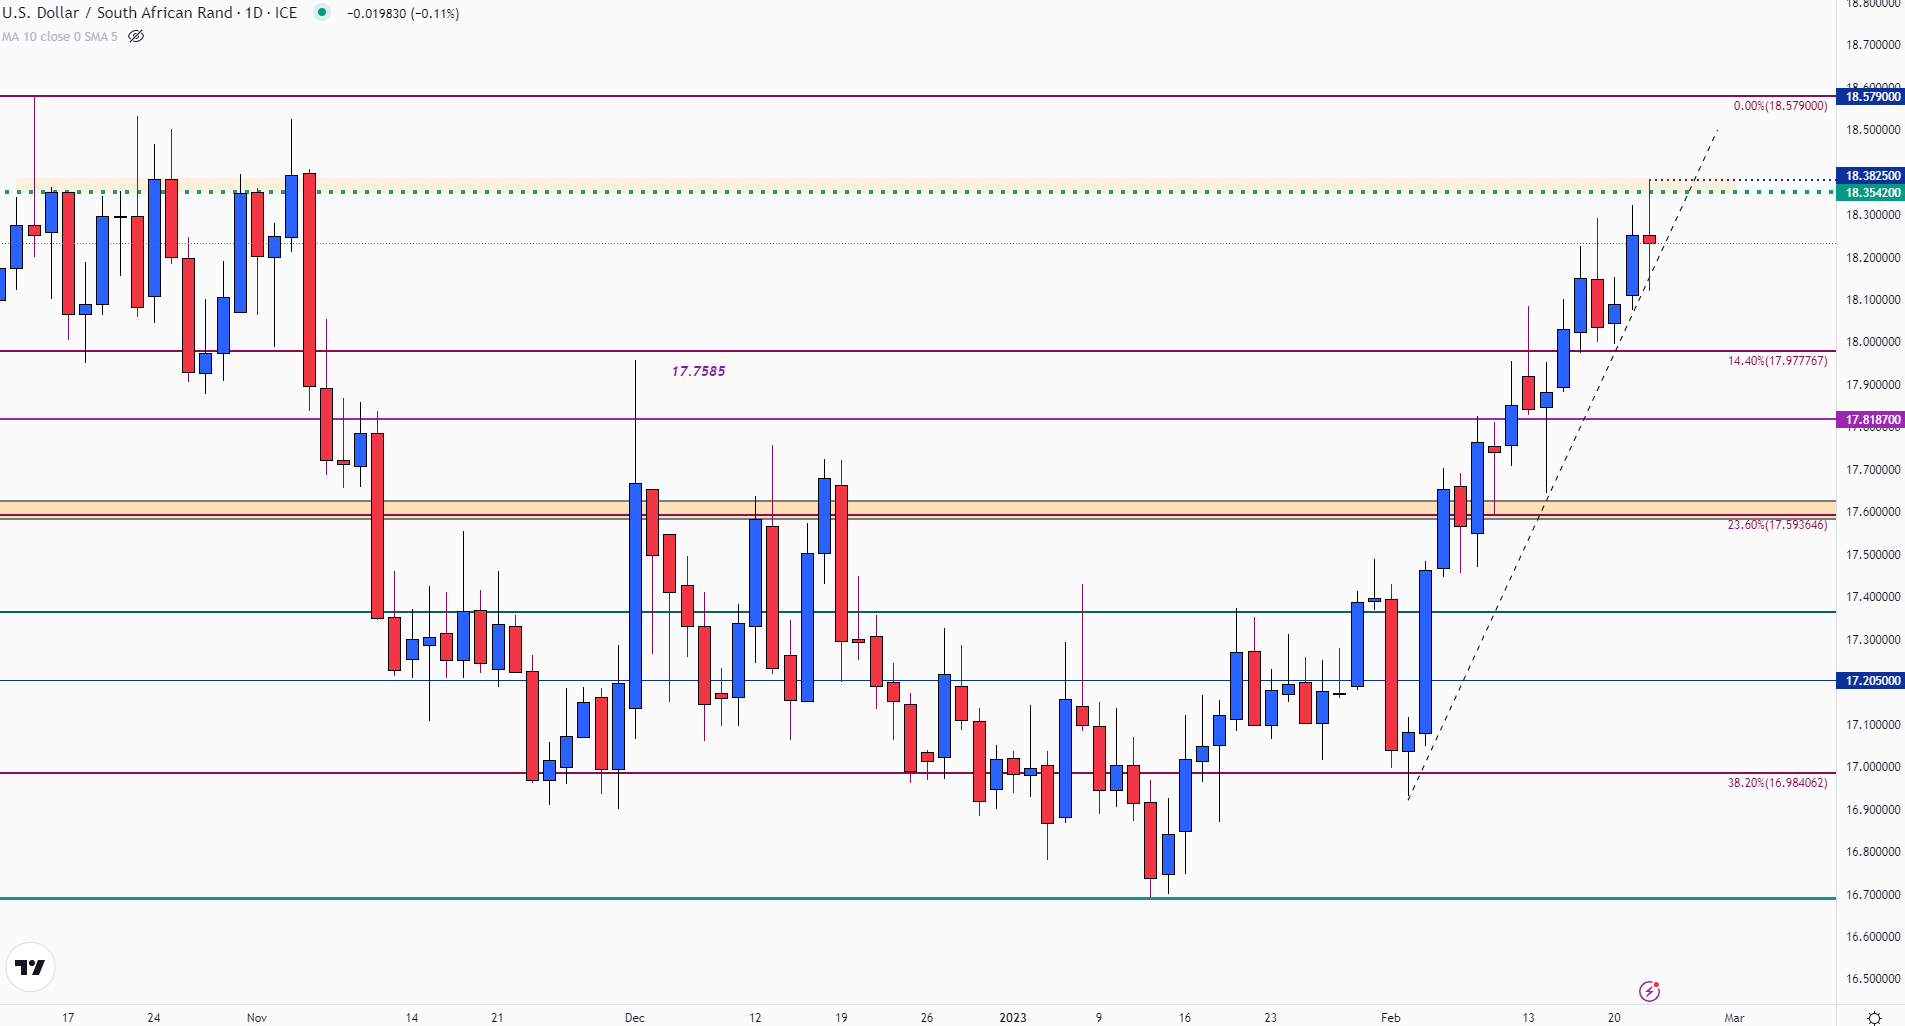
After rising back above 18.00 earlier this month, USD/ZAR has continued to climb toward the October ’22 high, holding as resistance at 18.579. While the pair remains vulnerable to changes in the growth outlook and prospects of higher rates, a shallow-bodied candle has appeared on the daily chart.

USD/ZAR Daily Chart

Chart  Description automatically generatedWith prices currently hovering around 18.200, a move higher could open the door for upside potential. If the Dollar strengthens and the pair holds above 18.400, the October high could remain in sight. As the rising trendline from the current month low remains intact, the pause in today’s price action could be indicative of indecision, suggesting an important zone of technical support and resistance.

Although technical levels suggest that the pair may continue to rise, the 18.00 handle remains key. If South Africa continues to face more power outages, the upside could be supportive of additional gains.

US Dollar Sees Setback on Weak Durable Goods Orders, But DXY Trend Holds Bullish

US Dollar Sees Setback on Weak Durable Goods Orders, But DXY Trend Holds Bullish

Asia-Pacific Market Briefing – US Durable Goods Orders Dent the US Dollar

The US Dollar broadly underperformed against its major counterparts on Monday, with the DXY Dollar Index sinking about 0.6 percent. That was the worst single-day performance since the beginning of this month. Still, as we will see shortly, this pullback did little to overturn the near-term upward bias that the Greenback has been seeing.

A closer look at price action during the Wall Street trading session reveals that the currency took a setback amid the latest US durable goods data. Preliminary January data showed orders falling 4.5%, worse than the -4.0% forecast and a turn from the 5.1% increase in December. This disappointing data added some contrast to recently higher-than-expected US inflationary metrics.

As a result, front-end Treasury yields turn lower. That indicated a slight dovish shift in Federal Reserve policy expectations. Equities also found some support in this data as the S&P 500 rallied. Ultimately, stock markets proceeded to trim all the gains seen after durable goods orders. Still, the S&P 500 finished the session cautiously higher, closing +0.31% for the day.

This is setting a mixed tone heading into Tuesday’s Asia-Pacific trading session. On the one hand, markets could welcome the slight improvement in risk appetite, sending regional indices, such as Japan’s Nikkei 225, higher. On the other hand, traders are also precariously balancing the threat of a US recession which would likely have broader spillovers for the global economy.

US Dollar Technical Analysis

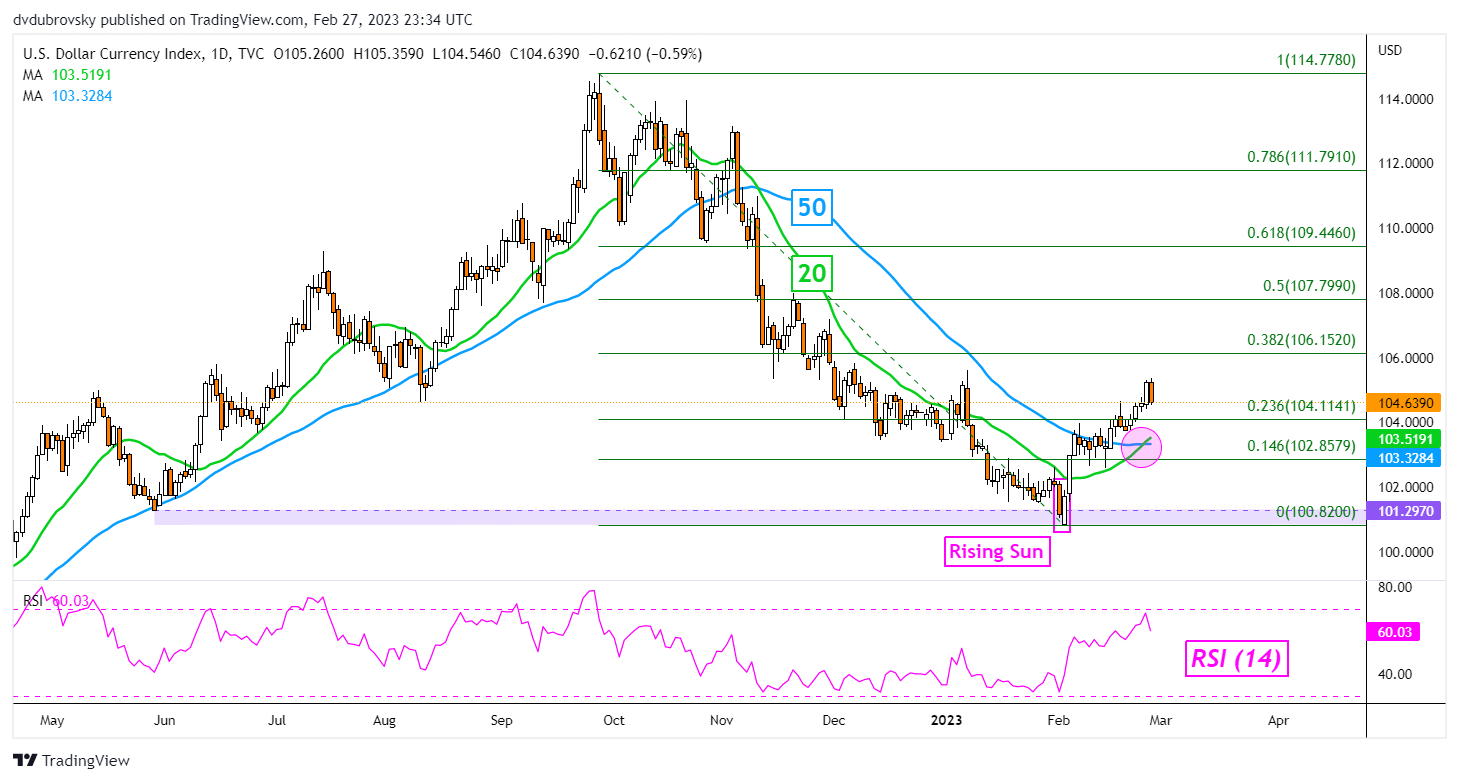
While the DXY Index turned lower on Monday, a bullish Golden Cross between the 20- and 50-day Simple Moving Averages formed recently. This is offering a near-term upside technical bias. Immediate support is the 23.6% Fibonacci retracement level at 104.11. Below that price, the moving averages would likely come into focus, offering the potential to maintain the upside focus. Immediate resistance is the 38.2% level at 106.15.

DXY Daily Chart

DXY Daily Chart