Canadian Dollar Outlook: USD/CAD Price Seeks Breakout Ahead of Canadian GDP

Canadian Dollar Outlook: USD/CAD Price Seeks Breakout Ahead of Canadian GDP

USD/CAD FUNDAMENTAL BACKDROP

The Canadian dollar has been at the mercy of USD dictatorship of recent as the markets continue its hawkish repricing of interest rate guidance for the Federal Reserve. Peak rates for 2023 have now pushed up above 5.4% while money markets forecast no change in the Bank of Canada (BoC)‘s upcoming rate decision. This central bank divergence could weigh negatively on the loonie; however, Fed tightening is very much baked into current pricing and only additional positive US economic data could spur the greenback on even further. Fed officials continue to add to the aggressive monetary policy narrative but this has been the case for some weeks now and markets seem to be reacting lesser to their guidance.

Later today, Canadian GDP (see economic calendar below) is expected to come in lower with the QoQ figure anticipated to be negative. This could heighten recessionary fears in Canada as the first quarter of contractionary growth since Q2 2021. From a US perspective, consumer confidence for February is estimated to come in higher than January and if both sets of data release as expected, the CAD could lose further ground to the USD.

USD/CAD ECONOMIC CALENDAR
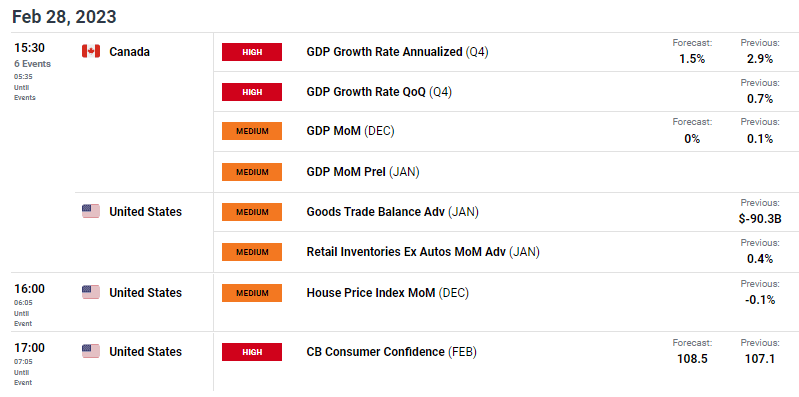
image1.png

TECHNICAL ANALYSIS

USD/CAD DAILY CHART
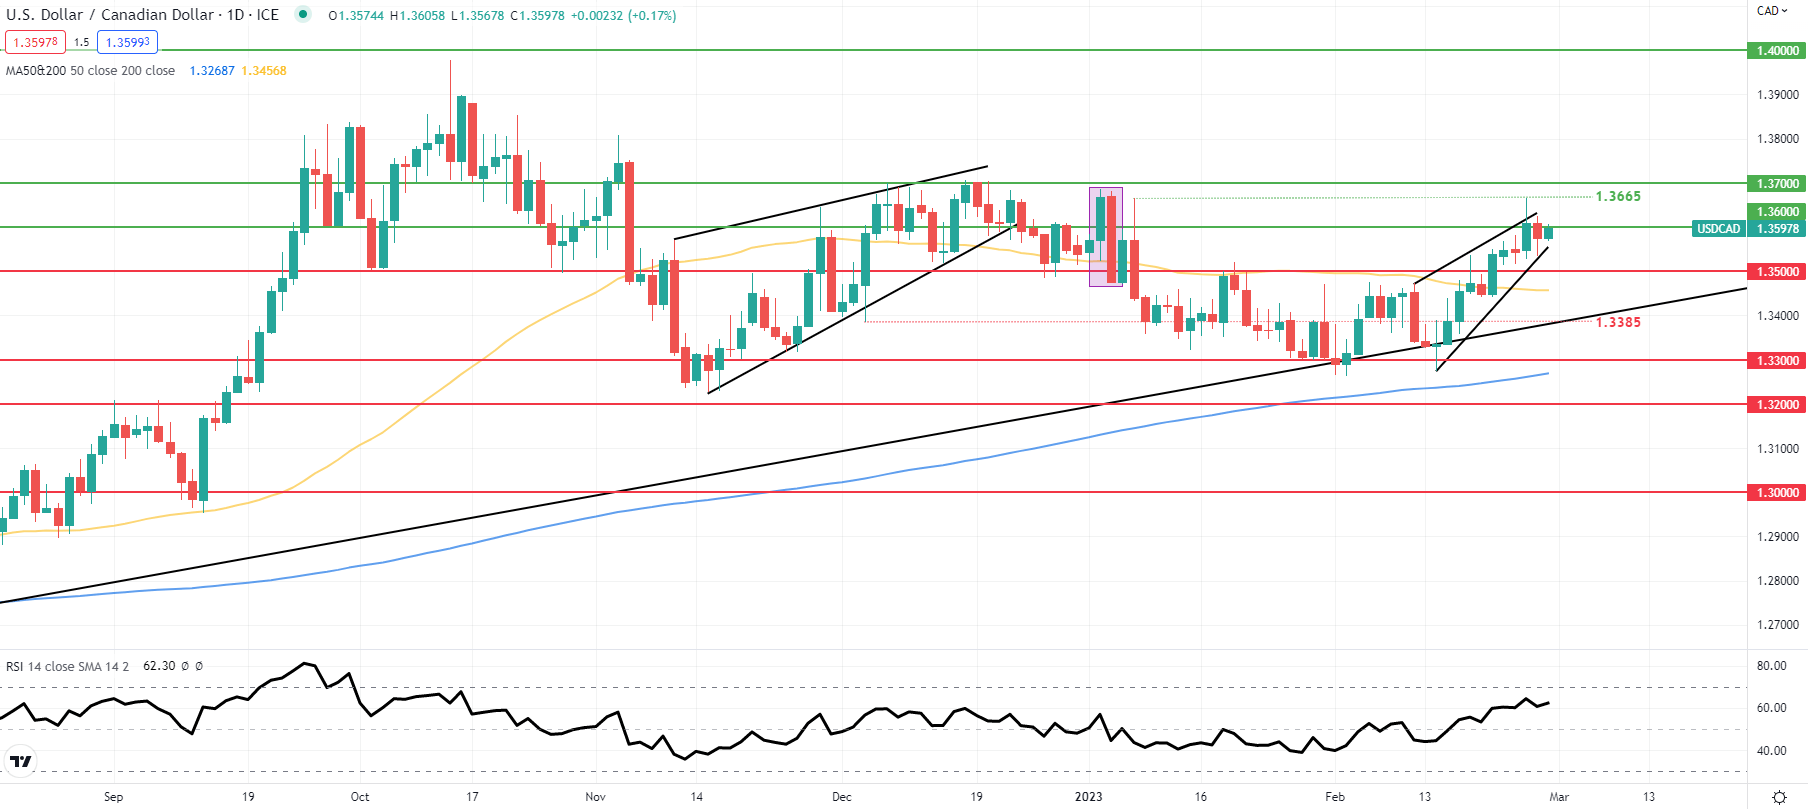
image2.png

USD/CAD price action stays withing the developing rising wedge chart pattern (black) and testing the 1.3600 psychological level. Considering the falling wedge pattern, I would naturally be looking for a push lower confirmed by a break and candle close below wedge support which could expose the 1.3500 handle once more. The Relative Strength Index (RSI) level is nearing overbought territory which could be in support of an impending downside move.

Key resistance levels:

  • 1.3665
  • 1.3600

Key support levels:

  • 1.3500
  • 50-day SMA (yellow)
Natural Gas Price Action Setup: Is This It?

Natural Gas Price Action Setup: Is This It?

The sharp rebound in natural gas in recent days is a sign that bears are getting exhausted. However, it may be premature to assume that the worst is over.

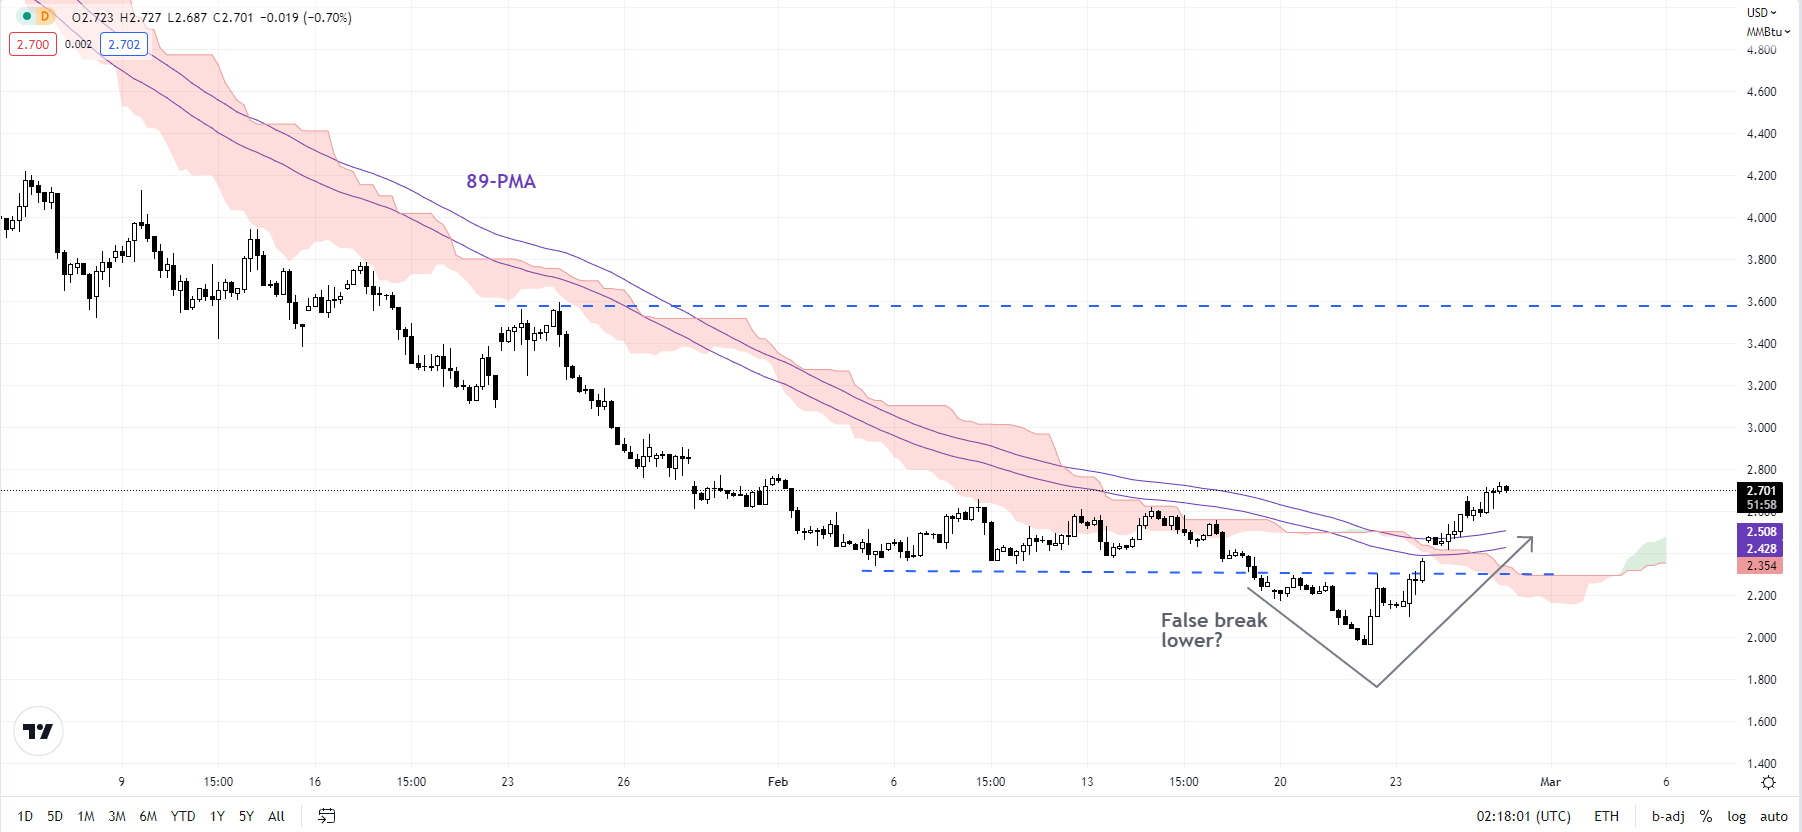
Natural gas fell to a 2.5-year low last week before rebounding 35% over four sessions, raising the prospect that the fall below immediate support at the early-February low of 2.50 was a false break. Given deeply oversold conditions on higher timeframe charts, a short-term consolidation/ minor gains may have started. For more on a big-picture perspective, see “Natural Gas Price Action Setup: Is the Slide Overdone?”, published February 21.

Natural Gas 240-minute Chart

image1.png

The quick turnaround to crack the support-turned-resistance at 2.50 confirms that the downward pressure is beginning to fade for now. Natural gas is now testing crucial resistance at the mid-February high of 2.65. A decisive break above would confirm that the immediate bearish pressure had faded. Subsequent resistance is at the late-January high of 3.60.

Natural Gas Daily Chart

image2.png

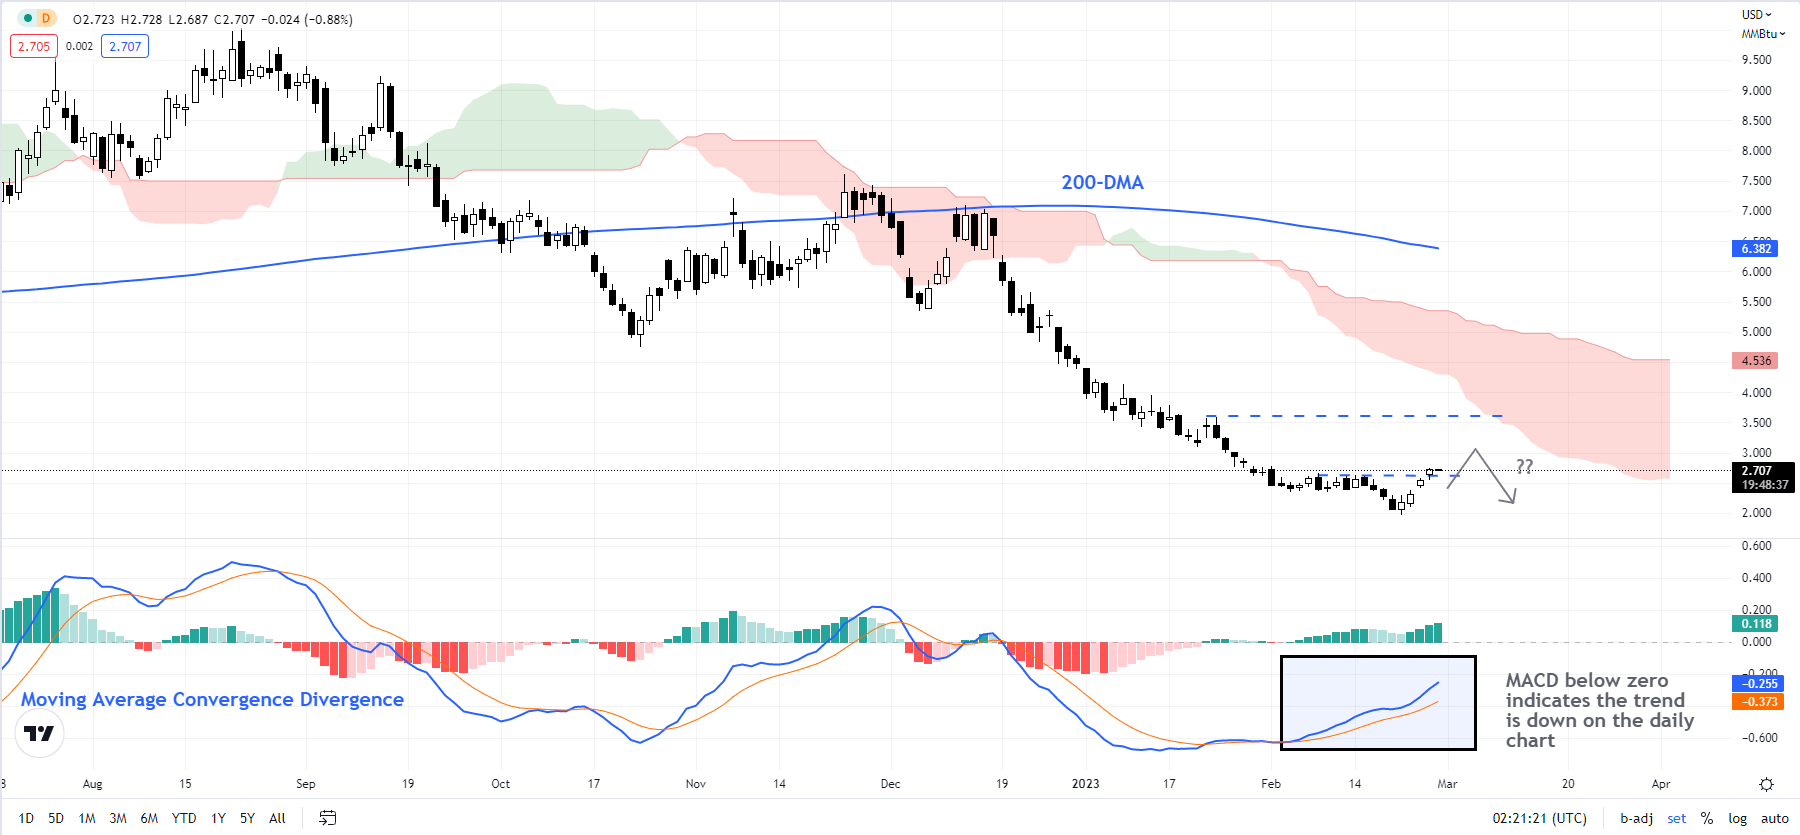
Despite how stretched the downtrend is in terms of the extent and the pace of the fall since late 2022, the jump in recent days could at best be a dead cat bounce. That is, a retest of last week’s low can’t be ruled out. That’s because the damage in recent months could take time to unwind – absent of a ‘V’-shaped rebound, it could turn out to be a prolonged base-building pattern.

However, as highlighted in the previous update, it can’t be denied that slide could be in its advanced stages, especially as natural gas last week nearly hit the strong support at the 2020 low of around 1.45, also the target of a major double-top pattern (the 2022 highs) triggered at the end of last year.

British Pound Holds the Bounce as US Dollar Pauses with Fed Firm on 2% Inflation Goal

British Pound Holds the Bounce as US Dollar Pauses with Fed Firm on 2% Inflation Goal

The British Pound has eased a touch today after solid gains on Monday with the outline of a trade pact that can deal with the Northern Ireland situation.

Referred to as the Windsor Framework, it is designed to allow Northern Ireland smooth access to both the European Union and Great Britain economic zones.

The US Dollar dipped yesterday in line with an easing of Treasury yields and currency markets have had a fairly subdued day so far.

Overnight, Federal Reserve Governor Philip Jefferson said that there is no easy way to get to the 2% inflation target but that the target should remain in place. He highlighted that any change in the target could set a precedent for further opportunistic adjustments.

Hong Kong exports y/y to the end of January were -36.7%, far below the 27.6% forecast. This negative data print was offset to some degree by the lifting of mask-wearing restrictions that had been in place for 945 days.

The Hang Seng Index (HIS) stayed mostly in the green, as did broader Chinese equity indices.

Australia’s ASX 200 also was slightly firmer after strong local data. The fourth quarter current account surplus came in at AUD 14.1 billion against AUD 5.5 billion forecast and the previous print was revised up to AUD 0.8 billion from AUD -2.3 billion.

Month-on-month retail sales for January were up 1.9% rather than 1.5% anticipated and -4.0% prior. AUD/USD was little changed on the news.

Japan’s data was mixed today with retail sales m/m for January being 1.9% higher, beating estimates of 0.4% but industrial production was -4.6% for the same period, below the -2.9% forecast. The Nikkei 225 index is up by a small amount while USD/JPY also hardly moved.

Crude continues to trade within recent ranges with the WTI futures contract near US$ 76 bbl and the Brent contract tracking above US$ `82.50 bbl. Spot gold has also had a quiet day, trading near US$ 1,815 an ounce at the time of going to print.

France and Canada will see GDP figures today and there will be a number of central bank speakers from both sides of the Atlantic crossing the wires.

GBP/USD TECHNICAL ANALYSIS

GBP/USD has been in a 1.1842 – 1.2448 range for 3 months and has bounced off recent lows to start this week.

Support might be at the breakpoint and prior lows in the 1.1900 – 1.1925 area ahead of the previous low of 1.1842.

On the topside, resistance could be at the prior peaks of 1.2148 and 1.2270 ahead of a cluster of highs in the 1.2407 – 1.2448 zone.

image1.png

Gold Prices at Risk Heading into US Consumer Confidence Data, Death Cross Eyed

Gold Prices at Risk Heading into US Consumer Confidence Data, Death Cross Eyed

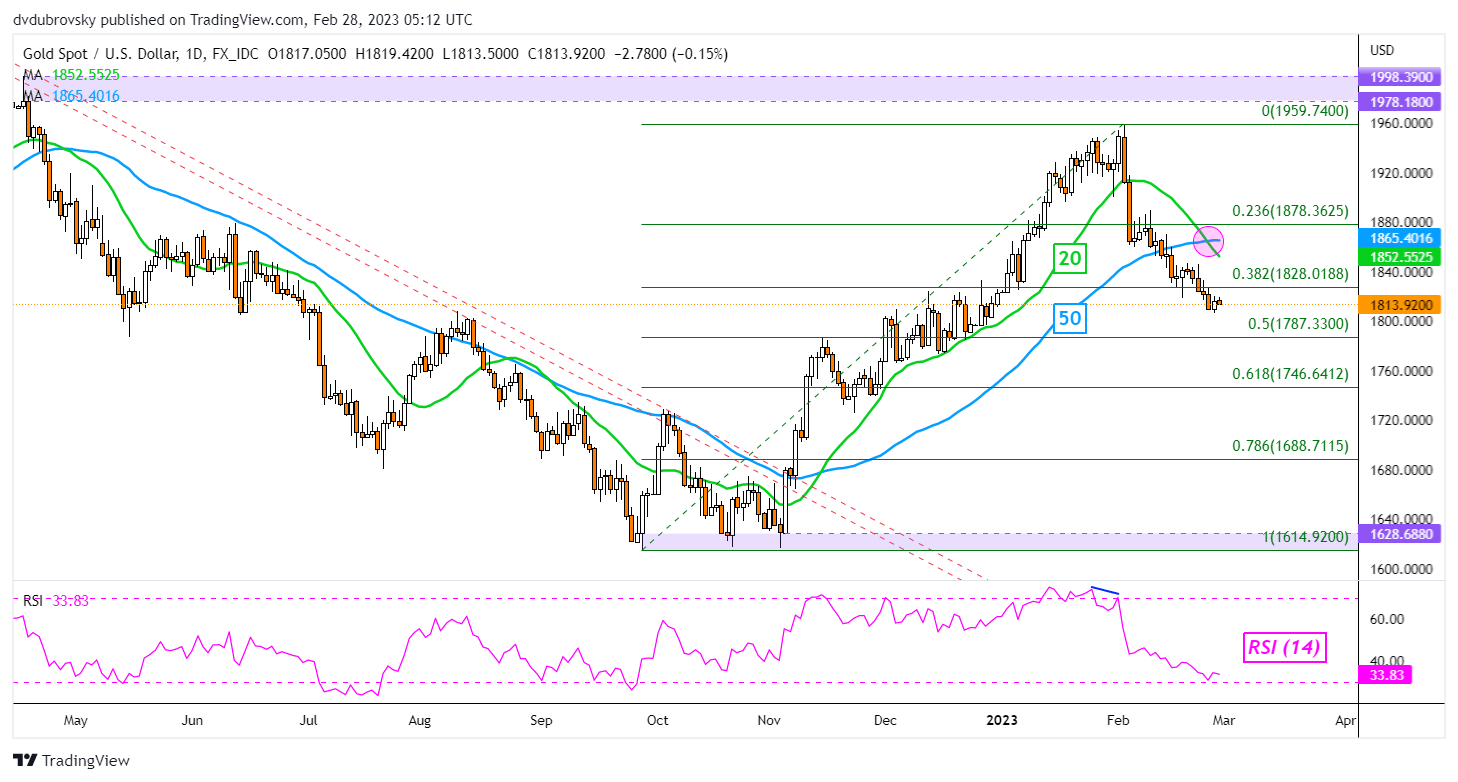
Gold prices aimed cautiously higher on Monday after disappointing US durable goods orders data dented the US Dollar. Front-end Treasury yields aimed lower, hinting that markets cut back on hawkish Federal Reserve policy expectations. The resulting dip in the US Dollar and Treasury yields worked together to bolster anti-fiat gold prices.

This dynamic somewhat reversed course during Tuesday’s Asia-Pacific trading session. While the Nikkei 225 gapped higher at the open, sentiment struggled to continue the cautiously rosy lead from the Wall Street trading session. Japan’s benchmark stock index soon erased most gains heading into the close. The resulting risk aversion boosted the US Dollar, sending gold back lower.

Over the remaining 24 hours, the yellow metal will be eyeing the next round of US Conference Board Consumer Confidence data. A rise to 108.5 for February is expected, which is compared to last month’s 107.1 outcome. Broadly speaking, consumer confidence has been aiming cautiously higher since July 2022, reversing a year-long downtrend from the summer of 2021.

Looking at the Citi Economic Surprise Index tracking the US, the indicator is at 40.40. That represents the highest level since April 2022. Recent gains suggest that economists are being too pessimistic in offering data projections. This is opening the door to an upside surprise in consumer confidence later today. As such, gold is looking vulnerable if this outcome continues supporting a hawkish Fed.

XAU/USD Daily Chart

On the daily chart, gold’s near-term trajectory remains biased lower. Recently, a bearish Death Cross formed between the 20- and 50-day Simple Moving Averages (SMAs), offering a downside trajectory. Immediate support is the midpoint of the Fibonacci retracement level at 1787.33. Meanwhile, resistance is at the 38.2% point at 1828.01. In the event of a broader turn higher, the SMAs could kick in as resistance, maintaining the downward outlook.

XAU/USD Daily Chart

EUR/USD holds key support ahead of Euro area CPI

EUR/USD holds key support ahead of Euro area CPI

The euro’s rebound against the US dollar on Monday from near-strong support could be a sign that the single currency isn’t ripe to break lower ahead of the key Euro area CPI data due later this week.

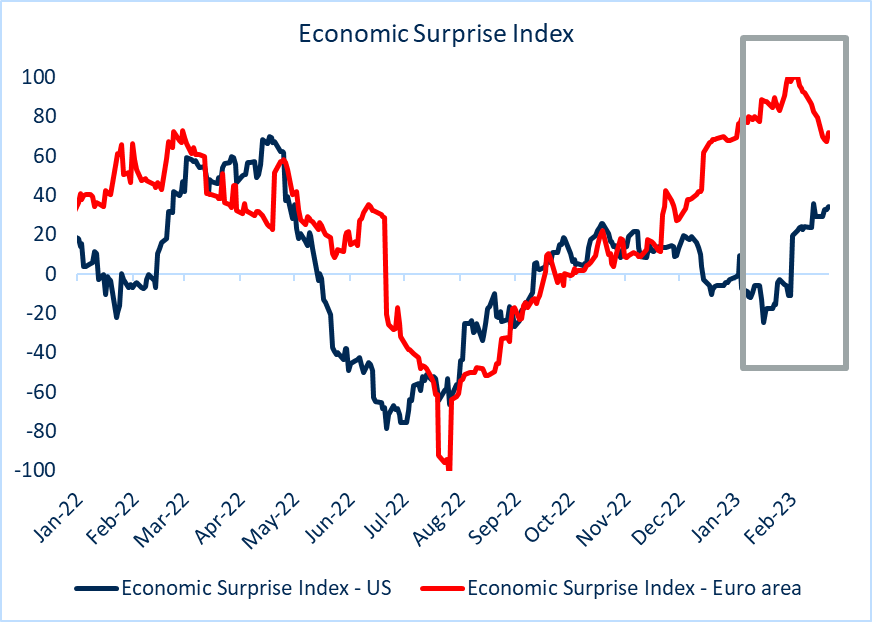
From a macro perspective, the story by and large so far this month has been surprisingly strong US data, as reflected in the jump in the US Economic Surprise Index to a 10-month high (see Economic Surprise Index chart). US Rate futures are now pricing in the Fed’s target rate to peak around 5.40% in September from the current 4.50-4.75%, compared with under 5% at the end of January.Key focus is now on US ISM Manufacturing and Services PMI data due Wednesday and Friday respectively.

Economic Surprise Index Chart

image1.png

In comparison, Euro area data have been less upbeat – the Economic Surprise Index is still in positive territory but retreated since the beginning of February. This week, preliminary February CPI inflation data from Germany (Wednesday) and the Euro area (Thursday) will be closely watched. Ahead of the data, long-term euro zone expectations rose to a new 10-month high on Monday. So far, headline Euro area inflation is easing, but core inflation remains sticky. Rate futures are pricing in around 150 basis points of ECB rate hikes by September, largely unchanged from early February.

EUR/USD Daily Chart

image2.png

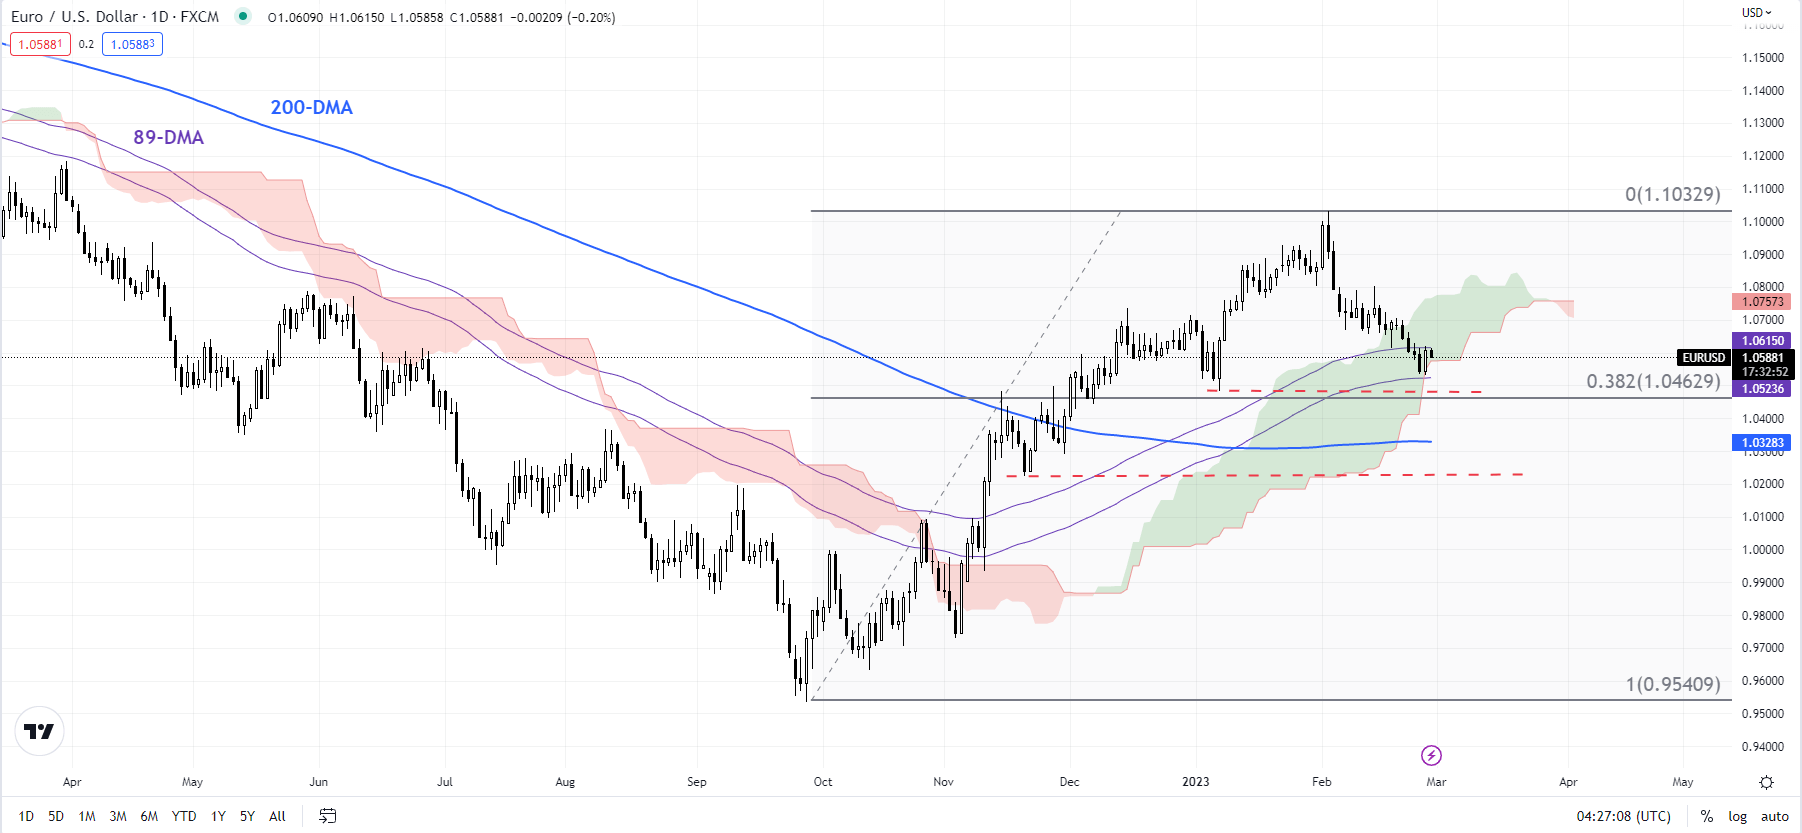
On technical charts, EUR/USD posted a bullish engulfing pattern on the daily candlestick charts on Monday as it nears a fairly strong cushion at the January low of 1.0480, also the price objective of a minor double top (the February 9 and February 14 highs). See “EUR/USD Price Setup: A Bit More Downside Within a Broader Consolidation?”, published February 20.

This support is crucial as any break below could open the way toward the 200-day moving average (now at 1.0330). Importantly, such a break would disrupt the higher-top-higher-bottom pattern since September, that is, a risk to the five-month-long uptrend.

EUR/USD 4-Hour Chart

image3.png

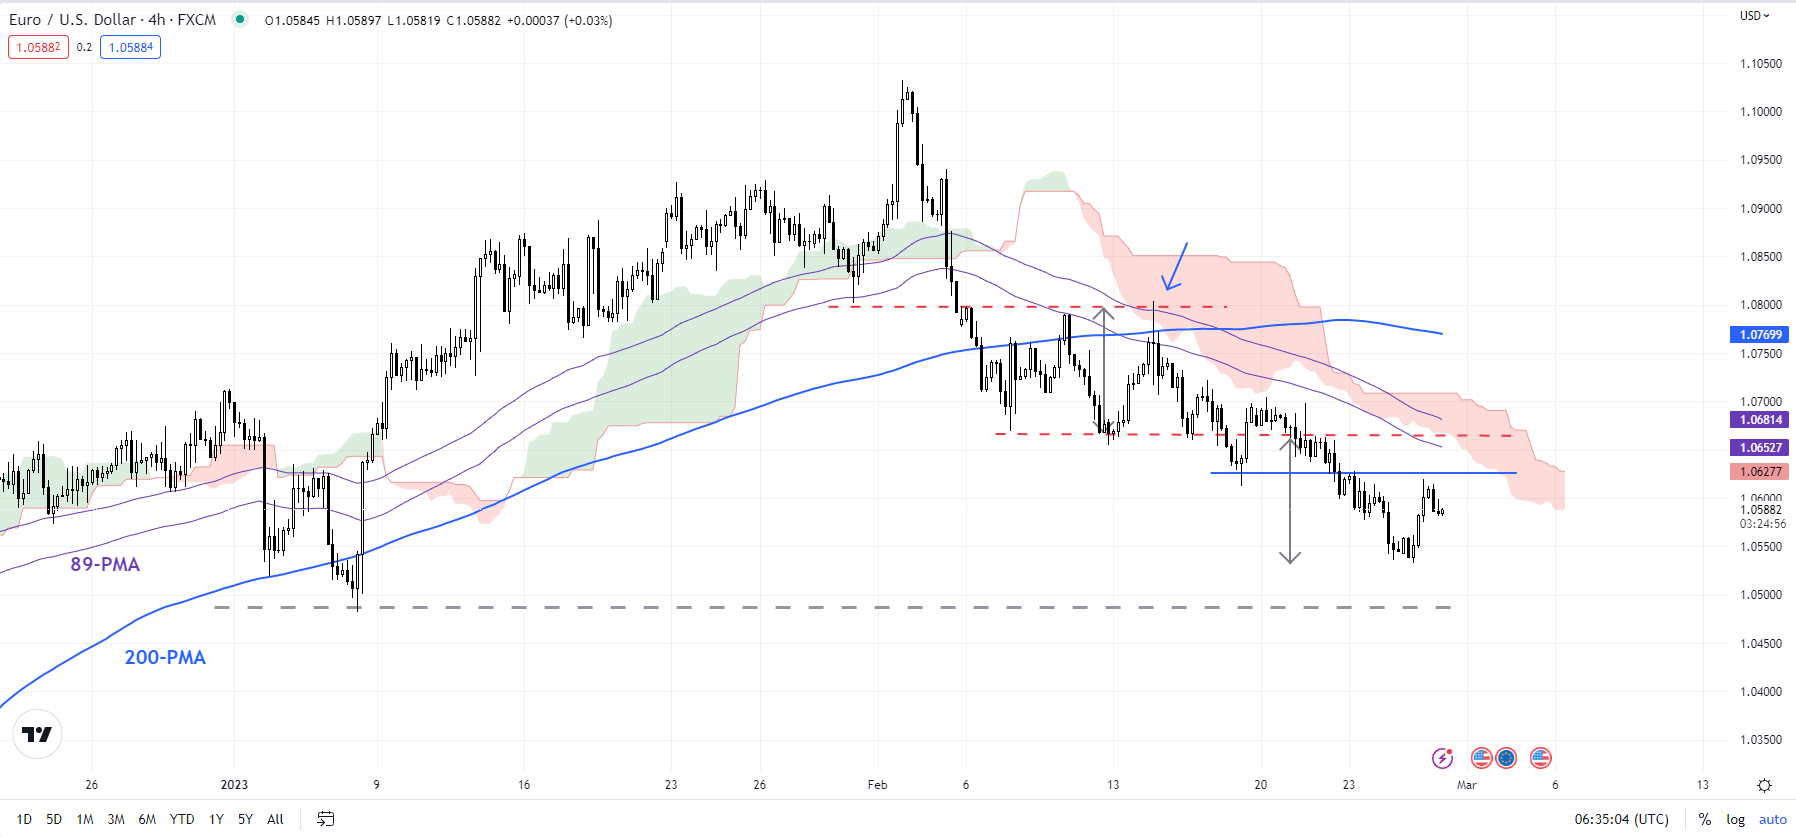
On the other hand, if Monday’s jump is a sign that EUR/USD is searching for a bottom ahead of the inflation data, then the pair needs to break above the immediate ceiling at 1.0625. Such a break would be an early sign that the single currency is in the process of building a base. A strong signal would be a break above the 89-period moving average, around the upper edge of the Ichimoku cloud. A stronger-than-expected CPI print could provide a boost to EUR/USD.

UK and EU on cusp of Northern Ireland Brexit deal but concerns remain

UK and EU on cusp of Northern Ireland Brexit deal but concerns remain

LONDON: Britain is on the cusp of a deal with the European Union to try to ease trade and political disruption in Northern Ireland caused by Brexit, but it is unclear whether it will be enough to satisfy eurosceptic critics.

More than a year of stop-start and sometimes rancorous negotiations between London and Brussels on an overhaul of part of the 2020 EU exit deal look to be coming to a conclusion with Prime Minister Rishi Sunak saying he was “giving it everything” to get a deal done.

“We’re on the cusp, we’ve made great progress, we’re not there yet,” Deputy Prime Minister Dominic Raab told the BBC.

The BBC later reported, citing unnamed sources, that a headline announcement could come on Sunday with details to follow on Monday. Sunak’s office did not confirm those reports.

Sunak is looking to succeed in talks where his predecessors Boris Johnson and Liz Truss failed, but the push comes at the risk of swamping his domestic priorities as he looks to overturn a large opinion poll deficit for his Conservative Party before a national election expected next year.

Even if agreed with Brussels, the announcement of a deal is likely to be only the start.

Key players in Northern Ireland have set a high bar for the kind of deal they would support and Sunak’s own Conservatives are still riddled with the divisions over Brexit that have at times paralysed British politics since the country’s 2016 vote to leave the EU.

As part of its exit agreement, Britain signed an accord with Brussels known as the Northern Ireland protocol to avoid imposing politically contentious checks along the 500-kilometre (310-mile) land border with EU member Ireland.

But the protocol effectively created a border for some goods moving from Britain because it kept Northern Ireland in the EU’s single market for goods.

That has also disrupted the delicate political balance in Northern Ireland, preventing the formation of a power-sharing government set out by a 1998 peace agreement that mostly ended three decades of sectarian violence in the province.

In an interview with the Sunday Times, Sunak said the shooting of a police officer in Northern Ireland last week was a reminder of the fragility of the situation there.

Oil lower on firm US dollar, market shrugs off Russian supply cuts

Oil lower on firm US dollar, market shrugs off Russian supply cuts

Oil prices inched lower in volatile trade on Monday, as a stronger dollar and fears of recession risks offset gains arising from Russia’s plans to deepen oil supply cuts.

West Texas Intermediate US crude futures (WTI) traded at $76.09 a barrel, 23 cents, or 0.3% lower, while Brent crude futures were down 30 cents, or 0.36%, at $82.86 a barrel at 0411 GMT.

Both benchmarks closed more than 90 cents higher on Friday.

The dollar hovered near a seven-week peak on Monday after a slew of strong US economic data reinforced the view that the Federal Reserve will have to raise interest rates further and for longer.

A firm dollar makes commodities priced in the US currency more expensive for holders of other currencies.

“Crude continues to take direction from the sentiment in the broader financial markets,” said Vandana Hari, founder of oil market analysis provider Vanda Insights.

Fears of a hawkish Fed returned to the fore on Friday after the personal consumption expenditures (PCE) price index, shot up 0.6% last month after gaining 0.2% in December. “If risk-aversion continues to grow, crude will likely come under renewed pressure,” said Hari.

Adding to the downside pressure, US crude oil inventories surged to the highest level since May 2021 last week, data from the Energy Information Administration (EIA) showed.

Oil flat on week as US inventories rise but Russia cuts supply

“The EIA data continue to raise more questions instead of providing clarity on markets,” analysts at the consultancy Energy Aspects said in a note, referring to the steep supply adjustment in the data that contributed to the build.

On supply side, Russia plans to cut oil exports from its western ports by up to 25% in March versus February, exceeding its previously announced production cuts of 5% of its output during the month.

Oil prices have fallen by about a sixth in the year since Feb. 24, 2022, when Russian troops first marched into Ukraine. Russia halted supplies of oil to Poland via the Druzhba pipeline, the chief executive of Polish refiner PKN Orlen said on Saturday, a day after Poland delivered its first Leopard tanks to Ukraine.

Two weeks after the invasion, prices surged to a record high of nearly $128 a barrel over supply concerns but have since cooled over fears of a global economic slowdown. Separately, investors are bracing for China’s manufacturing surveys this week for a clear direction on oil demand.

China is holding its annual parliamentary meeting from this weekend and will see new economic policy targets and policies.

“We expect the government to reiterate the priority of supporting growth and call for more policy support,” Ning Zhang, senior China economist at UBS Investment Bank, said in a note.

Gold Price Fundamental Forecast: XAU/USD Under Pressure From Raging Dollar

Gold Price Fundamental Forecast: XAU/USD Under Pressure From Raging Dollar

XAU/USD FUNDAMENTAL BACKDROP

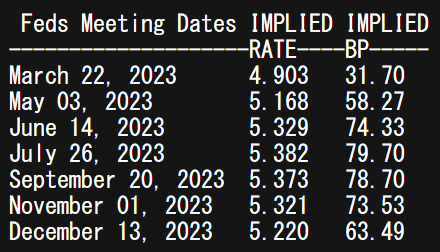
Gold prices continue to be decimated by a rallying USD after US core PCE data left XAU/USD floundering. Inflation and more specifically core inflation has been plaguing gold prices of recent due to a hawkish repricing of Fed rate hikes which now stand at a 5.382% peak rate in 2023. “Sticky” inflation has been raising the probability of a 50bps increment for March; however, consensus remains at 25bps for now (see table below).

FEDERAL RESERVE INTEREST RATE PROBABILITIES

image1.png

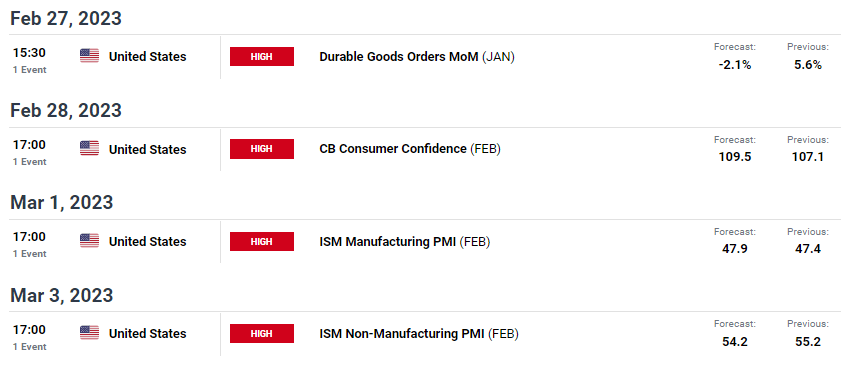
The week ahead looks to be skewed towards USD downside via the durable goods orders and ISM services PMI data which are expected to come in lower than the prior release. Durable goods which popped higher on the back of Boeing orders in December are naturally anticipated to fall while the ISM non-manufacturing PMI for February is expected to follow a similar trend. The services read carries more weigh in the US over the manufacturing statistic as the US is primarily a services driven economy.

ECONOMIC CALENDAR

image2.png

TECHNICAL ANALYSIS

GOLD PRICE DAILY CHART

image3.png

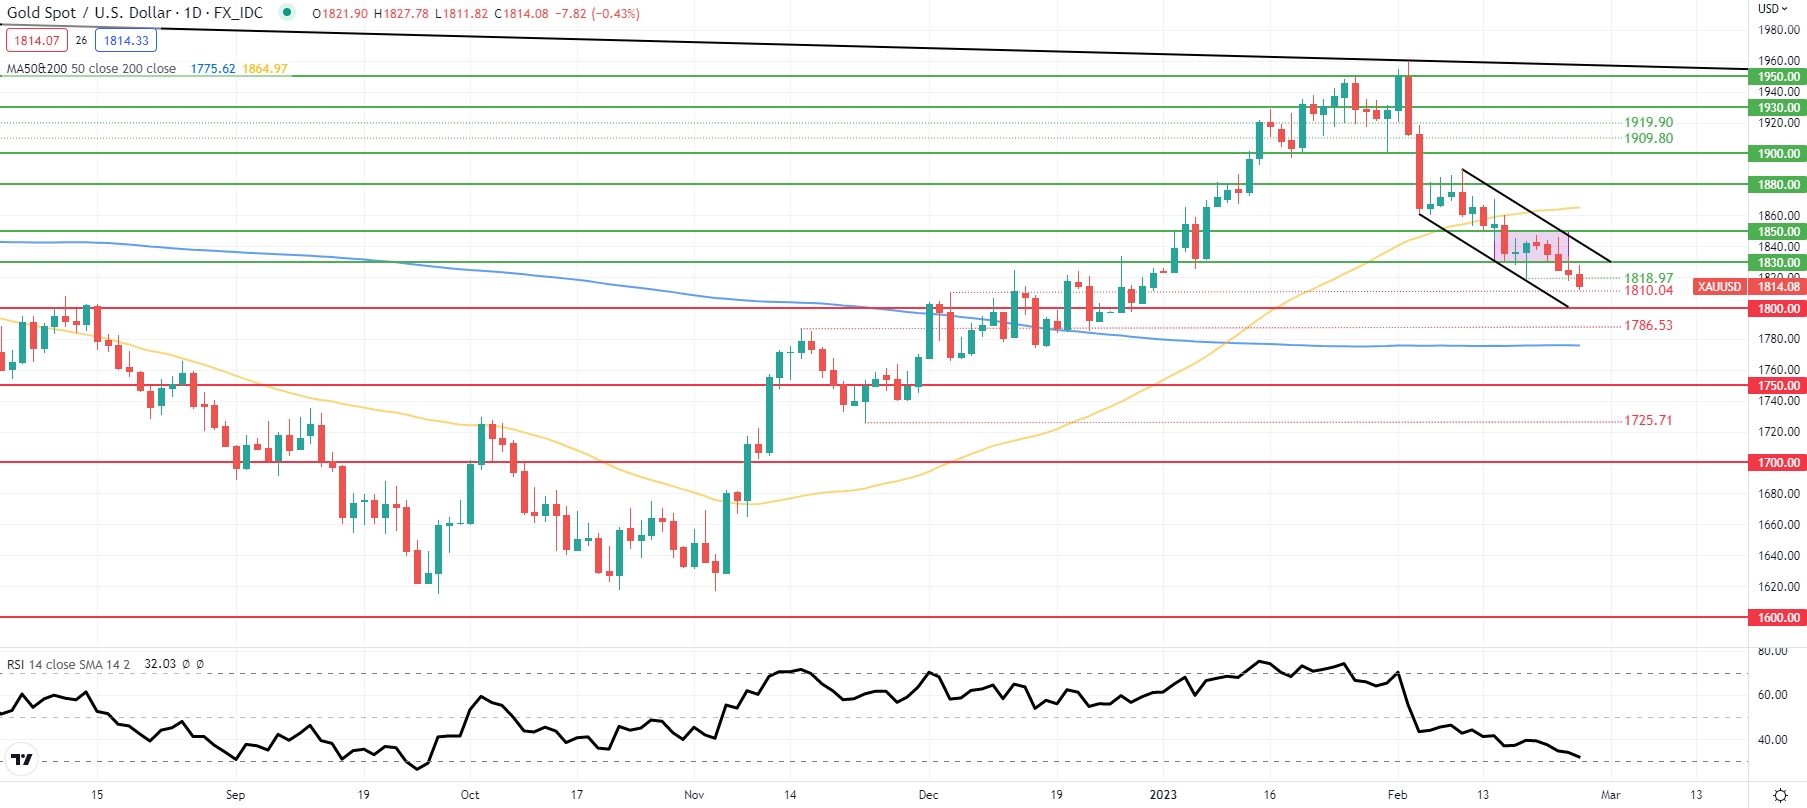
Daily XAU/USD price action continued to trade within the short-term descending channel (black) looking towards the 1800.00 psychological support handle. A move lower could push the Relative Strength Index (RSI) into oversold territory but may see bulls defend around this zone as the dollar rally seems to be losing steam. Higher for longer seems to be baked into market pricing now which does not leave much room for an extended and sustained dollar move unless US data continues to surprise to the upside.

Resistance levels:

  • 1830.00/Descending channel resistance
  • 1818.97

Support levels:

  • 1810.04
  • 1800.00
  • Descending channel support
Markets Week Ahead: Dow Jones, S&P 500, US Dollar, Gold, USD/CAD, AUD/USD, GDP

Markets Week Ahead: Dow Jones, S&P 500, US Dollar, Gold, USD/CAD, AUD/USD, GDP

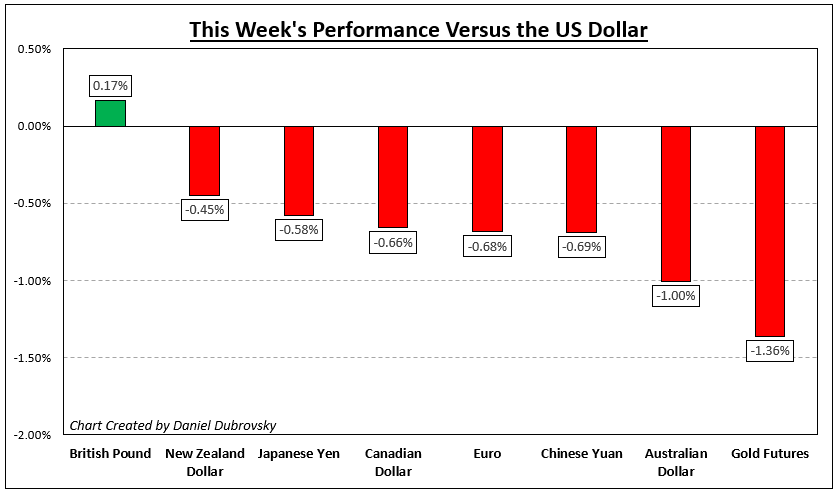
Global market sentiment deteriorated this past week, setting traders up for volatility moving forward. On Wall Street, the Dow Jones, S&P 500 and Nasdaq 100 fell 2.61%, 2.94%, and 3.89%, respectively. Across the Atlantic, the FTSE 100 and DAX 40 sank 1.57% and 1.76%, respectively. Japan’s Nikkei 225 and Hong Kong’s Hang Seng Index fell 0.88% and 3.43%, respectively.

Counter to the stock market, the US 2-year Treasury yield soared to 4.82%, marking the highest confirmed close since 2007. On Friday, the US PCE Core Deflator crossed the wires higher across the board, pushing up hawkish Federal Reserve monetary policy expectations amid fears of stickier prices amid historically low unemployment.

Taking a closer look at market pricing, implied policy bets show that so far this month, traders have added at least 2 rate hikes to the outlook, with markets increasingly looking at a third. This is a recipe for volatility going forward as bets of a pivot continue fading.

As a result, the US Dollar rallied across the board. It strongly performed against the Australian Dollar, Chinese Yuan and Euro. Anti-fiat gold prices also took a thrashing, with XAU/USD sinking 1.73% last week. Gold is shaping up for a 6.14% drop this month. That would be the worst decline over such a period since June 2021.

What should traders be watching going forward? From the US, we have ISM manufacturing and non-manufacturing PMI data due. For USD/CAD and AUD/USD, all eyes are on Canadian and Australian fourth-quarter GDP data, respectively. China will also release the latest official manufacturing PMI figures. What else is in store for markets in the week ahead?

How Markets Performed – Week of 2/20

How Markets Performed – Week of 2/20

Natural Gas Price Weekly Forecast: Have Prices Finally Found a Floor?

Natural Gas Price Weekly Forecast: Have Prices Finally Found a Floor?

Weekly Chart – Best Week Since October

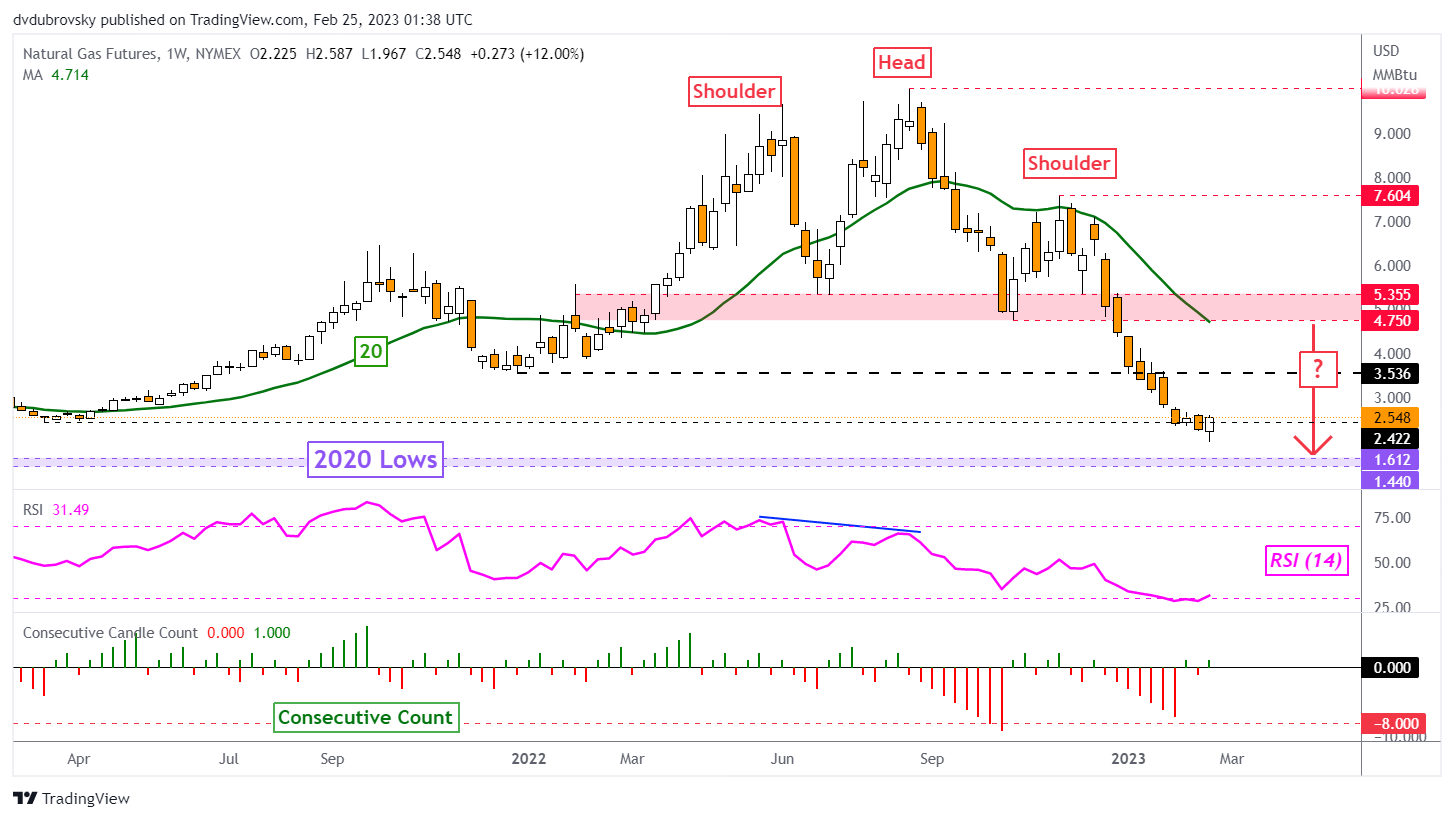
Natural gas prices rallied an impressive 12 percent last week. It is impressive because you must look at it within the context of persistent losses since August 2022. This was the best 5-day performance since October last year. The broader downside technical bias remains, and the bearish trajectory of a Head & Shoulders chart formation is still in focus. Still, given the bullish performance of late, are prices setting up for a broader reversal? If that happens, could it be enough to overturn the downside bias?

Weekly Chart – Best Week Since October

Daily Chart – First Close Above the 20-Day SMA Since December

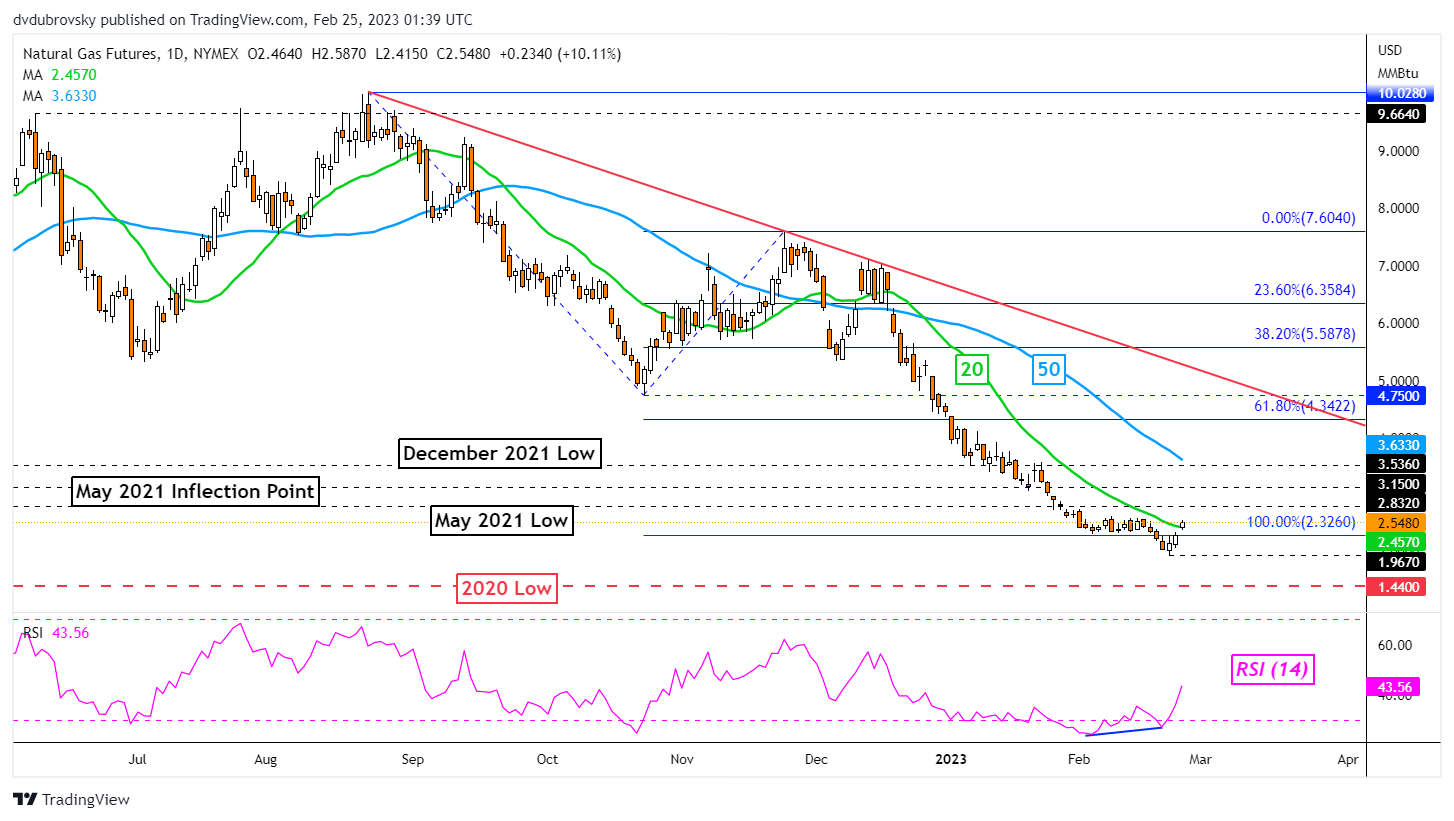
On the daily chart, natural gas prices turned higher after persistent positive RSI divergence since the beginning of this month. This was a sign of fading downside momentum which can at times precede a turn higher. Prices were unable to hold a close under the 100% Fibonacci extension level at 2.326 after a low was established at 1.967.

Natural gas subsequently turned higher and managed to close above the 20-day Simple Moving Average (SMA). This is significant because we have not had a close above this SMA since December 16th. Confirmation is lacking at the time of publishing. Further upside gains could open the door to extending gains toward the 50-day SMA. The latter could hold as resistance, maintaining the downside bias.

Daily Chart – First Close Above the 20-Day SMA Since December

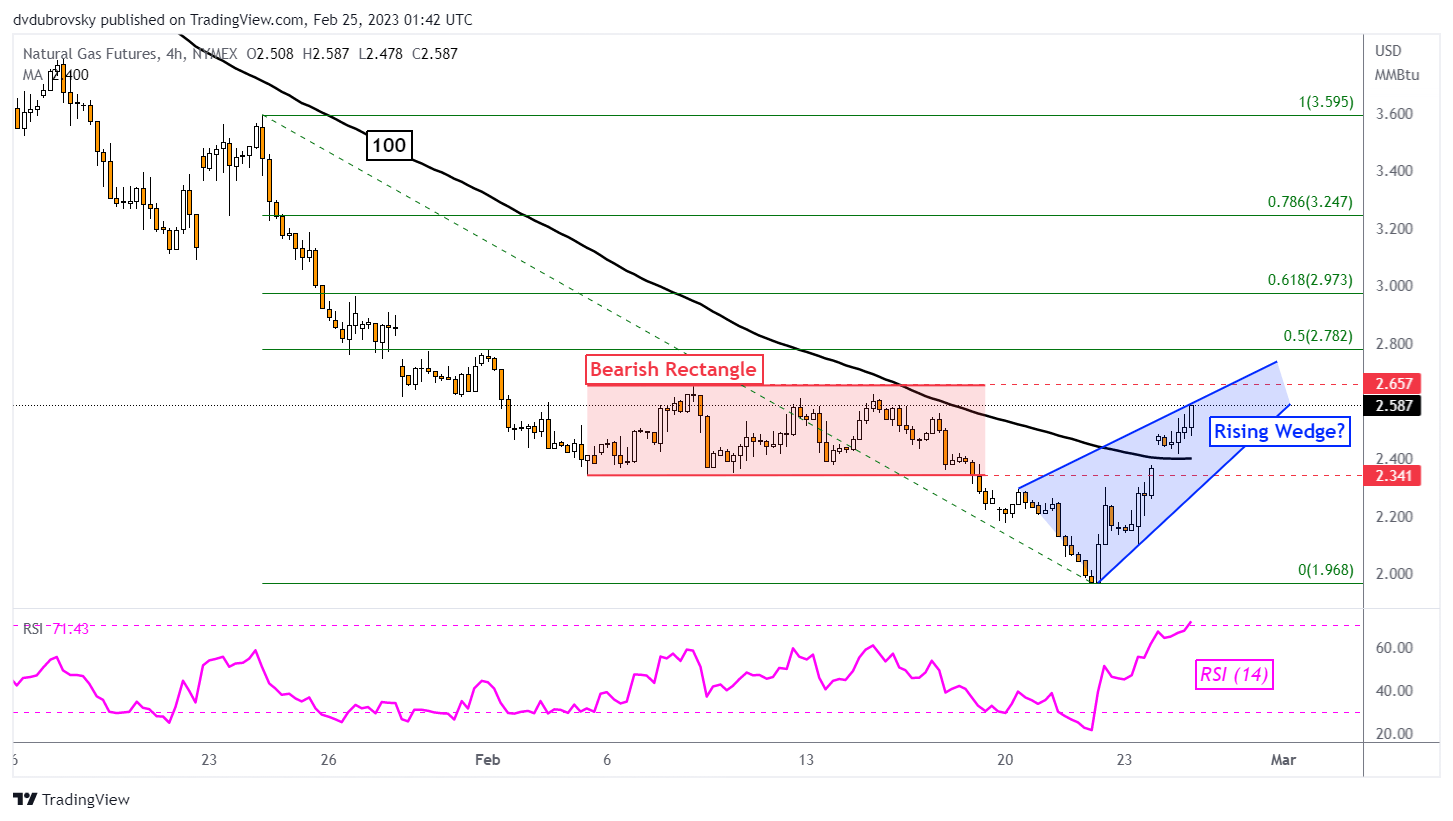
4-Hour Chart – Bearish Rising Wedge Brewing?

Zooming in more on the 4-hour chart shows that prices are trading back in the former range of a bearish rectangle from earlier this month. The lower and upper boundaries are at 2.341 and 2.657, respectively. A closer look reveals that there seems to be a bearish Rising Wedge brewing of late. This could offer an immediate upside bias.

On this timeframe, natural gas has also broken above the 100-day SMA, opening the door to extending upward. With that in mind, while the broader outlook remains bearish, there is an increasing case for a more neutral setting in the week ahead. Depending on how that goes, the picture for natural gas could be starting to change.

4-Hour Chart – Bearish Rising Wedge Brewing?