Japan’s Trade Deficit Smashes Record Amid Global Slowdown

Japan’s Trade Deficit Smashes Record Amid Global Slowdown

Japan’s trade deficit surged to a record in January, as one-off factors including the lunar new year holidays dragged on exports amid a backdrop of a slowing global economy.

The trade gap jumped to ¥3.5 trillion ($26.1 billion) from ¥1.45 trillion in December, topping ¥3 trillion for the first time in comparable data going back the late 1970s, the finance ministry reported Thursday. The deficit far exceeded the previous record, although it was smaller than analysts’ estimates.

Export growth slowed sharply to 3.5%, with chip-making equipment among the largest drags, in a sign of weakening global tech-sector demand. The value of shipments to China sank 17.1%, dragged down by cars, auto parts and chip machinery. Exports to the US and Europe also grew at a weaker pace of 10.2% and 9.5% respectively.

Imports meanwhile continued to show double-digit gains with a 17.8% increase from a year ago, as costly energy shipments continued to inflate the import bill. Japanese firms also likely tried to secure inventory from China before lunar new year celebrations.

The record deficit casts a cloud over Japan’s economy, as it struggles for recovery momentum with a new Bank of Japan governor set to take over from Haruhiko Kuroda and his decade of monetary easing. While one-off factors contributed to the deficit, the government and the central bank will need to keep a close eye on how much growth is slowing abroad.

“Japan’s exports are unlikely to show a strong pickup so the overall economy will probably continue to have a lackluster recovery,” said Takeshi Minami, chief economist at Norinchukin Research Institute. “That will be a headache for the BOJ when they consider normalization.”

China’s sudden turnaround on its virus policy has also meant a hit to Japan’s exports, as Covid cases surged following the end of China’s Covid-Zero policy, causing disruption across the country. Shipments to China and other Asian countries account for more than 50% of Japan’s overall exports.

What Bloomberg Economics Says…

“Looking ahead, we expect the trade deficit to narrow sharply in February, driven by a year-on-year jump in exports. The average of the shortfalls in January and February, though, will probably be on par with the deficit in December 2022.”

— Yuki Masujima, economist

For the full report, click here

The data also showed that the average exchange rate last month was 132.08 yen to the dollar, 15% weaker than a year earlier. Although the weaker yen and higher oil prices — the two main factors behind the prolonged trade deficit — have faded compared to last year’s peak, their effects still appear to be lingering.

Another round of expanding import bills may trigger further price hikes. Nationwide inflation reached a 41-year high in December, as companies, especially food manufacturers, passed higher costs onto their products. Accelerating inflation has eaten into consumers’ purchasing power, a trend reflected in household spending’s second straight month of declines in December.

“What’s not certain is how quickly the deficit will shrink as the global economy is expected to slow further from here,” said Norinchukin’s Minami. “There’s less pessimism emerging over the global economic outlook, but I would say the effect of a rapid tighteing by central banks will hit harder in the coming months.”

Dollar Breaks Higher While Dow Holds its Range: Which Move Metabolizes?

Dollar Breaks Higher While Dow Holds its Range: Which Move Metabolizes?

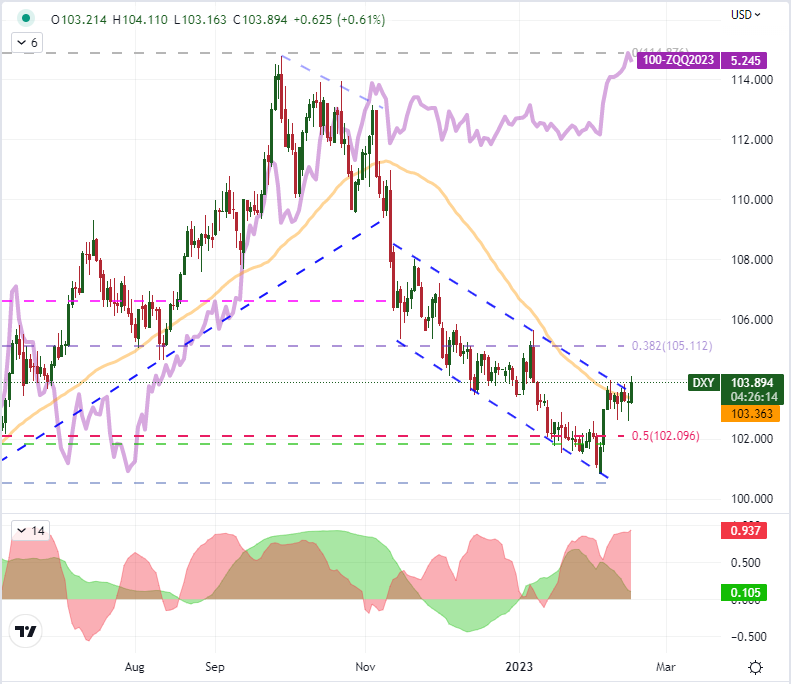
There were two speeds among the dominant market measures I tend to monitor on the global macro spectrum. For much of the market, there was reticence that would fold before major technical boundaries were truly tested. And for a small segment of the financial spectrum, there were some action-oriented breaks. The most prominent technical development on my radar was from the US Dollar. The DXY Dollar Index advanced a fairly modest 0.6 percent Wednesday, but that progress would come at the expense of the descending trend channel resistance that has developed since the high on November 11th (the day after the pivotal October CPI release) was put into place. The break from the past six-day horizontal congestion was a little more ambiguous for conviction however. Amongst the ‘majors’ (the most liquid Dollar-based pairs), USDJPY earned its ‘break’ credentials in a 104 pip rally that decisively cleared the 103.00 level founded on a five-week range high and the 38.2 percent Fibonacci retracement of the 2021 to 2022 bull run. As appealing as that picture may be, the trouble starts to arise when we attempt to trace back a fundamental motivation and realize that other majors have yet to second the move for the Greenback.

Chart of DXY Dollar Index Overlaid with Implied Fed Funds Aug 2023 Rate, 20 and 60-Day Correl (Daily)

image1.png

Chart Created on Tradingview Platform

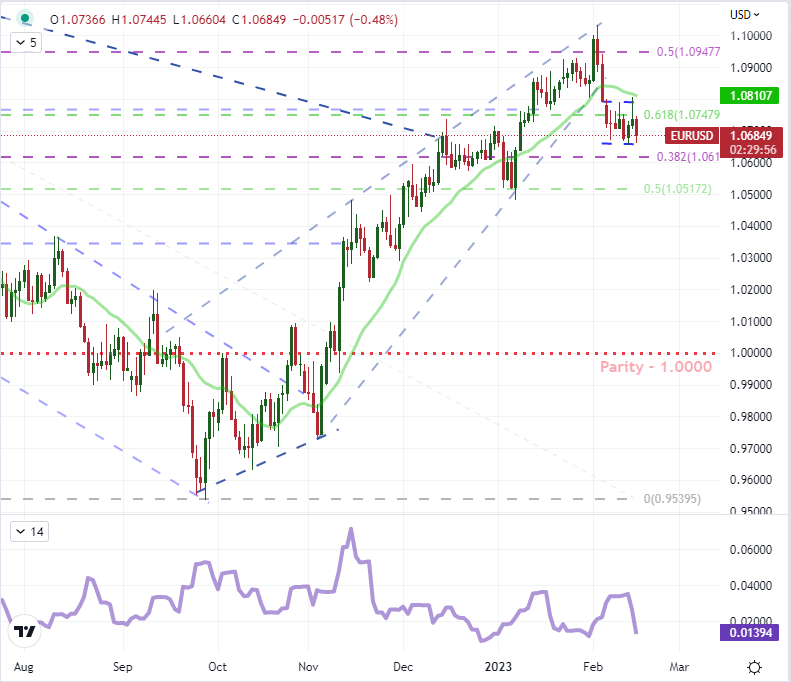
There are a few major fundamental motivation from which the Dollar tends to draw on when generating volatility and trend. Its safe haven status is arguably the most potent driver, but volatility was notable very benign this past session. Alternatively, we have the monetary policy differentials which have been a frequent driver of the FX market over the past year. Here, we have seen a significant build up in US-based rate forecasts these past few weeks first after the NFPs earlier in the month and the slower-than-expected deceleration in CPI this week. That said, the charge in Fed Fund futures implied rates was significant yesterday when the Dollar was landlocked and the jump occurred Wednesday as that pressure ebbed. Looking to other Dollar-based pairs, it seems that USDJPY may be an outlier at the moment – and scenario probabilities tend to favor the majority. A more common picture for the Dollar can be drawn from EURUSD. The world’s most liquid currency pair was lower – in favor of the Dollar – this past session, but it still fell neatly within its 8-day range between 1.0800 and 1.0650. Should this pair mark a break, it could significantly alter the calculus; but holding the lines will exact a strong influence over the benchmark currency.

Chart of EURUSD with 20-Day SMA and 8-Day Historical Range (Daily)

image2.png

Chart Created on Tradingview Platform

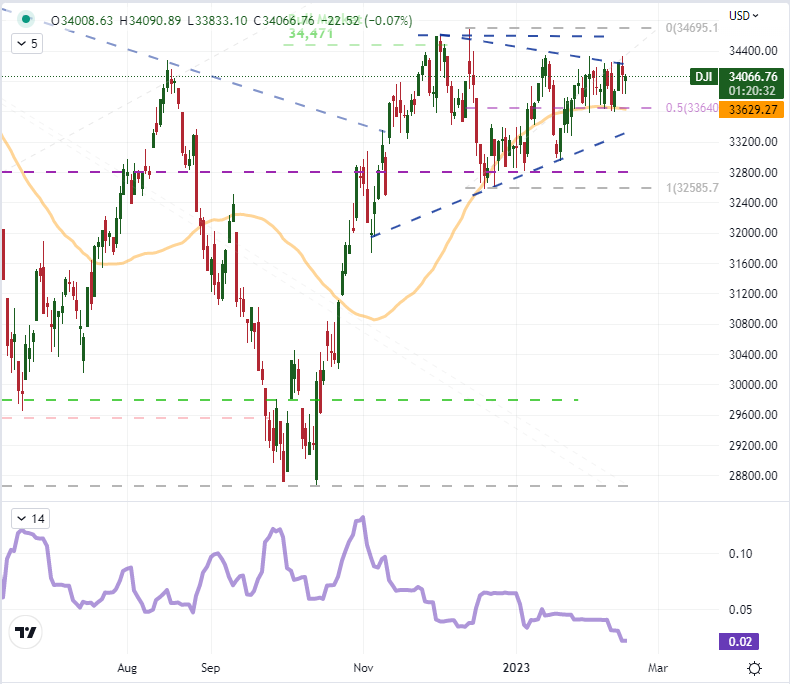
Between the Dollar and the Dow as a model for market tempo, I would have to say that the US equity index seems to better reflect the backdrop. The ‘blue chip’s’ inside day (whereby the range of Wednesday fit neatly within Tuesday’s as a sign of indecision) summed up the picture nicely. There is a much larger congestion pattern that this index has committed to built out of a wedge with the 50-day simple moving average and midpoint of the past three months’ range as support. This has in turn helped build out a 14-day historical range that is the most restrictive trading for the benchmark since September 9, 2021 – before the market made its first notable bearish break of the post-pandemic bull run. A resolution will come eventually, but conviction is necessary for providing real traction for trend development. In the meantime, volatility measures for equities, Treasuries, FX, oil, gold and emerging markets have all noticeably deflated.

of clients are net short.
Change in Longs Shorts OI
Daily -4% 2% 0%
Weekly -5% 3% 0%
What does it mean for price action?
Get My Guide

Chart of Dow with 50-Day SMA and 14-Day Historical Range (Daily)

image3.png

Chart Created on Tradingview Platform

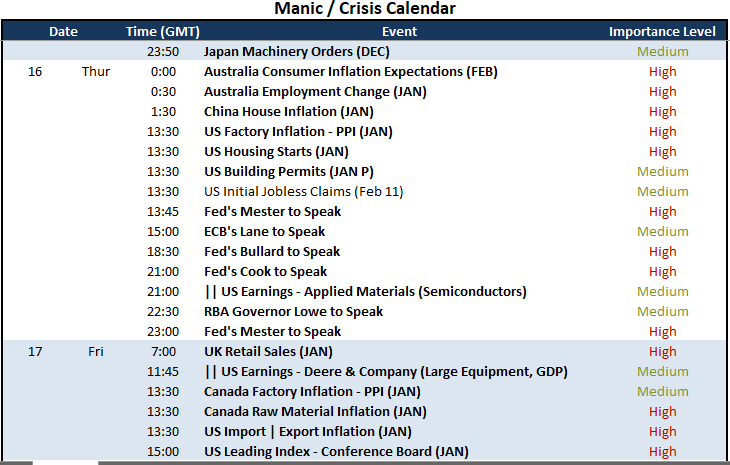
The best remedy for aimless and quiet markets is an acute fundamental spark that can tip a deeper fundamental theme that in turn sets a blaze on speculative conviction – bullish or bearish. Unfortunately, what we have on the docket through the end of the week is not the kind of event risk that I would expect to seriously charge a major regional market or asset class – much less the global macro landscape. While I will take in some modest earnings event risk, the Australia employment data, Chinese housing inflation and UK retail sales; it is the Fed speak that seems to carry the most potential for me. While upstream US inflation (PPI and import) is noteworthy and housing data an important economic conduit at the moment, the central banker rhetoric could tip the scales on rate expectations following the CPI release earlier this week. It is a high bar to truly charge the market, but it is perhaps the most capable ‘known’ update on tap.

Top Global Macro Economic Event Risk for the Next 48 Hours

image4.png

US Dollar Gains as Markets Digest Rosy Retail Sales After CPI Data, Where to?

US Dollar Gains as Markets Digest Rosy Retail Sales After CPI Data, Where to?

Asia-Pacific Market Briefing – US Dollar on The Move

The US Dollar rallied about 0.5% on Wednesday, with the DXY index closing at its highest since January 9th. A model that I built outlining the path ahead for the Chinese Yuan correctly showed that back in the middle of January, CNH was getting overbought. Since then, the latter has weakened back into the anticipated margin of error. Still, further gains might be in store for the Greenback.

The US Dollar continued climbing in the aftermath of yesterday’s hotter-than-expected local CPI report, which opened the door for the Federal Reserve to continue its hawkish policy stance. Markets continued pricing out once-anticipated rate cuts towards the end of this year, pushing up front-end government bond yields.

Over the past 24 hours, traders had more economic data surprises to digest. US retail sales unexpectedly gained 3.0% m/m in January. Economists were looking for a 2.0% rise. Meanwhile, homebuilder sentiment also surprised higher in February, climbing the most since the summer of 2020. For the US Dollar, it also didn’t hurt that UK CPI clocked in softer-than-expected in January, denting the British Pound.

Heading into Thursday’s Asia-Pacific trading session, Wall Street was able to shrug off what retail sales data could mean for the Fed, focusing on a resilient economy. As such, sentiment could remain relatively upbeat. All eyes turn to Australia’s jobs report in the wake of increasingly hawkish RBA policy anticipation. Upbeat data could further reinforce this, offering a boost to AUD/USD.

US Dollar Technical Analysis

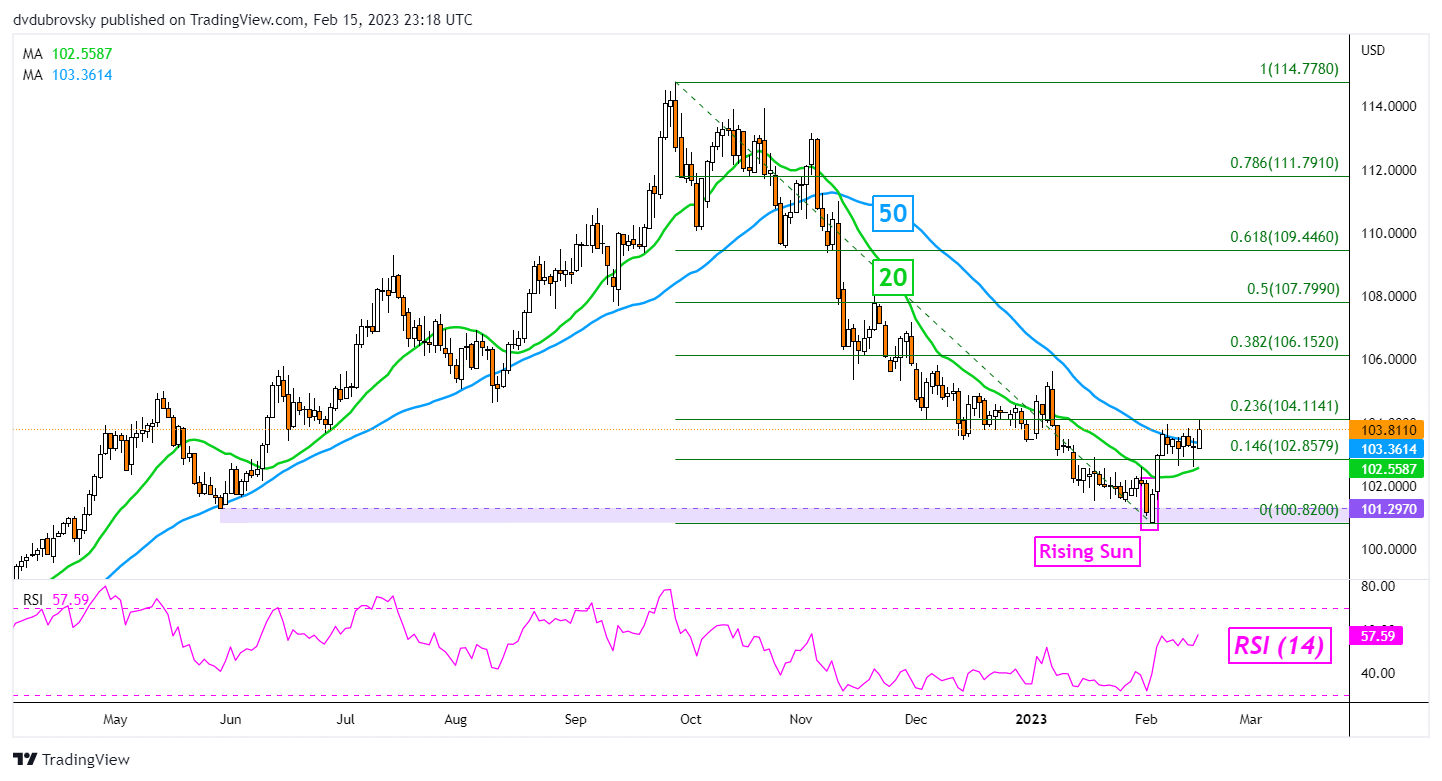
On the daily chart, DXY continues to make upside progress in the aftermath of a bullish Rising Sun candlestick pattern. Prices closed above the 20-day Simple Moving Average (SMA), but remain under the 23.6% Fibonacci retracement level at 104.11. A confirmatory push above the latter could open the door to extending recent gains and reversing the downtrend from the end of last year.

DXY Daily Chart

US Dollar Technical Analysis

Australian Dollar Slides After Disappointing Jobs Data. What’s Next for AUD/USD?

Australian Dollar Slides After Disappointing Jobs Data. What’s Next for AUD/USD?

AUD/USD TECHNICAL FORECAST – BULLISH

The recent retreat in the Australian dollar against the US dollar is a reflection of the divergence in the economic growth outlook of the two economies. This morning’s slide following dismal Australian jobs was no exception – employment fell for a second straight month in January while the jobless rate jumped to its highest level since May.

AUD/USD, down nearly 4% since the start of this month, has been guided by the relative underperformance of the Australian economy, as reflected in the Economic Surprise Indices (ESI). The Australian ESI is languishing around the 2020 lows, while its US counterpart is at the highest level in 10 months. The better-than-expected US data recently have translated into a marginal upgrade in consensus US economic growth expectations for 2023. In contrast, Australia’s economic growth outlook for the current year is yet to see any upgrades.

AUD/USD Vs Australia Economic Surprise Index (ESI) Relative to US ESI

Importantly, the subdued Australian economic data raise the question as to how long the RBA can continue to remain hawkish, while surprisingly strong US data recently mean that a Fed pause is still some way off. Moreover, the optimism over China’s reopening and rising commodity prices have supported AUD. However, it remains to be seen if the reopening translates into higher consumer spending (pent-up demand) via tourism spending or a pick-up in broad-based demand, including commodities, or both. In this regard, industrial commodity prices have softened since late January.

AUD/USD Daily Chart

image2.png

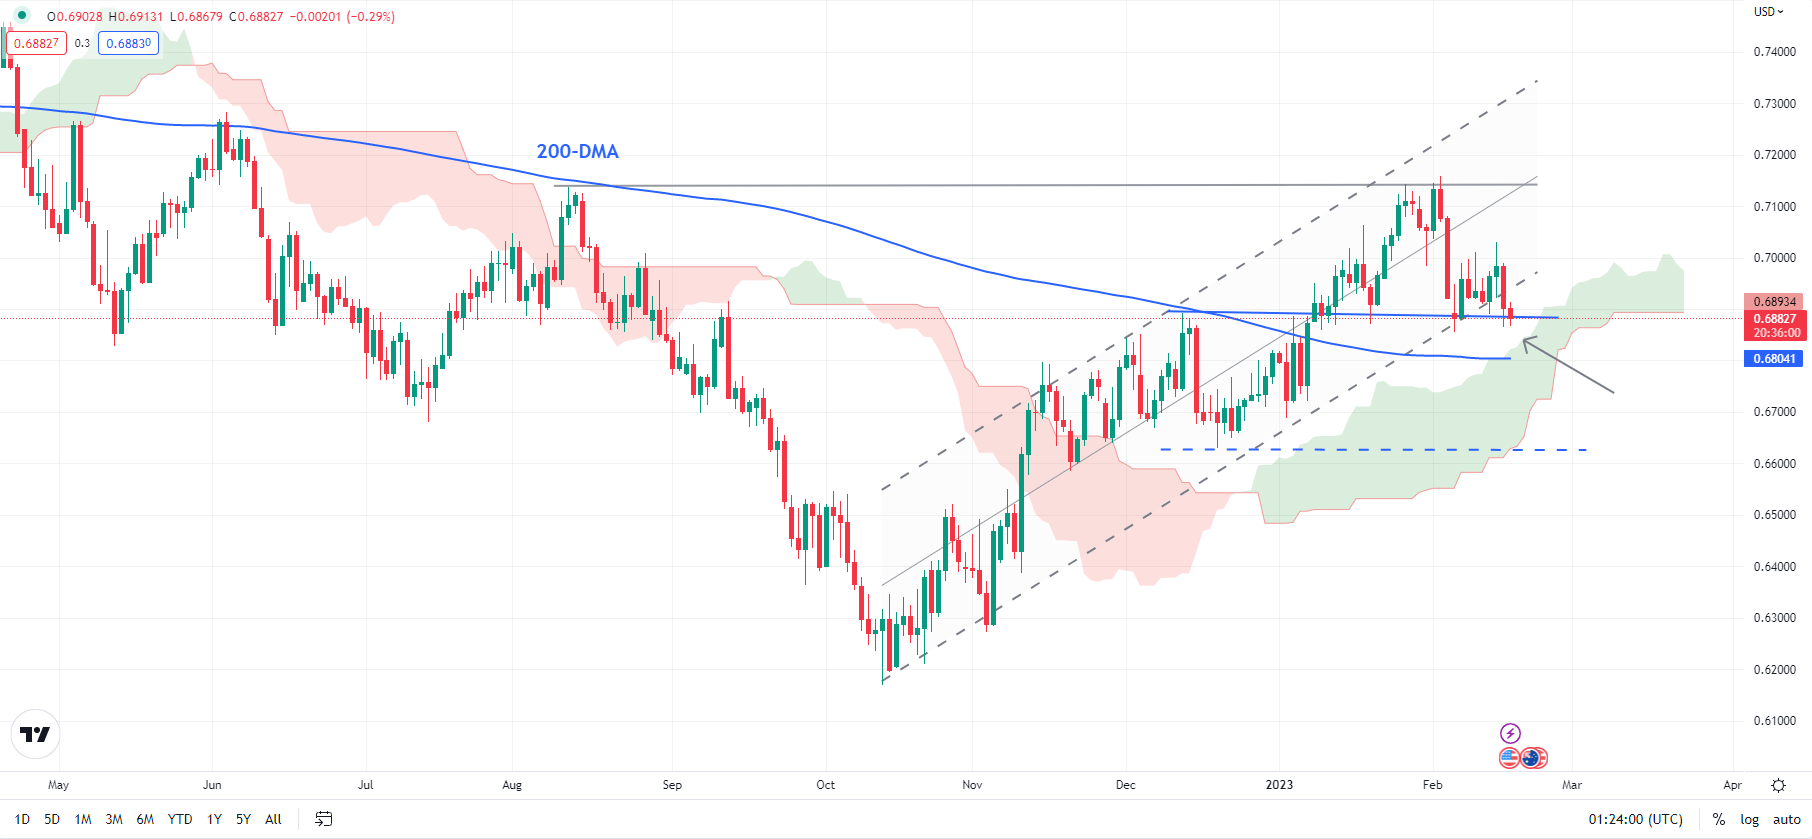
On technical charts, AUD/USD is approaching crucial support on a horizontal line since mid-December at about 0.6900. A break below would confirm that the 4-month-long upward pressure had faded, exposing downside risks toward the December low of 0.6625, near the lower edge of the Ichimoku cloud. The broader uptrend is unlikely to reverse while AUD/USD holds above 0.6625.

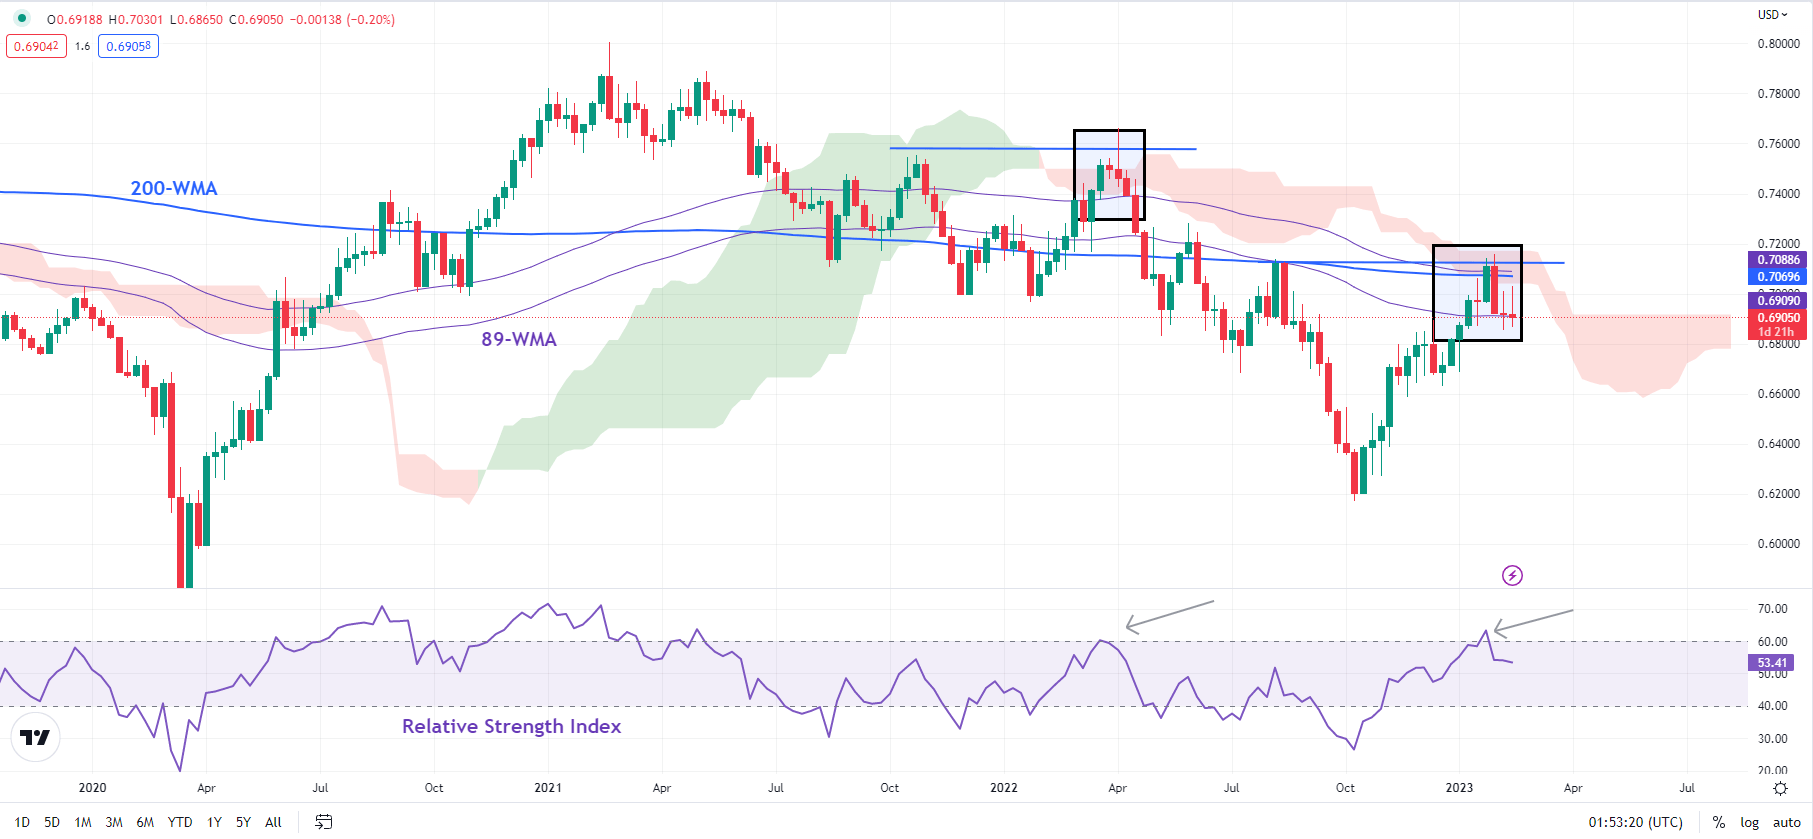
AUD/USD Weekly Chart

image3.png

The previous update highlighted the risk of a minor retreatafter AUD/USD ran into a major ceiling: the 200-week moving average, coinciding with the 89-week moving average and the August high of 0.7135. In line with the previous update, on the daily charts, AUD/USD remains bullish. However, the technical outlook could shift to Neutral if it decisively breaks below 0.6900.

Euro Trapped in the Range as US Dollar Takes off Elsewhere. Where to for EUR/USD?

Euro Trapped in the Range as US Dollar Takes off Elsewhere. Where to for EUR/USD?

The Euro steadied in Asia after drifting lower into the New York close as the US Dollar took off against other currencies. The Sterling and Aussie Dollar notched the largest declines but have made small gains today.

The greenback was boosted by a blitzing retail sales increase of 3.0% in January which outstripped the 2.0% anticipated and the prior reading of -1.1% was revised up to -0.9%.

The strong data seems likely to be met by further hawkishness from the Federal Reserve. Cleveland Fed President Loretta Mester will be speaking later today.

European Central Bank President Christine Lagarde spelled it out yesterday that they will be raising rates by 50 basis points at their next meeting. This is despite inflation decelerating over the last few months. The issue is that the latest headline CPI rate of 8.5% remains well above their target of 2%.

Walls Street finished on a high note and APAC stocks are pushing higher with Hong Kong’s Hang Seng Index (HSI) leading the way, up over 2%. Futures are pointing to a solid start to the North American session.

Treasury yields are slightly softer today but remain at elevated levels for the week. The benchmark 10-year note is trading near 3.80%.

The 10-year Japanese Government Bond (JGB) continues to test the resolve of the Bank of Japan (BoJ) as it pushes up against 0.50%.

11.5k Australian jobs were lost in January, which was way below forecasts of 20k being added and the unemployment rate jumped to 3.7% against 3.5% anticipated and prior. A lower participation rate contributed to the bump. AUD/USD is slightly firmer on the day, currently trading above 0.6900.

Crude has also steadied with the WTI futures contract near US$ 79 bbl and the Brent contract is eyeing an approach toward US$ 86 bbl. Gold appears comfortable near US$ 1,840 an ounce for now.

There will be a number of ECB speakers today and then the US will see plenty of data with PPI, housing starts, building permits and jobless claims all featuring.

EUR/USD TECHNICAL ANALYSIS

The Euro has remained in a 1.0655 -1.0805 range for 2 weeks and these levels may provide support and resistance respectively.

The 21-day simple moving average (SMA) lies at 1.0805 and might add weight to the resistance level.

On the downside, nearby support might lie at the previous lows in the 1.0655-70 zone ahead of prior lows at 1.0483 and 1.0443.

image1.png


Japanese Yen Price Setup: How Much More Upside in USD/JPY?

Japanese Yen Price Setup: How Much More Upside in USD/JPY?

USD/JPY SHORT-TERM TECHNICAL OUTLOOK – NEUTRAL:

The downside in the Japanese yen could be limited against the US dollar as it approaches strong support ahead of the changes at the helm of the Bank of Japan.


The nomination of former BOJ policy board member Kazuo Ueda as the central bank governor has cooled speculation of an earlier normalization of interest rates. In the past, Ueda has warned of the dangers of premature interest rate hikes, putting to rest any concerns about higher policy rates in the foreseeable future. However, a reassessment of the yield curve control policy can’t be ruled out given that he has highlighted its potential flaws. The perception that Ueda could tweak YCC given accelerating inflation could at the very least cap USD/JPY’s rise.


USD/JPY Daily Chart


image1.png

Chart Created Using TradingView

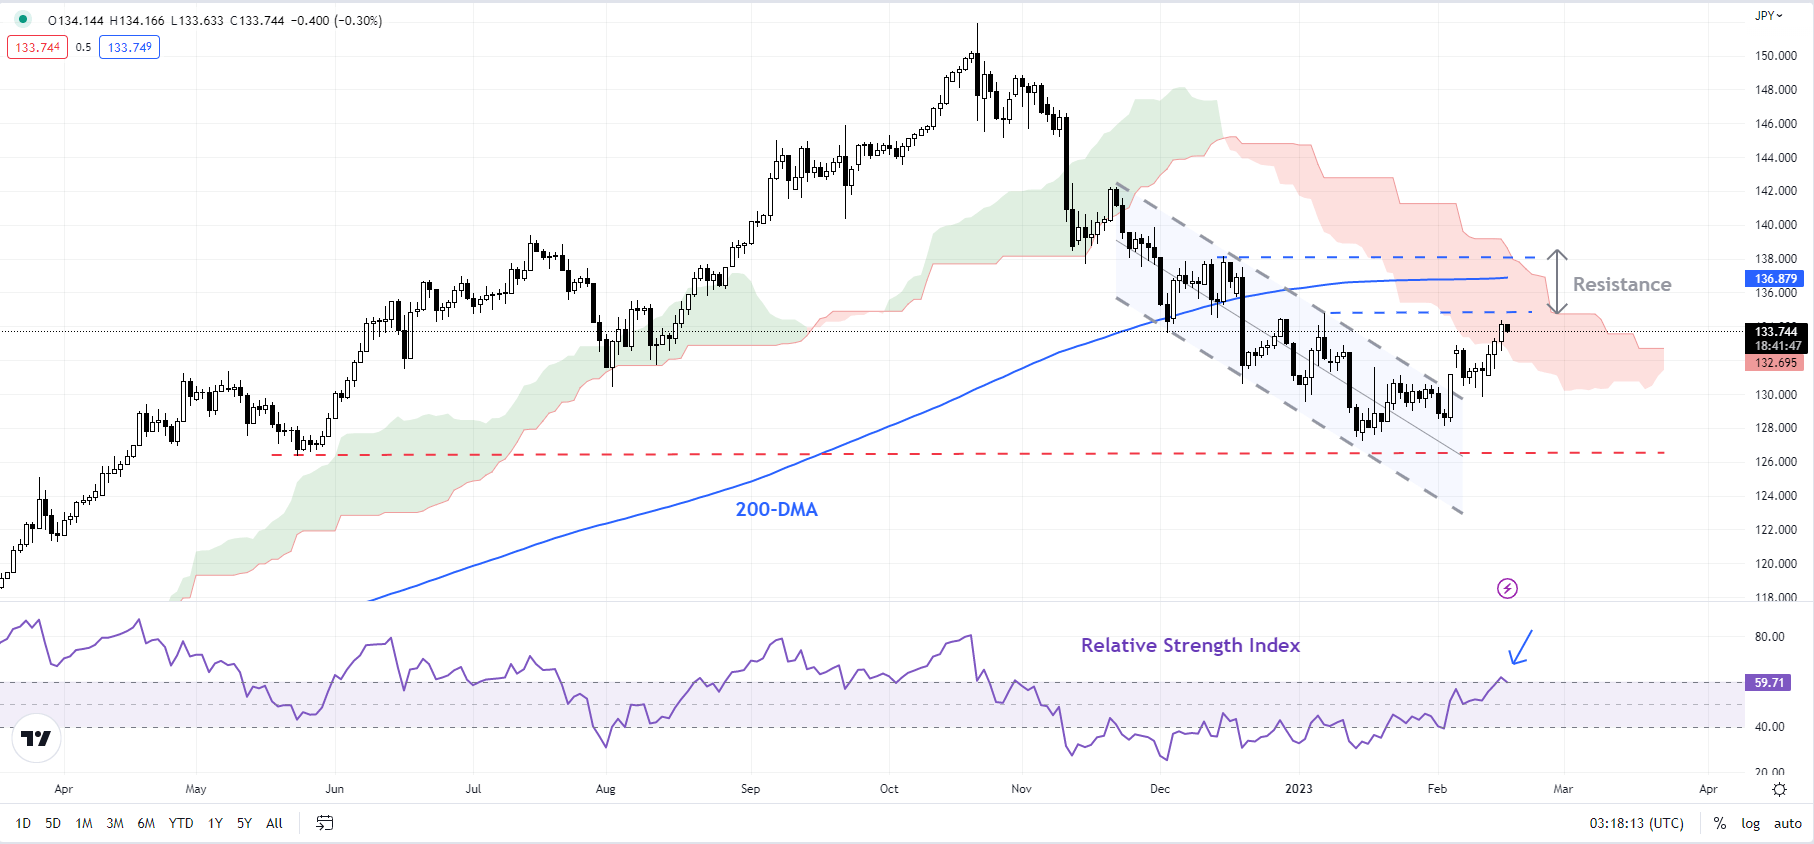
USD/JPY, up over 5% from a seven-month low hit in January, is running into a tough converged hurdle at 134.00-137.00, including the 89-day moving average, the 200-day moving average, around the early-January high. The 14-day Relative Strength Index (RSI) is near a crucial ceiling of 60 from where the previous retreat in December took place. While the price action is still unfolding and the RSI could go higher, corrective rallies generally tend to stall around RSI levels of 55-60.


USD/JPY Daily Chart


image2.png

Chart Created by Manish Jaradi using Metastock

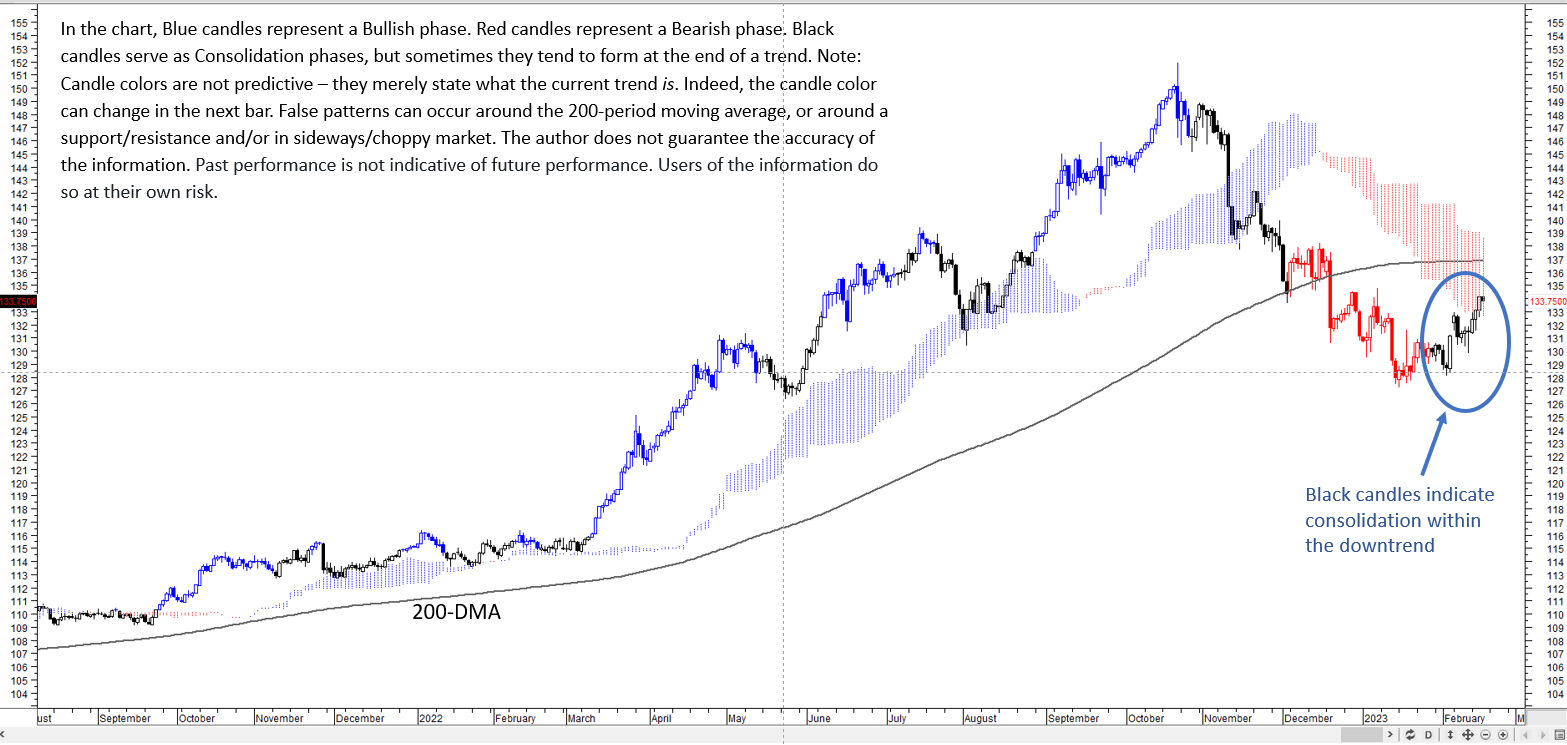
As the color-coded candlestick chart, based on trending/momentum indicators, shows the medium-term trend is down for USD/JPY, and the most recent rally is a consolidation within the broader downtrend –a risk highlighted in recent updates (see “Japanese Yen Technical Outlook: Is USD/JPY Building a Base?”, and“Japanese Yen Technical Outlook: What’s Next for USD/JPY After BOJ”, published late January).


US Treasury 10-year Yield Daily Chart


image3.png

Chart Created Using TradingView

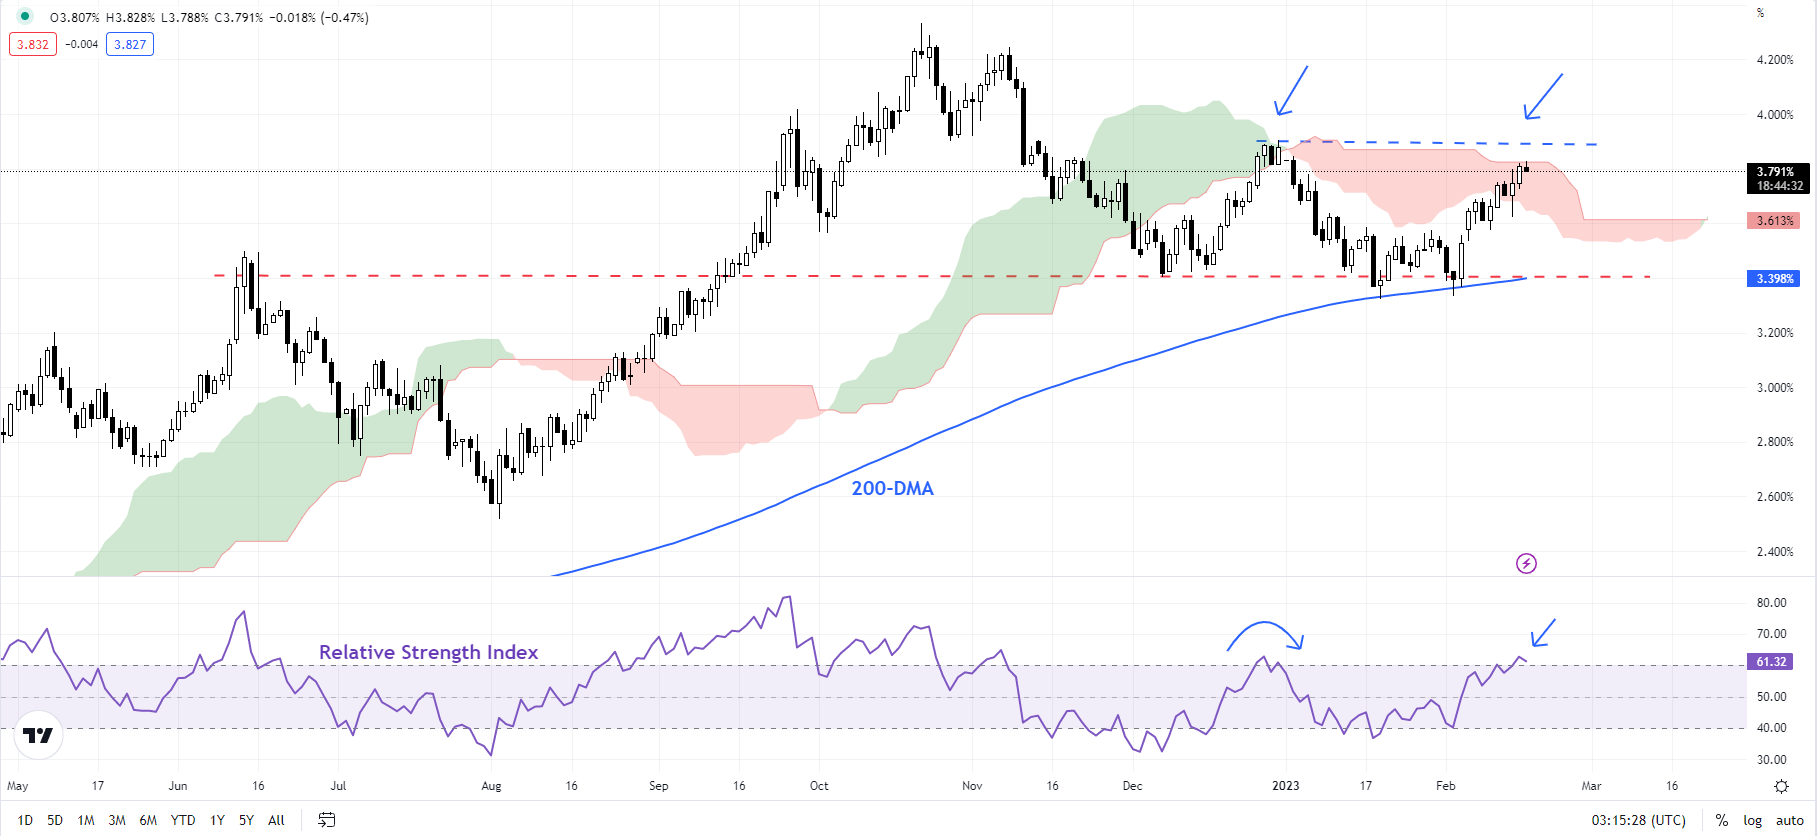
This is further reinforced by developments on the technical charts of the US Treasury 10-year yield, which is now testing a similar stiff barrier, including the December high of 3.90%, roughly coinciding with the upper edge of the Ichimoku cloud. The difference of course is that the yield hasn’t broken a meaningful price pivot compared with USD/JPY, suggesting that BOJ policy could be starting to be a stronger driver than US Treasury yields for now.

USD/JPY 4-Hourly Chart


image4.png

Chart Created Using TradingView


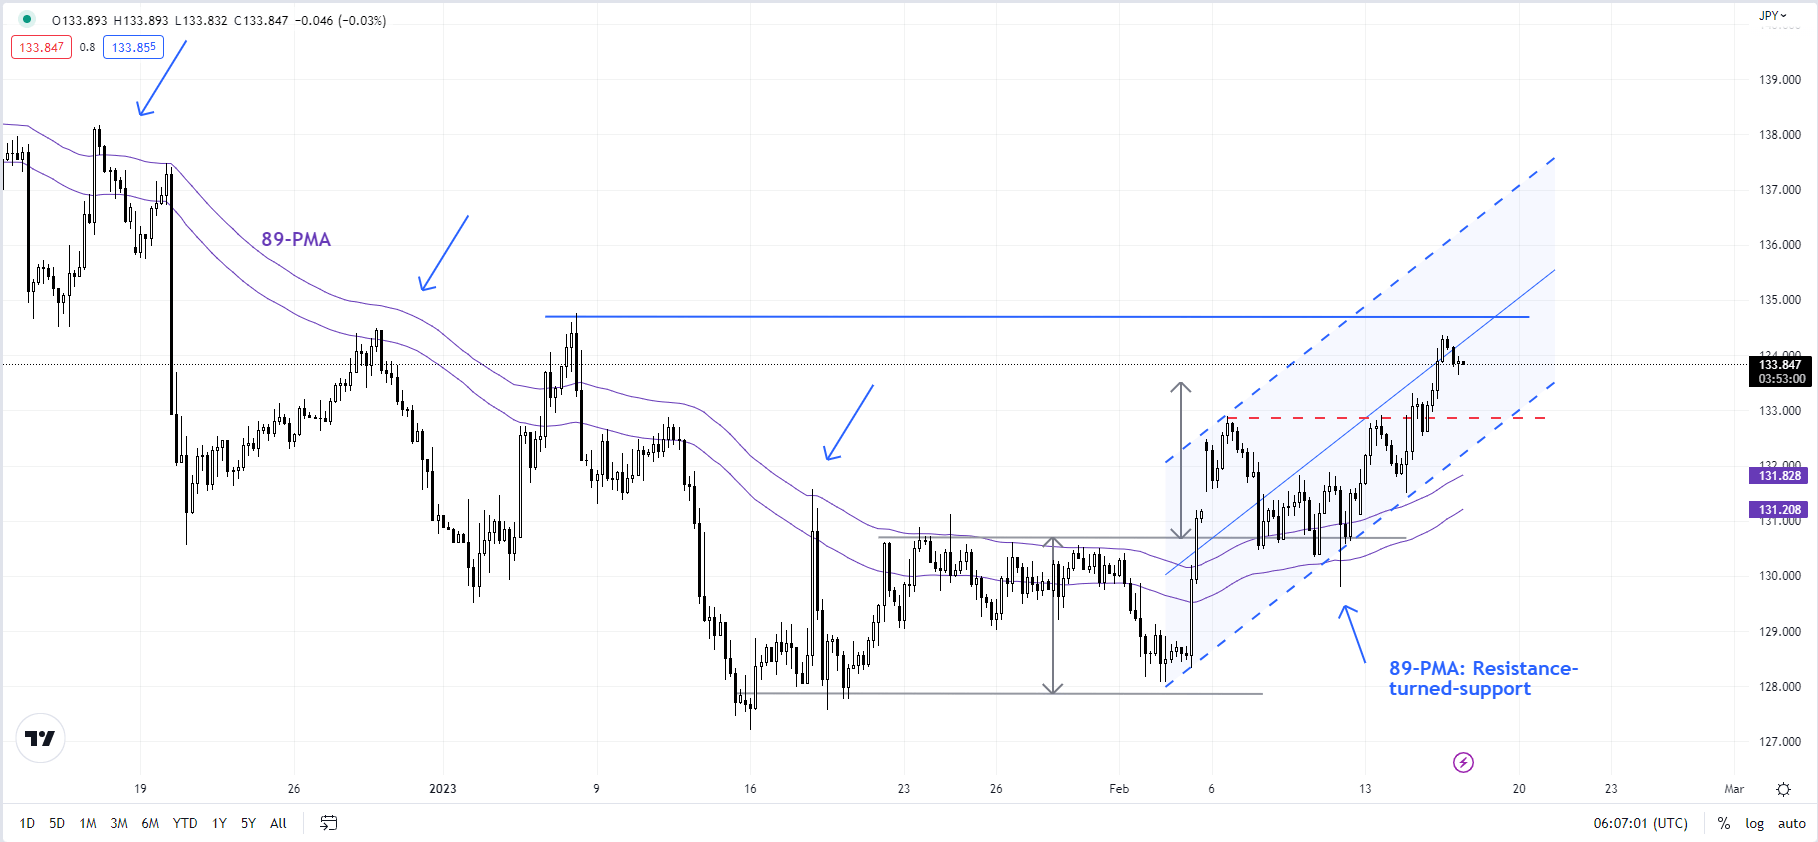
Having said that, there are no signs of reversal of the nascent uptrend. The upward momentum on intraday charts continues to be strong (see 4-hourly chart). The immediate upward pressure is unlikely to ease while the pair holds above the initial cushion at the February 6 high of 132.90, roughly around the lower edge of a rising channel from early February.

Gold Prices Aim for Worst Month Since June 2021 as Retail Traders Boost Long Bets

Gold Prices Aim for Worst Month Since June 2021 as Retail Traders Boost Long Bets

Gold prices sank about 1 percent on Wednesday, with the precious metal closing at its lowest since the end of last year. Markets digested a better-than-expected US retail sales print, which followed a hotter-than-anticipated CPI report on the previous day. Both events helped drive up the US Dollar, which tends to inversely track XAU/USD.

The anti-fiat yellow metal is on course for the worst monthly performance since June 2021 if losses hold. Fading Federal Reserve rate cut bets have been boosting Treasury yields, further pressuring gold prices. Over the remaining 24 hours, gold traders should watch out for US PPI data, due at 13:30 GMT. Unexpectedly hotter wholesale inflation may further pressure the precious metal.

IG Client Sentiment Analysis

According to IG Client Sentiment, about 72% of retail traders are net-long gold. IGCS tends to function as a contrarian indicator. As such, since most traders are net-long gold, this could hint at further pain ahead. This is as upside exposure increased by 11.83% and 3.61% compared to yesterday and last week, respectively. With that in mind, these readings offer a stronger bearish contrarian trading bias.

IG Client Sentiment Analysis

Technical Analysis

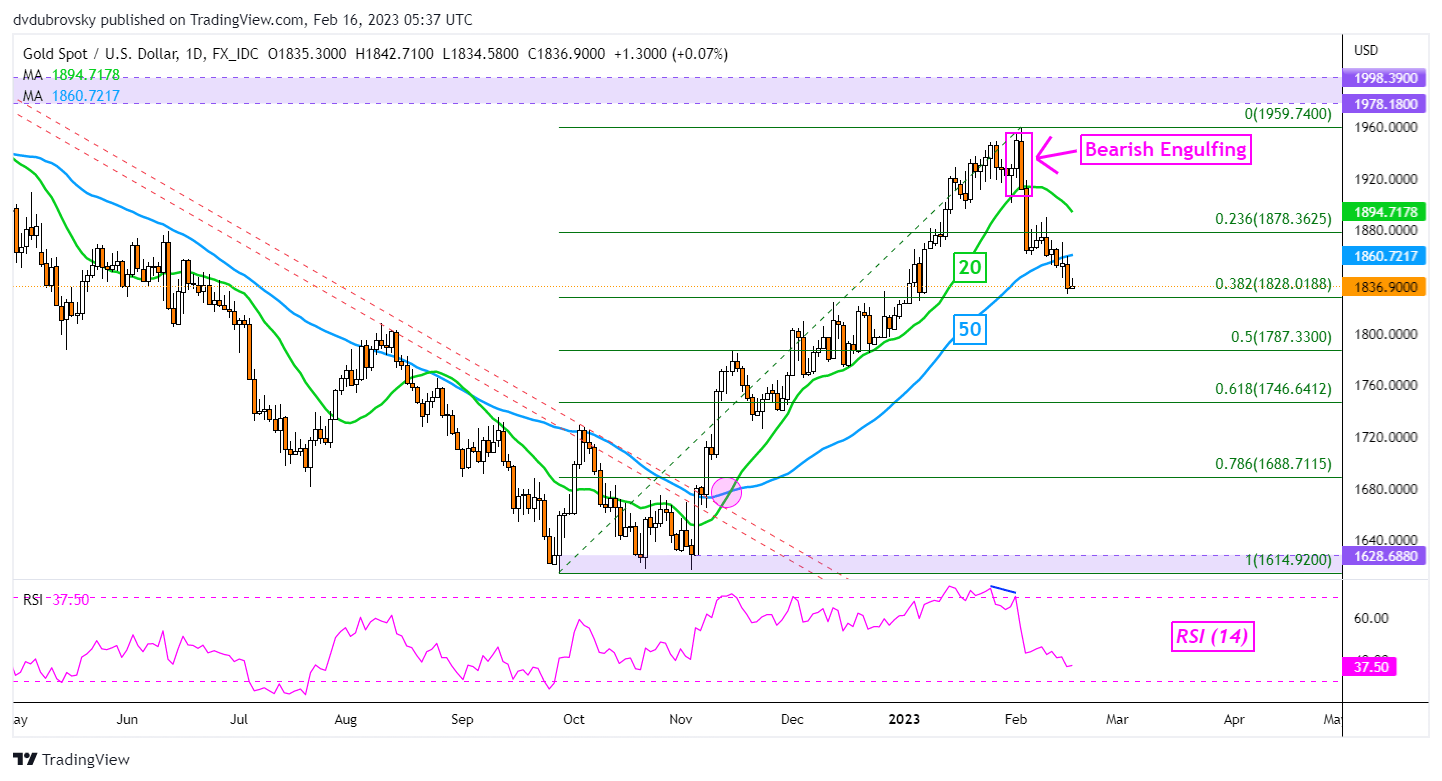
On the daily chart, gold has confirmed a breakout under the 50-day Simple Moving Average (SMA). This follows the emergence of a Bearish Engulfing candlestick pattern from January, which hinted at a reversal. Now, prices are increasingly at risk of extending losses. Immediate support is the 38.2% Fibonacci retracement level at 1828. Clearing this price exposes the midpoint at 1787. Otherwise, a turn back above the 50-day SMA will place the focus on the 20-day line. The latter may hold as resistance, reinstating a near-term downside bias.

XAU/USD Daily Chart

XAU/USD Daily Chart

Breaking News: CPI Miss Confirms Cooling UK Inflation, GBP on Offer

Breaking News: CPI Miss Confirms Cooling UK Inflation, GBP on Offer

The British pound has been pushed lower post UK-CPI (see economic calendar below) this morning after the report showed softer than expected inflationary data both YoY and MoM on headline and core inflation respectively. Key contributors to the upside came from “housing and household services (mainly from electricity, gas, and other fuels), and food and non-alcoholic beverages” while the largest downward funder stemmed from “transport (particularly passenger transport and motor fuels), and restaurants and hotels”.

ECONOMIC CALENDAR

image1.png

After yesterday’s higher wage data, it may come as a surprise that services fell for the period (refer to table below) and will surely give impetus to dovish members of the Bank of England’s (BoE) MPC. That being said, looking at the BoE implied rate probabilities below, money markets have done little in the way of repricing the likely 25bps interest rate hike for the March meeting.

image2.png

BANK OF ENGLAND INTEREST RATE PROBABILITIES

image3.png

GBP/USD DAILY CHART

image4.png

Chart prepared by Warren Venketas, IG

The daily GBP/USD chart above sold off immediately after the UK CPI report was released and considering the U.S. is showing comparatively sticky inflation pressures, a divergence between the two central banks is starting to show once more. From a technical analysis perspective, a third consecutive rising wedge pattern (black) is developing and looks to be heading towards wedge support. Before then, the 1.2100 psychological support handle needs to be breached to open up a pattern breakout exposing the key 1.2000 level.

Consumer spending critical to China’s economic recovery

Consumer spending critical to China’s economic recovery

Consumer spending critical to China’s economic recovery

Author: Yan Liang, Willamette University

It was a bleak year for the Chinese economy in 2022. Strict zero-COVID measures and regulatory crackdowns on the real estate sector and digital platforms slowed economic growth significantly. The annual real GDP growth of 3 per cent was significantly lower than the official target of 5.5 per cent. Chinese President Xi Jinping has indicated that the economy is the top priority in 2023.

Economic recovery in China hinges on reviving consumer demand. Exports and investment were the principal driving forces of demand in 2022, but they are unlikely to continue on the same trajectory. Export growth contracted in November 2022 due to falling external demand and a weaker global economy as a result of high inflation and monetary tightening. US efforts to ‘friend-shore’ or ‘near-shore’ manufacturing could further undermine China’s export production.

External demand is projected to continue falling in 2023 and private investment growth has been dampened by the property sector slump. Public infrastructure investment has filled the void, but continuous investment could further exacerbate the economic imbalances that the government is trying to avert. Consumer demand is crucial for economic growth in 2023.

The removal of COVID-19 restrictions allows more opportunities for consumers to shop and spend for the first time in almost three years. According to CEIC data, Chinese household bank deposits increased by 42 per cent since the beginning of 2020, totalling US$4.8 trillion. Pent-up demand is high and financial means are abundant but fear of infection and concerns about economic security have prevented households from spending.

China’s government could play an important role in stimulating consumer demand in the short-term as well as the medium- to long-term. Bolstering consumer confidence is key to accelerating economic recovery in the short-term. This requires the government to minimise the severity of infections by providing effective medical resources and services. Targeted cash handouts are needed for low-income households and consumption coupons could incentivise households to spend. Local governments could utilise the institutions and networks established in past poverty eradication initiatives to efficiently distribute cash assistance to low-income households in remote and rural areas.

More effective support must be given to the private sector which was battered by COVID-19, weakening external demand and supply chains. Policies should go beyond tax and fee cuts to include targeted lending and reduction of administrative burdens. The government should also consider subsidising the payroll of small and medium enterprises to lower the cost of their reopening.

Reviving private enterprises is essential to creating jobs and income, as they account for over 80 per cent of urban jobs in China. A thriving private sector would continue to generate jobs and income growth, which would not only bolster consumer confidence but provide stable financial means for consumer spending.

Increasing consumer demand in the medium- to long-term continues to be a challenge. Some economists argue that consumption is low in China because its growth is export-led and investment-driven. Both the value of the yuan and wages are kept low to propel export growth and interest rates are depressed so industrial investment is effectively subsidised by low-cost household savings. The resulting low household income and wealth leads to low consumption.

As exports and investment drive job and income growth, reducing export and investment growth does not directly translate into higher consumption. Over the past two decades, China’s household consumption has grown at an average rate of 9.3 per cent per year, more than three times the world average, due to high income growth. Proposals to increase consumption by cutting investment growth miss the real question — how can a healthy consumption growth that sustains investment growth and improves consumer welfare be supported?

Productivity and income growth, distribution and redistribution are essential to boosting consumption in the medium- to long-term. The Chinese government should continue to invest in the high-tech sector, research and development spending and education to provide a sustainable basis for income growth.

Promoting consumption growth does not necessitate cutting public investment but requires investment to be productivity-enhancing. The ‘common prosperity’ initiative, which aims to reduce the rural–urban divide, expand public services and provide more opportunities for rural migrant workers, would go a long way to boost consumption growth. With 500 million Chinese residing in rural areas and the urban–rural income gap remaining high at 2.5:1, policies that support rural revitalisation are critical to reducing the wealth gap and boosting rural consumption.

The social safety net has been expanding in China over the past decade but public social protection expenditure has remained low. Widening access to public services would reduce the need for precautionary savings, especially for migrant workers. Increasing consumer spending requires an increase, not a cut, in government spending.

China has attempted to boost consumption since the mid-2000s to address its unbalanced, uncoordinated and unsustainable economy — efforts which have been made more urgent by the current economic downturn. Boosting consumption growth should be driven by investment and government spending to ensure income continues to grow in a more equally distributed manner. This will require holistic policies and reforms.