Asian Markets Fall as Investors Digest U.S. Inflation Data

Asian Markets Fall as Investors Digest U.S. Inflation Data

The S&P 500 edged lower after data showed U.S. inflation cooled, but remained hot enough to keep the Federal Reserve on track for further interest-rate increases.

The S&P 500 ended down by less than 0.1%, erasing earlier gains, while the tech-heavy Nasdaq Composite rose 0.6% and the Dow Jones Industrial Average lost 0.5%.

The U.S. consumer-price index showed annual inflation cooled for the seventh straight month to 6.4% last month, according to Labor Department data released Tuesday. Still, the reading came in slightly above what economists surveyed by The Wall Street Journal had expected. Inflation also increased in January from a month earlier, in large part due to rising costs for shelter.

The data make it likely the Fed will not only raise interest rates in March, as was widely anticipated, but also point to the need for further rate increases in the following months. Hopes that the Fed would be able to pause after their March meeting had helped stocks rally to start the year.

“The strength of core inflation suggests that the Fed has a lot more work to do to bring inflation back to 2%,” said Maria Vassalou, co-chief investment officer of multi-asset solutions at Goldman Sachs Asset Management, in emailed comments. Vassalou added that she would be watching Wednesday’s retail sales report to see if the economy remains hot enough that the Fed may have to bring rates even higher than they currently anticipate.

 ASIAN STOCKS

Japanese stocks edged lower in midmorning trade, with the Nikkei Stock Average down 0.1% at 27587.58. Earnings are in focus, with Sapporo Holdings scheduled to announce its results later in the day.

South Korea’s benchmark Kospi was down 0.5% at 2452.70 in early trade, dragged by internet and financial stocks. Growth stocks retreated after U.S. inflation eased a bit in January but remained higher than expected, which could warrant a prolonged period of the Fed’s policy tightening. South Korea’s slowing jobs growth also damped sentiment. Foreign and institutional investors were net sellers. USD/KRW was 0.4% higher at 1,274.55.

Hong Kong’s benchmark Hang Seng Index was flat at 21116.84 in early trade, after data overnight showed U.S. inflation cooled, but remained high enough to keep the Fed on track for more interest-rate increases. China’s central bank kept its key policy rates unchanged earlier today, suggesting a hold on benchmark lending rates later this month. The Hang Seng Tech Index was up 0.3%.

Chinese shares were little changed in early trade as rangebound trading continued. The benchmark Shanghai Composite Index was flat at 3293.34, the Shenzhen Composite Index edged 0.1% higher to 2190.45 and the ChiNext Price Index was flat at 2565.72. CATL gained 1.3% following news that Ford Motor is investing $3.5 billion to build a battery plant in Michigan with help from the Chinese battery maker. Meanwhile, China’s central bank has kept its key policy rates unchanged today, which suggests a hold on benchmark lending rates later this month.

FOREX

The yen strengthend against other G-10 and Asian currencies amid risk-off sentiment sparked by U.S. CPI data released overnight. The stronger-than-expected data have sent jitters to market participants, Tina Teng, markets analyst at CMC Markets, said in an email, noting that January headline inflation was 6.4% on year, higher than an estimated 6.2%. The resurgent inflation is certainly not good news for global markets, Teng added. USD/JPY fell 0.3% to 132.71, AUD/JPY dropped 0.6% to 92.47 and EUR/JPY lost 0.4% to 142.44.

METALS

Gold was steady in the early Asian session, supported by potential safe-haven demand amid ongoing tensions between U.S. and China over suspected spy balloons. The precious metal appears to be performing better than most risky assets, which could possibly be due to some safe-haven flows, said Edward Moya, senior market analyst at Oanda, in an email. Spot gold was little changed at $1,855.16/oz.

OIL SUMMARY

Oil declined in the morning Asian session, weighed by a big increase in U.S. oil supplies. The market has continued to trade weaker this morning after bearish American Petroleum Institute data showed U.S. inventories increasing across the board last week, said ING commodities strategists in a research report. The API said U.S. commercial inventories of crude oil rose last week by a very large 10.5 million barrels, a source citing the data said. Front-month WTI crude oil futures were 0.3% lower at $78.84/bbl; front-month Brent crude oil futures fell 0.3% to $85.35/bbl.

Dollar Rallies While VIX Drops After CPI, What Dictates the Market’s Next Move?

Dollar Rallies While VIX Drops After CPI, What Dictates the Market’s Next Move?

This week’s top event risk has come and gone and many will be surprised by the market’s response to the update. Inflation in the US has been a hot topic over the past half year given particularly with the perceived transition from an aggressive tightening regime to a status quo path for the world’s largest central bank, the Federal Reserve. While the data speaks to a particular country’s policy bearings, a tightening of the US financial system is a guide on expectations for the rest of the world. All that said, the January update for the US CPI (consumer price index) offered up the 7th consecutive month’s deceleration of pace since the 9.1 percent peak in the June stats. That said, the market’s are forward looking and nuance matters. While the central bank’s much sought-after disinflation is happening, the pace has markedly cooled. The 6.4 percent headline year-over-year figure was higher versus the 6.2 percent expected. What’s more, the less volatile measures and some of Chairman Powell’s particular areas of concern offered up evidence that pressure may prove stickier than the Fed wants.

Chart of S&P 500 with 20-Day SMA, Volume and Day/Change in US CPI YoY (Daily)

image1.png

In turn, the market’s discount to the FOMC’s commitment to a terminal rate at 5.1 percent (according to the SEP) with no rate cuts expected through 2023, has all but evaporated. Fed Fund futures are now pricing in a peak rate forecast that stands at a premium to the central bank’s own views with forecast for a reduction in the rate in the second half of the year all but gone (there is -1bp difference between the June and December implied contract). For the S&P 500 and other ‘risk assets’, that would seem a problem; but there hasn’t really been a wide berth between Fed and market view to this point, so it doesn’t necessarily have to touch off panic. A look at previous CPI releases suggests that even large reductions in pace were met with temporary buoyancy before the markets swung lower. Other factors enter the picture at that point, but there aren’t many other points of genuine enthusiasm to work with going forward. A relief that the CPI wasn’t more problematic for the markets than it ‘could have been’ seems the interpretation from the VIX. That shouldn’t provide us a deep sense of relief however. Markets are already too sanguine for the picture we are currently facing in the global financial system.

Chart of VIX Volatility Index with 50 and 200-Day SMAs, 1-Day Rate of Change (Daily)

image2.png

Perhaps even more surprising for some traders was the Dollar’s lack of reaction to the higher Fed rate path now projected by the market itself. The actual peak rate as priced through Fed Funds futures is through August, and the implied rate is now pushing 5.29 percent. That is above the FOMC’s own 5.1 percent, but it is not unlikely that the March SEP will see that consensus shift up similar to the market’s own view. That being said, the difference between 5.1 and 5.29 percent is not that material, especially when comparing to other central banks like the ECB which has indicated that more hikes are on the horizon (FX is a relative value consideration). Seeing the DXY Dollar index struggle below 104 is not particular surprise, but what could inspire the Dollar bulls in earnest? I still believe the Greenback’s connection to ‘fear’ and its safe haven status reflects the most untapped potential. That said, should the S&P 500 drop, it could revive an underappreciated (and undervalued) aspect of the currency.

Chart of DXY Dollar Index Overlaid with Market Implied Fed Funds Aug 2023 Rate and VIX (Daily)

image3.png

For specific USD-based pairs, my attention is still on USDJPY. It’s struggles are just as notable on the technical side as they are fundamentally. That being said, the contrast in monetary policy is still the most disparate we will find amongst the major players – at least until the new income BOJ Governor decides to mark the end of the ultra-loose policy. Here, risk sensitive may seem an unusual consideration because the Yen is often considered a benefactor of risk aversion – owing to its carry trade unwind status. However, for USDJPY, the positive correlation to VIX is still very noteworthy. I will be watching the volatility index closely going forward.

Chart of USDJPY with 50-Day SMA and 1-Day Rate of Change, Days of ‘CPI’ Release (Daily)

image4.png

Chart Created on Tradingview Platform

For top event risk over the next 48 hours, there aren’t any CPI-like events that can stand alone in terms of full scope market moving potential. That doesn’t mean, though, that we are free of sparks. In the US, the combination of US retail sales, industrial production and housing market sentiment is a good overview of economic health in the world’s largest economy. Fed speak is also fairly dense ahead, so we will see what the policymakers have to say after this past session’s CPI release. Speaking of inflation, the UK will have its go at January price pressures with a run of data at 7:00 GMT. The Sterling has absorbed warnings of extreme inflation and the FTSE 100 of recession ahead, but can it continue to overlook the pressure. Chinese policy and Australia employment are other outliers to watch as well.

Top Global Macro Economic Event Risk for the Next 48 Hours

image5.png

Natural Gas Prices Losing Downside Momentum, Prices Primed for Reversal?

Natural Gas Prices Losing Downside Momentum, Prices Primed for Reversal?

Daily Chart – Eyes on RSI

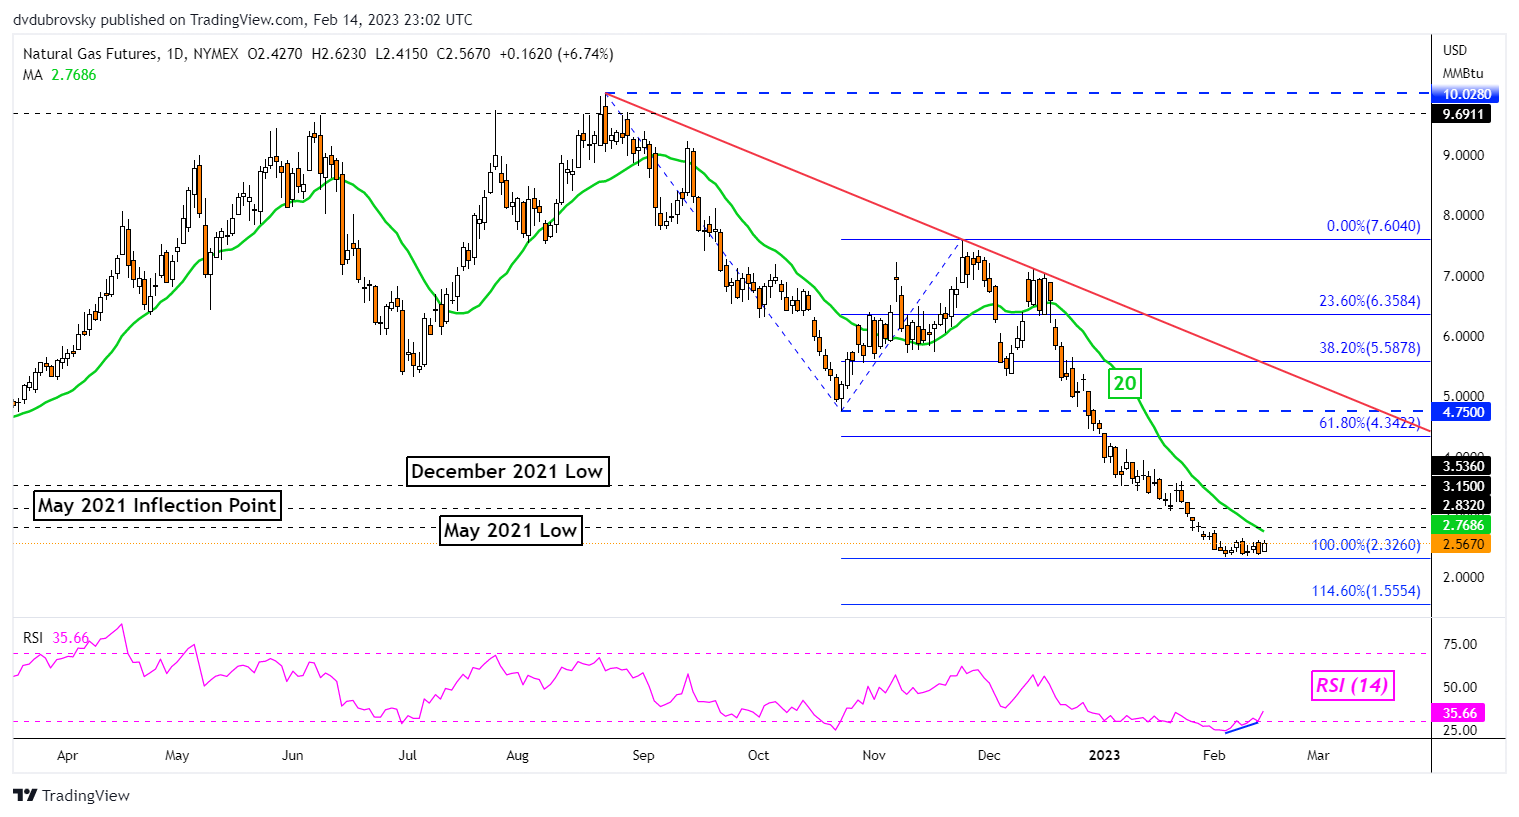
Natural gas prices continue to consolidate on the daily setting, marking a diversion from the aggressive downtrend seen from December through January. Broadly speaking, the technical trajectory seems biased lower following the formation of a bearish Head and Shoulders chart pattern on the weekly setting. This could be setting the commodity up for a revisit of 2020 lows.

Following the recent consolidation, we have seen positive RSI divergence emerge. This is a sign of fading downside momentum. While this is not a guarantee that a reversal is imminent, it will be important to continue monitoring price action in the days ahead. A breakout above the 20-day Simple Moving Average (SMA) could open the door to a broader reversal. Otherwise, extending losses exposes the 114.6% Fibonacci extension level at 1.555.

Daily Chart – Eyes on RSI

4-Hour Chart – Bearish Rectangle?

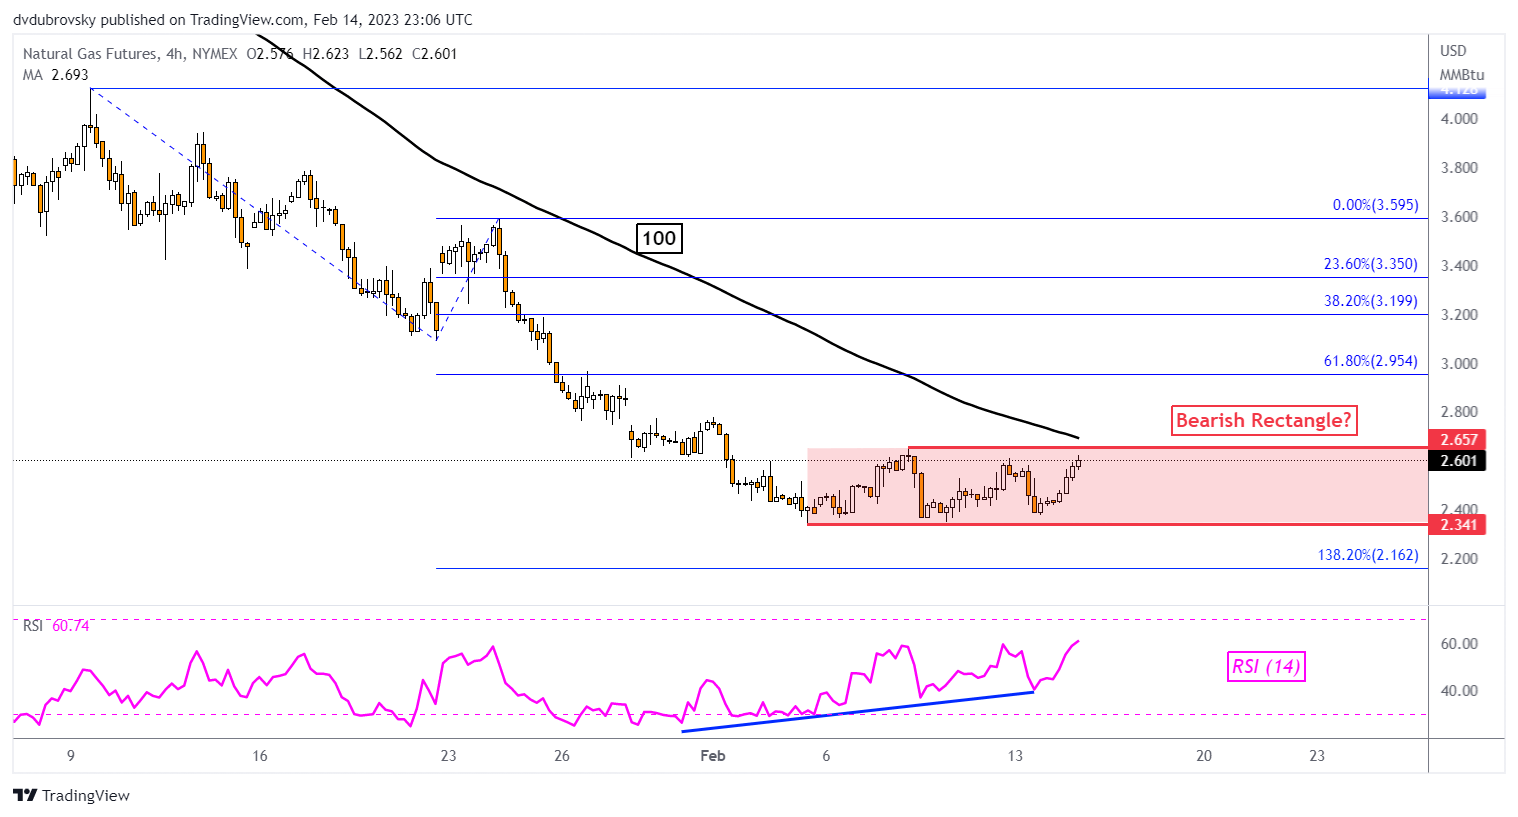
Zooming in on the 4-hour chart reveals something interesting is brewing. A Bearish Rectangle seems to be forming. Prices have been consolidating between an established floor – which is around 2.341 – as well as a ceiling – around 2.657. In this case, the rectangle is bearish because of the downtrend that occurred before the pattern’s formation.

While prices remain within the rectangle, the near-term trajectory may remain neutral. But, a downside breakout would open the door to extending losses towards the 138.2% Fibonacci extension level at 2.162. Otherwise, turning higher and rising above the 100-period SMA would likely increasingly offer a bullish technical outlook. That would place the focus on the January 24th high of 3.595.

4-Hour Chart – Bearish Rectangle?


Japanese Yen Slips as New BoJ Governor Takes the Helm. Where to for USD/JPY?

Japanese Yen Slips as New BoJ Governor Takes the Helm. Where to for USD/JPY?

The Japanese Yen dipped on Monday and Tuesday with USD/JPY trading at its highest level since early January at 133.32.

The appointment of Kazuo Ueda to be the new Governor of the Bank of Japan (BoJ) on Tuesday was somewhat of a surprise.

His tenure will begin on April 8th when current Governor Haruhiko Kuroda steps down after serving two 5-year terms.

Little is known about Ueda’s approach to monetary policy and whether or not the current ultra-loose stance will be maintained.

The 71-year served several years on the bank’s board and is currently Professor at Kyoritsu University. Some commentators have been sceptical of an academic being assigned to the role, but former Finance Minister Eisuke Sakakibara espoused a positive view on Bloomberg television.

Known as Mr Yen for his respected stewardship during his term in office, Sakakibara said that Ueda knows the structure of the bank and he is likely to initially keep monetary policy steady.

He speculated that Ueda might raise rates in the fourth quarter, but it will depend on the state of the Japanese economy and if inflation remains around 2%, as he expects it to be.

Mr Yen said that there isn’t much worry about holding financial assets and that the sale of such assets was unlikely at this stage.

There has been some speculation that an eventual tightening by the BoJ may see a significant repatriation of funds by Japanese investors.

While this might be plausible, interest rates in other developed markets are hundreds of basis points higher. Given the relatively anaemic economic growth rate in Japan, the BoJ would need to be hyper-aggressive to get those levels quickly.

This would seem to risk snuffling out hopes of a recovery from the so-called ‘lost decades’ that have seen Japan’s Nikkei 225 equity index never eclipse the peak seen in 1990 due to a struggling economy.

So, while a tightening by the BoJ later this year is now on the radar, an aggressive change of policy might be a while off.

Nonetheless, USD/JPY could be in for a bumpy ride until the market has a firmer grasp of the new Governor’s intentions. If Japanese yields start heading north, it could have a considerable impact on the exchange rate.

USD/JPY TECHNICAL ANALYSIS

image1.png

EUR/USD Price Action Setup After US CPI

EUR/USD Price Action Setup After US CPI

After a choppy session, EUR/USD ended largely flat after US CPI data provided little cues on the future path of Fed policy, reasserting the broader consolidation backdrop in EUR/USD.

While consumer prices rose 6.4% on-year in January, the smallest rise since late 2021, but gained 0.5% on-month, a tad faster than the 0.4% expected. The US rate futures market continues to price in two more Fed rate hikes, in March and mid-2023. Hawkish remarks by Fed officials on Monday suggested the Fed isn’t close to pausing its rate hiking cycle. The key focus is now on US retail sales data which would provide some guidance on consumer spending amid lingering recession concerns.

EUR/USD Daily Chart

image1.png

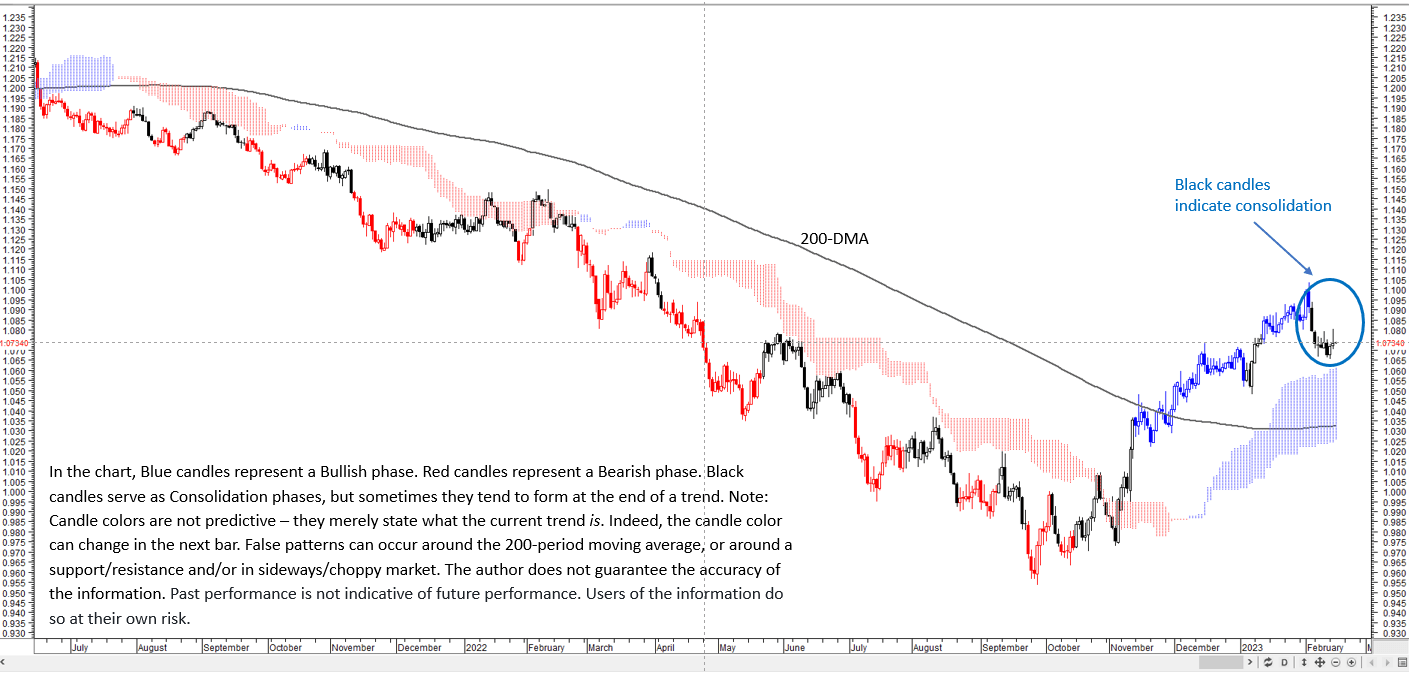
On technical charts, as the color-coded candles based on trending/momentum indicators suggest the overall trend remains up and the retreat this month is a consolidation within the uptrend (see “EUR/USD Technical Outlook: Short-term Setback”, published Feb. 6). Despite the retreat, EUR/USD hasn’t broken any significant price pivot yet, and the pair hasn’t yet retraced even a third of its gains since late 2022 – retracements of 38.2%-50% are considered to be reasonable, and don’t necessarily imply a reversal of the trend.

EUR/USD Daily Chart

image2.png

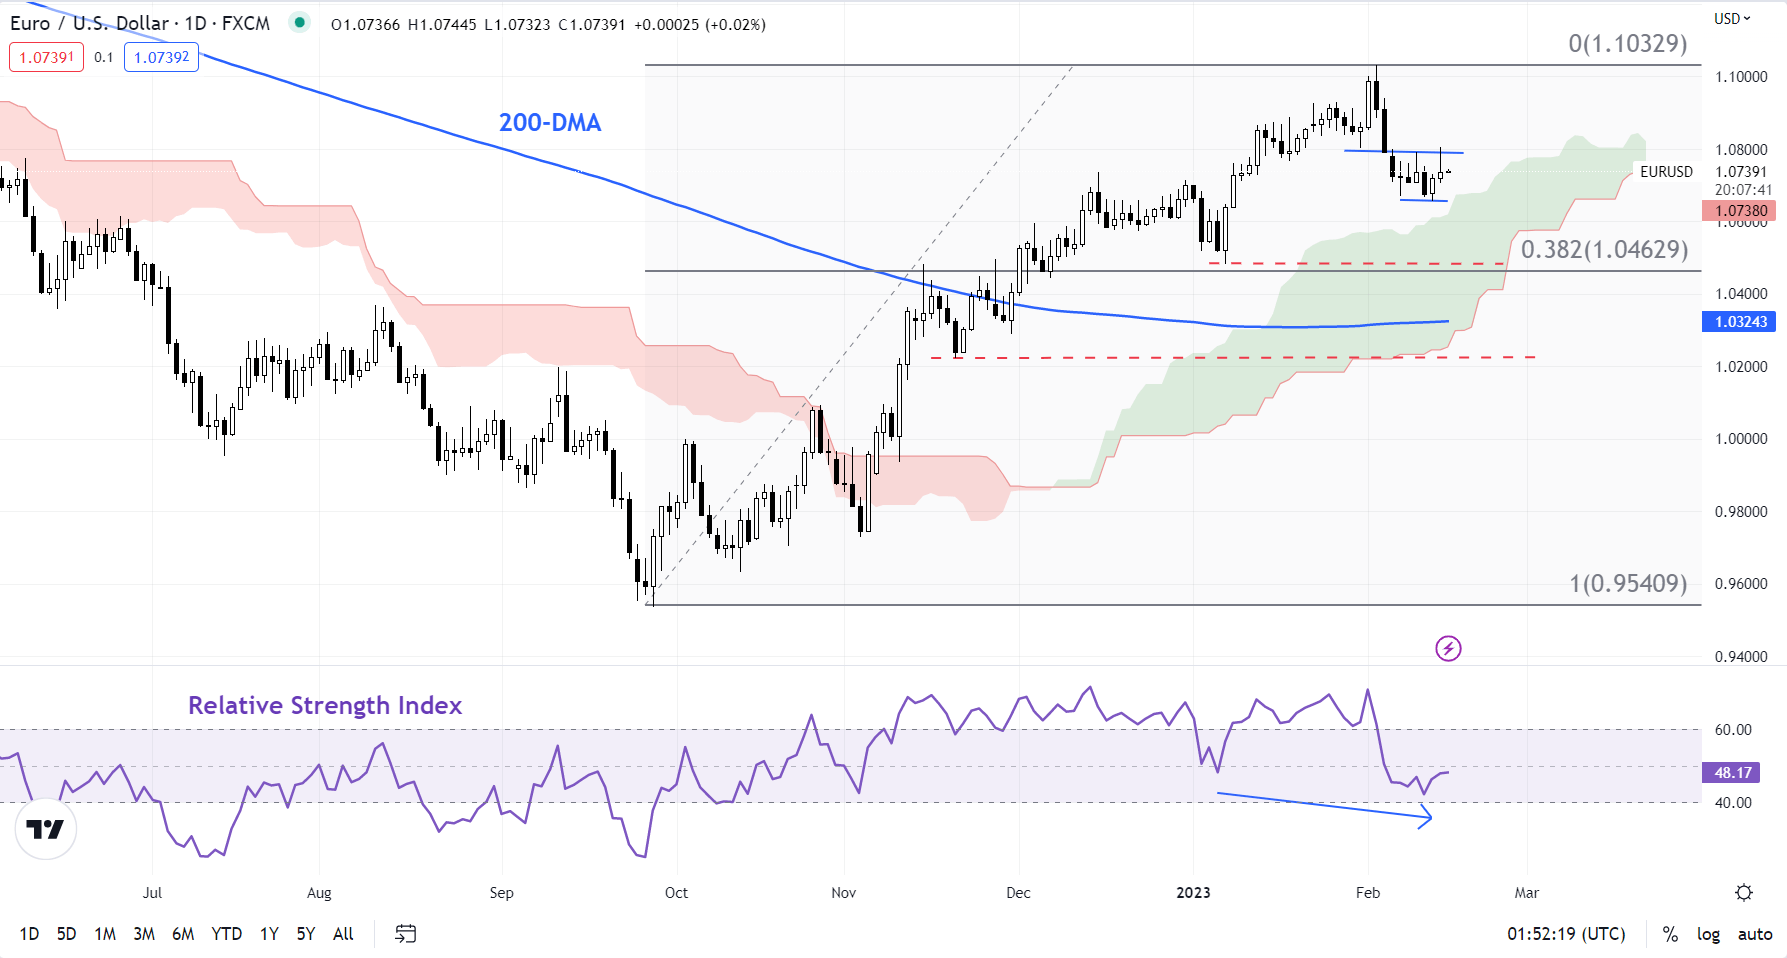
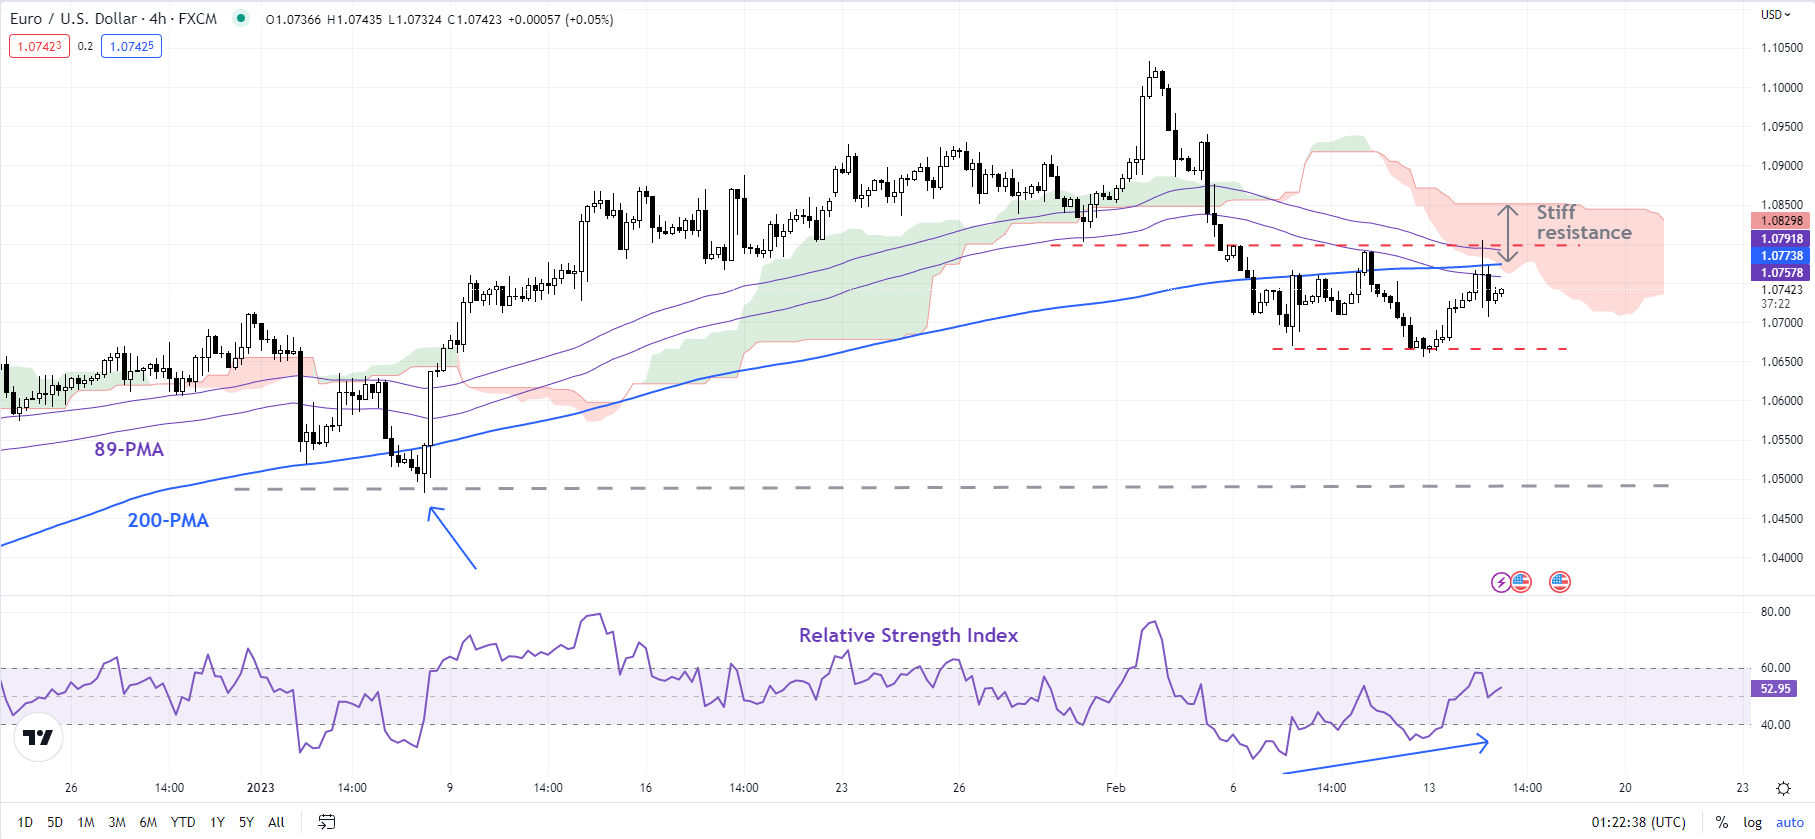
Most recently, EUR/USD has been hovering in a 1.0650-1.0850 range, also capped by the 200-period moving average on the 4-hourly charts. A potential positive momentum reversal – lower lows in the 14-day Relative Strength Index associated with higher lows in price – raises the prospect of a rebound in EUR/USD (see the daily chart).

Any break above the immediate resistance area of 1.0800-1.0850 could trigger a minor double bottom (the February lows), opening way toward 1.0950. Importantly, the breakout would confirm the immediate downward pressure was fading.

EUR/USD 4-Hour Chart

image3.png

On the downside, there is immediate support at the lower end of the recent range of 1.0650. Subsequent support is at the January low of 1.0480. Strong support is on the 200-day moving average (now at about 1.0320). The uptrend since late 2022 is unlikely to reverse while EUR/USD holds above the long-term moving average.

US dollar

US Dollar Trades Up Post CPI Beat as Markets Grapple Fed Hikes. Higher USD?

The US Dollar is firmer today heading into the European session after yesterday’s US CPI data overshot the mark. The headline number came in at 6.4% y/y rather than 6.2% due to an upward revision in the December read.

The January increase in prices of 0.5% m/m hit forecasts but the December number was upped from -0.1% m/m to 0.1%.

Three Federal Reserve speakers took to the podium with two of them sticking to the script of rates need to go higher and stay there for a while but one

Richmond Fed President Thomas Barkin and New York President John Williams kept their hawkish credentials intact while Philadelphia Fed President Patrick Harker appeared slightly dovish. He said that once the target rate is above 5% it will depend on the data for further hikes.

At the end of the day, the market added to the odds of a third 25 basis point lift in this cycle. While the March and May meetings already have a lift baked in, the June gathering is now live for a potential tightening of policy.

Treasury yields across the curve marched higher with notes in the 1-to-5-year part of the curve notching up the largest gains. The 2s 10s yield curve inversion tracked down to its lowest level since 1980. A concerning harbinger of a potential recession.

The higher interest rates underpinned the US Dollar, and the Australian Dollar has been the largest loser

Reserve Bank of Australia (RBA) Governor Philip Lowe testified in front of the Senate estimates committee today. The questioning was largely as anticipated around the timing of successive rate hikes from pandemic-induced lows, and he wasn’t drawn to any possibly inflammatory remarks.

USD/JPY is trading at its highest level since early January after visiting 133.32 overnight. It remains above 133.00 at the time of going to print as the markets digest yesterday’s announcement that Kazuo Ueda will be the new Governor of the Bank of Japan (BoJ).

APAC equity indices are a sea of red and futures are pointing toward a sift start for Wall Street later today.

Crude oil is a touch weaker with the WTI futures contract under US$ 78.50 bbl while the Brent contract is below US$ 85 bbl.

Looking ahead, after UK inflation data, the US will retail sales data.

DXY, (USD) INDEX, 2-YEAR AND 10-YEAR TRESUTIES AND 2s 10s CURVE

image1.png


Gold Prices Looked Past an Inflation Beat, But Broader Outlook Remains Bearish

Gold Prices Looked Past an Inflation Beat, But Broader Outlook Remains Bearish

Gold prices finished the past 24 hours relatively flat as critical competing headlines fought for the attention of the yellow metal. First, all eyes were on January’s US CPI report. Headline inflation clocked in at 6.4% y/y against the 6.2% estimate. This was also higher than a prediction I made using a lag analysis model. Still, it was within the error region. More importantly, the model sees February CPI at 6.3% y/y.

Combined with a stronger-than-anticipated core reading, this is not terribly great news for the Federal Reserve, which is trying to bring inflation down to a medium-term average target of about 2%. Financial conditions have been easing since the end of last year as markets priced in the conclusion of the tightening cycle and then some (in the form of anticipated rate cuts towards the end of this year).

Including today’s CPI report, markets have added about 3 rate hikes to the 2-year outlook since the day before January’s non-farm payrolls report blowout. As a result, the 2-year Treasury yield has rallied almost back to highs from November. This is as the US Dollar found some support. Unsurprisingly, this combination has not been working out great for gold.

Despite the unexpectedly sticky CPI report, gold prices were relatively mute. That is likely due to Fedspeak. Philadelphia Fed President Patrick Harker noted on Tuesday that the central bank was zeroing in on where rates could be restrictive enough – a sign that peak rates might be soon around the corner. But, he also added that the Fed might have to do more.

Put together, this likely points to a Fed that might keep rates restrictive for longer. Despite what occurred with gold over the past 24 hours, down the road, this may continue spelling more trouble for the anti-fiat yellow metal. Later today, the US will release January retail sales. Solid outcomes could risk adding further downside pressure to XAU/USD.

Gold Technical Analysis

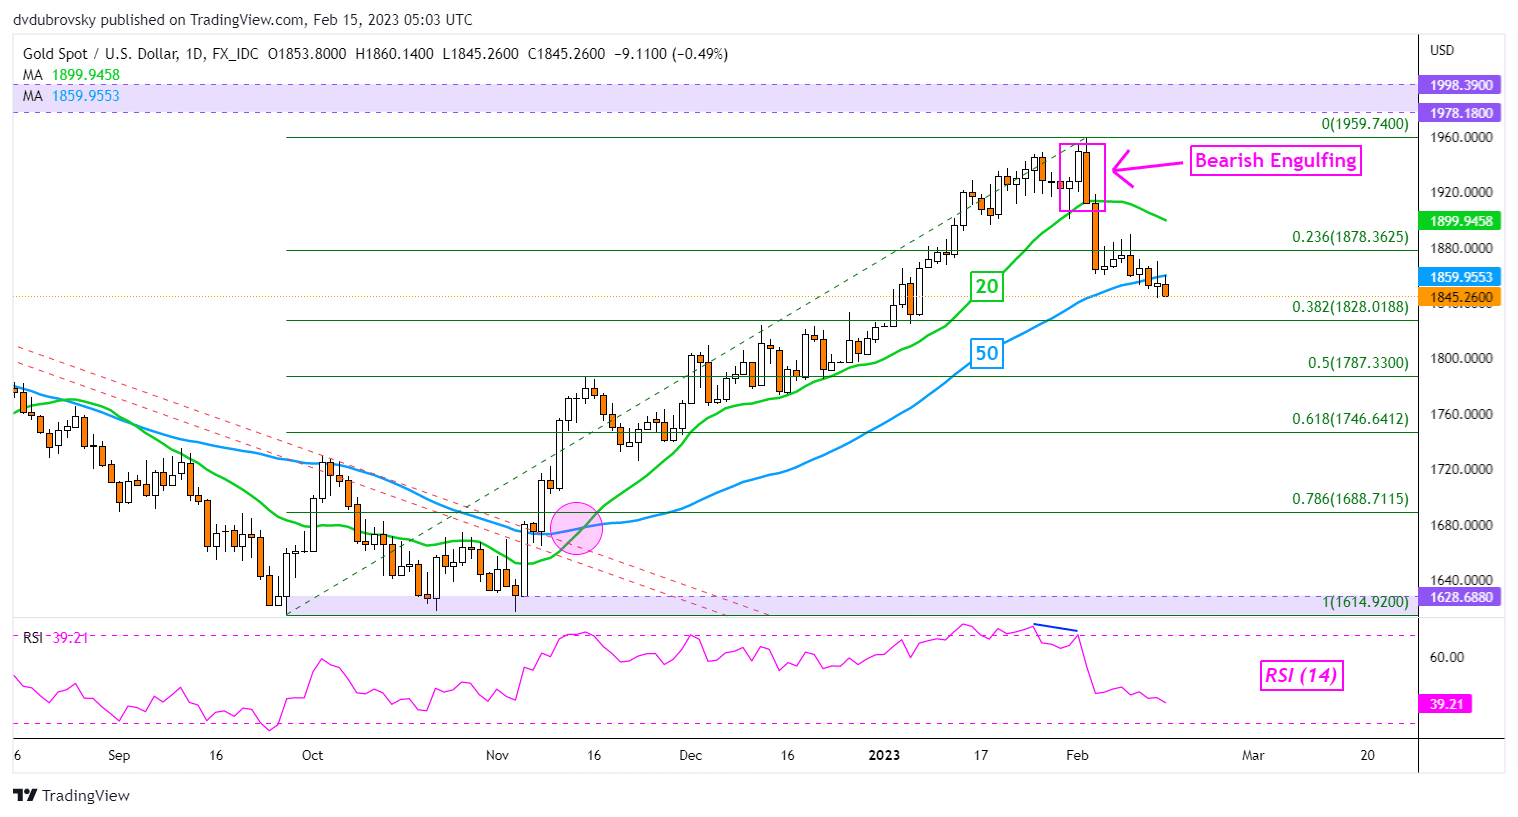
On the daily chart, gold is trying to extend losses under the 50-day Simple Moving Average (SMA). That is offering an increasingly bearish perspective, placing the focus on the 38.2% Fibonacci retracement level at 1828. In the event of a turn higher, the 20-day SMA could hold as resistance, maintaining the near-term downside focus.

XAU/USD Daily Chart

image1.png

SAFE deposit account – earn up to 20% per annum with LiteFinance

SAFE deposit account – earn up to 20% per annum with LiteFinance

Use SAFE account to earn up to 20% on your deposit per annum

Make profits in your trading accounts and pay free money into a SAFE deposit account to earn interest. Earn up to 20% per annum. The interest rate is floating, depending on your trading volumes.

What is a SAFE account?

SAFE is a non-trading savings account that LiteFinance’s client can open and top up to earn interest.

The profit and interest you can earn in a SAFE account is higher than at a bank.

Open a savings account with LiteFinance and earn up to 20% per annum. Interest payments are made every day!

SAFE benefits

  • Deposit account in US dollars
  • Floating rate, up to 20%
  • Interest rate depends on your trading volume
  • Daily interest payments
  • No minimum or maximum deposit limits
  • Withdrawals at any time

How does a SAFE account work?

  • The client tops up their SAFE account in the Client Profile area using a transfer from their trading accounts or any available payment system.
  • The client trades every day or copies trades in their trading account with LiteFinance
  • The interest rate is subject to the trading volume the client accomplishes in their trading accounts
  • The interest on the money held in a SAFE account is calculated and paid every day

How is a floating interest rate calculated?

Deposit interest depends on the client’s trading volume accomplished in their trading accounts.

The maximum interest rate is 20%.

Floating Interest Rate (FIR,% per annum) is calculated daily according to the formula:

FIR% = (K × L) / T, where

K is the company’s participation factor set at 10.1

L is the number of lots traded and completed in the past 30 days in the client’s trading accounts

T is the current deposit in a SAFE account increased by 5%

The client receives an interest payment daily based on the annual interest rate calculated. The daily interest payment is calculated as follows:

DailySUM = ((Balance × FIR%)/100) / 360, where

Balance – SAFE account minimum balance on the previous day, for which a daily payment is calculated.

How is deposit interest % generated?

To earn higher interest, the client needs to trade actively. The more lots the client trades, the higher their floating interest rate is.

Australian Dollar Trends Remain Intact Despite Some Stalls. Where to for AUD/USD?

Australian Dollar Trends Remain Intact Despite Some Stalls. Where to for AUD/USD?

AUD/USD TECHNICAL ANALYSIS

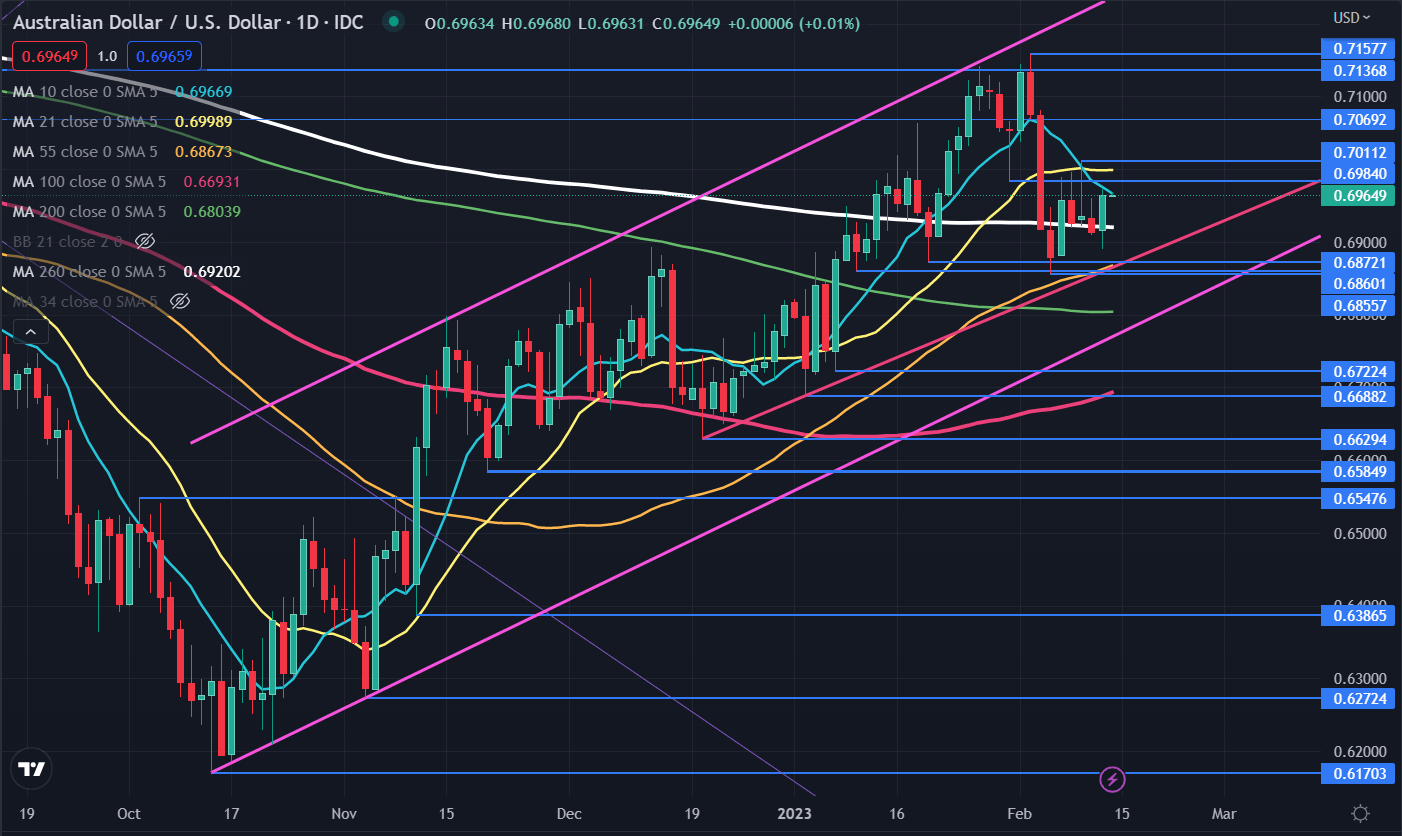
The Australian Dollar has steadied this week and it remains within an ascending trend channel.

AUD/USD had a look lower last week as it briefly dipped below 2 previous lows, but it was unable to sustain the bearish tilt.

That move also went below the long-term 260-day simple moving average (SMA). The inability to follow through could suggest that the dip has been rejected for now.

This has set up a potential support zone in the 0.6855 – 0.6870 area which currently coincides with a short-term ascending trend line and the 55-day SMA.

Further down, support might be at the 200-day SMA which is currently near the psychological level of 0.6800.

Below there is a longer-term ascending trend line at 0.6750 ahead of the previous lows of 0.6722 and 0.6688. The 100-day SMA lies between those price points and may lend support.

On the topside, resistance could be offered at the breakpoints and prior peaks of 0.6984, 0.7011, 0.7137 and 0.7158. The latter is the 12-month high that failed to break the topside of the ascending trend channel. That line might continue to provide resistance, currently dissecting at 0.7240.

Looking at momentum, the SMAs could indicate some sideways price action with a possible slight bullish bias. While the price is above the medium and long-term 55-, 100-, 200- and 260-day SMAs, it is below the short-term 10- and 21-day SMAs.

AUD/USD DAILY CHART

image1.png

AUD/JPY TECHNICAL ANALYSIS

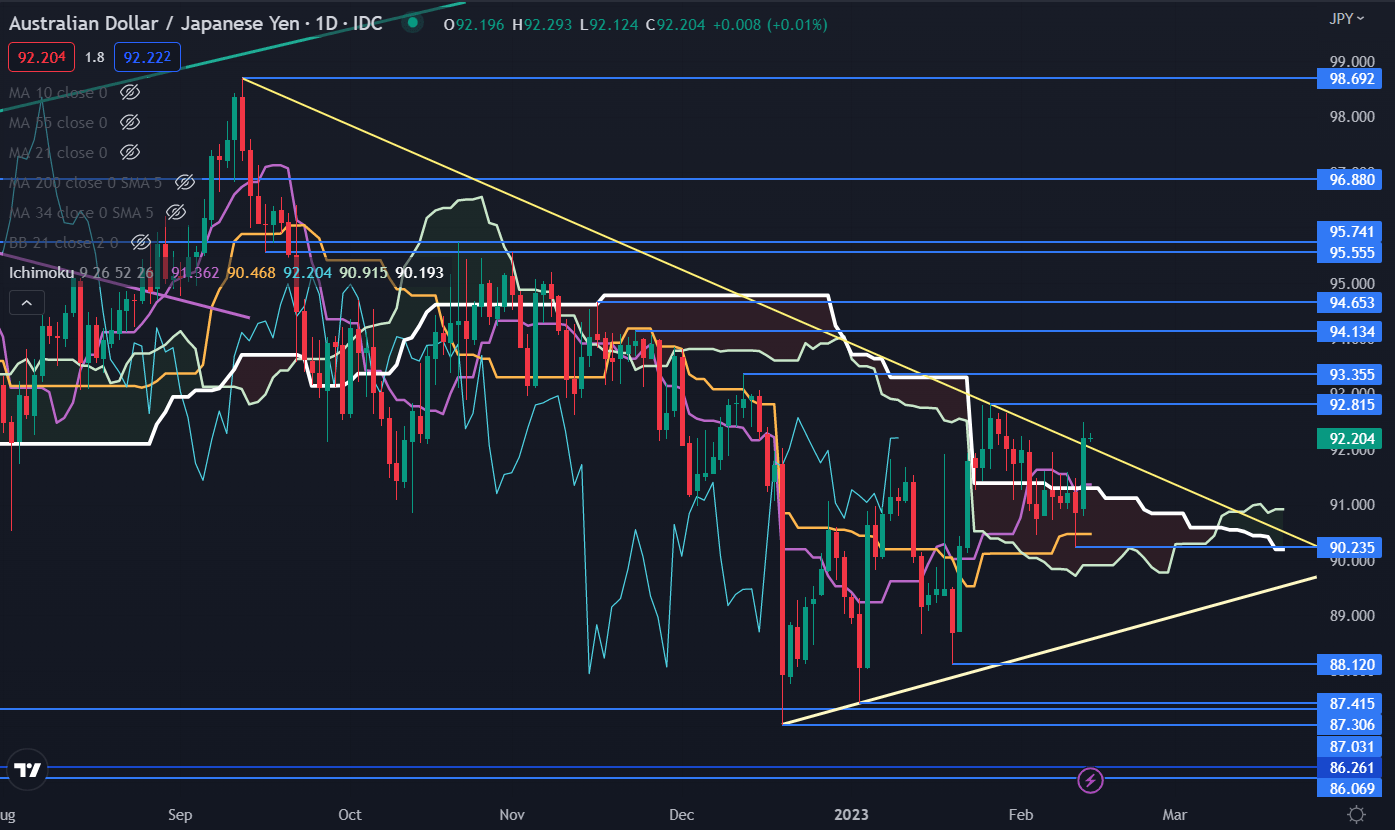
AUD/JPY has broken above a descending trend line and made a 2-week high overnight.

If it remains above the trend line, it may indicate that bearish momentum is fading, and a possible reversal could unfold.

The price once again moved above the Ichimoku Kinko Hyo, which is often referred to as the Ichimoku Cloud, which might suggest that bullishness may evolve.

A move back below the Senkou Span A (Leading Span A) could question the bullish slant.

Resistance might be at the previous peaks of 92.82, 93.36, 94.13 and 94.65.

On the downside, support may lie at the prior lows of 90.23, 88.12, 87.41, 87.30 and 87.03. An ascending trend line could provide support, currently at 88.60.

AUD/JPY DAILY CHART

image2.png


US Dollar Price Action Setups: EUR/USD, AUD/USD, USD/JPY, GBP/USD

US Dollar Price Action Setups: EUR/USD, AUD/USD, USD/JPY, GBP/USD

EUR/USD Daily Chart – Rising Wedge Breakout Still in Focus

The Euro may remain vulnerable to the US Dollar from a technical standpoint. That is because last week, EUR/USD continued to make downside progress after clearing under a Bearish Rising Wedge chart formation. Immediate support is the 23.6% Fibonacci retracement level at 1.068, which was reinforced over the past 24 hours as prices were unable to clear this floor. Further upside progress, especially through the 1.0713 – 1.0787 inflection zone, would place the focus on the floor of the wedge. Otherwise, extending losses exposes the 38.2% level at 1.0461.

EUR/USD Daily Chart – Rising Wedge Breakout Still in Focus

AUD/USD Daily Chart – Head & Shoulders Brewing

The US Dollar could be readying to extend gains against the Australian Dollar. In addition to a Rising Wedge, a bearish Head & Shoulders chart formation is brewing on the daily chart below. The neckline seems to have been reinforced around 0.6893. A confirmatory breakout under this price could open the door to extending losses toward the 100-day Simple Moving Average (SMA). Otherwise, pushing above 0.7009 – the right shoulder – opens the door to revisiting the January high where key resistance stands around 0.7137.

AUD/USD Daily Chart – Head & Shoulders Brewing

USD/JPY Daily Chart – Trendline Breakout Remains in Focus

The US Dollar remains higher against the Japanese Yen since USD/JPY broke above the falling trendline from the end of last year. Still, the 50-day SMA is holding as critical resistance, maintaining the broader downside focus. A confirmatory push above the 23.6% Fibonacci retracement level at 133.05 would likely offer an increasingly bullish outlook, placing the focus on the 38.2% Fibonacci retracement level at 136.66. Otherwise, a turn lower places the focus on the January low at 127.22.

USD/JPY Daily Chart – Trendline Breakout Remains in Focus

GBP/USD Daily Chart – Prices Bounce off Double Top Neckline

The US Dollar continues consolidating against the British Pound. GBP/USD recently bounced off the neckline of a Double Top chart formation around 1.1951. This followed an emergence of a Doji candlestick pattern, which showed indecision as prices hit support on the way down. That has opened the door for prices to revisit the critical 1.2293 – 1.2444 resistance zone. Key resistance is the 50-day SMA. Clearing the latter opens the door to face last month’s high. Otherwise, breaking under the neckline exposes the 100-day SMA.

GBP/USD Daily Chart – Prices Bounce off Double Top Neckline