
On this week’s Market Movers Asia with Rituparna Nath: * China’s construction steel demand recovery seen modest. * Aluminum prices volatile on possible output cuts in Yunnan.. * Corn arrives in China from Brazil under new bilateral pact.

On this week’s Market Movers Asia with Rituparna Nath: * China’s construction steel demand recovery seen modest. * Aluminum prices volatile on possible output cuts in Yunnan.. * Corn arrives in China from Brazil under new bilateral pact.

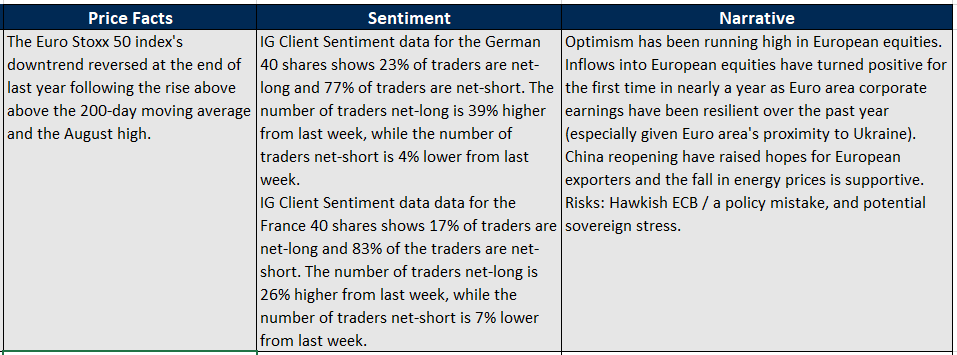
Breadth market indicators and technical charts suggest that the Euro Stoxx 50 index could have some more upside, albeit after a brief pause.
Since the start of this month, about 90%-94% of the members in the Euro Stoxx 50 index have been at their respective 200-day moving averages. Data from 2002 shows that when 90%-94% of index constituents have been above the long-term moving average, the index has been up 79% of the time over the subsequent 90 days (see distribution plot).
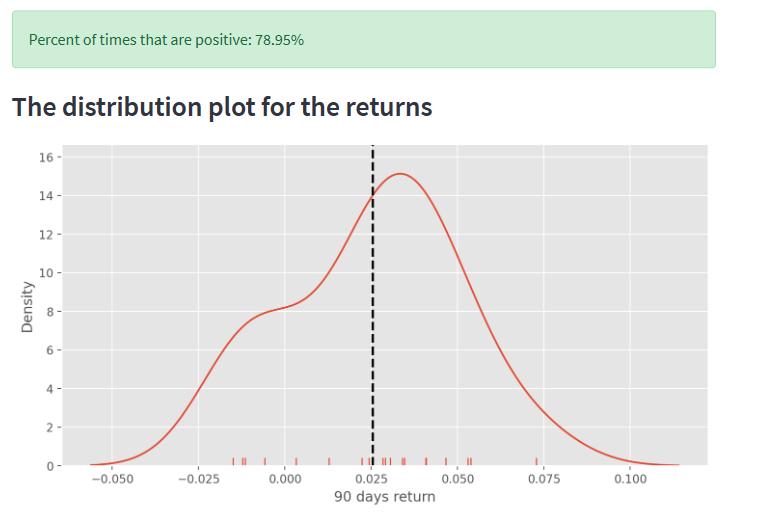
Source Data: Bloomberg; Chart Created by Manish Jaradi Using Python. Note: The study is done with a minimum 5-month gap between two readings above 90%.
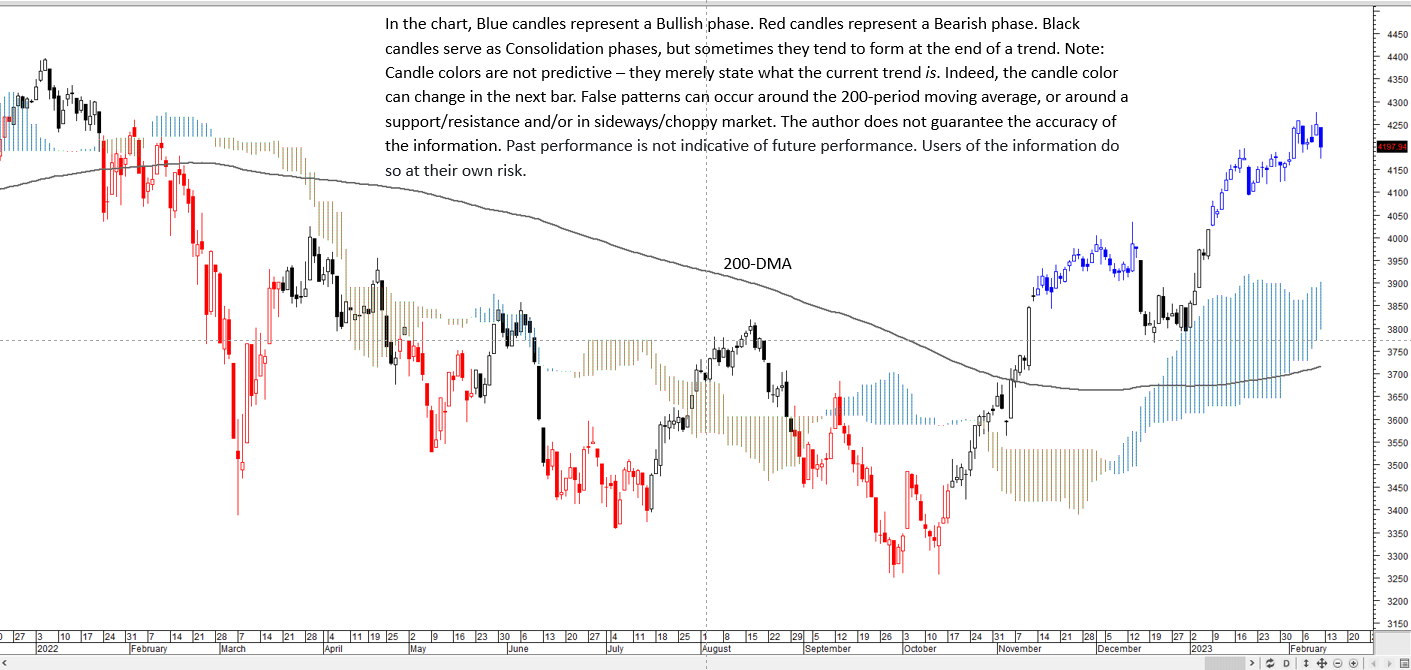
On technical charts, the index’s break toward the end of last year above a tough ceiling on the 200-day moving average and the August high of 3819 confirmed that the 2022’s downtrend has reversed. The higher-top-higher-bottom formation since the break indicates that the trend is up.
However, a negative momentum (as measured by the 14-day Relative Strength Index) divergence on the daily chart suggests that the rally is losing steam. A bearish divergence occurs when rising index levels are associated with declining/flattening momentum readings. A pause/minor retreat can’t be ruled out in the short term.
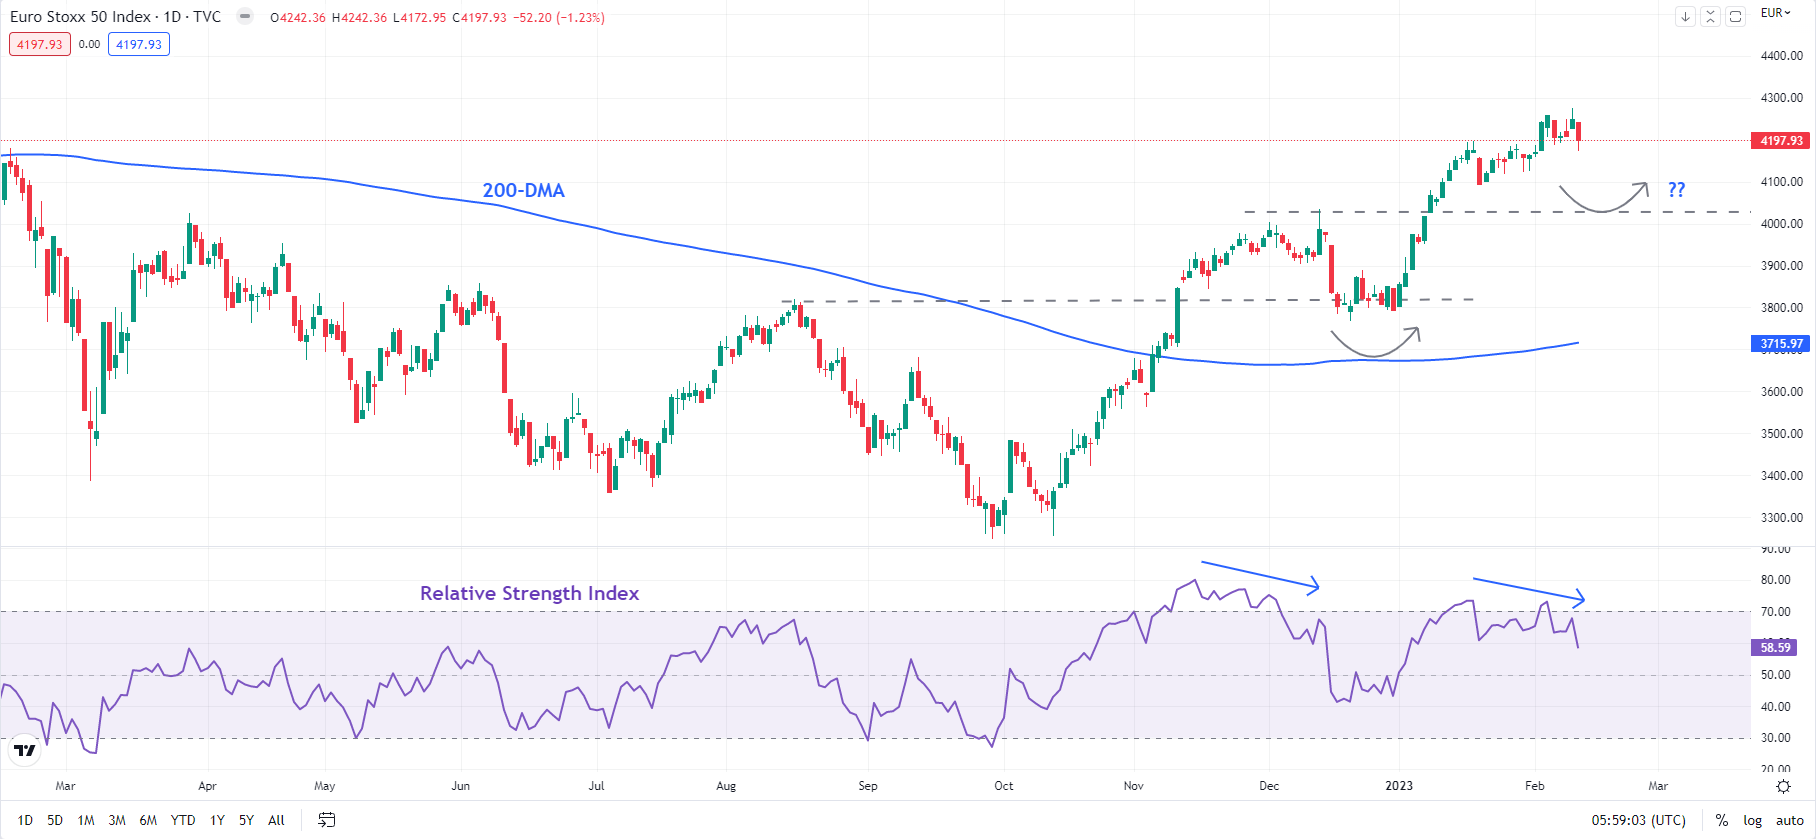
On the downside, there is immediate support at the January low of 4093, followed by stronger support at the December highs of 4000-4035. The brief retreat in November-December was associated with a similar divergence and followed by a rebound from resistance-turned-support at the August high. Only a break below 4000-4035 would indicate that the upward pressure had faded in the interim.

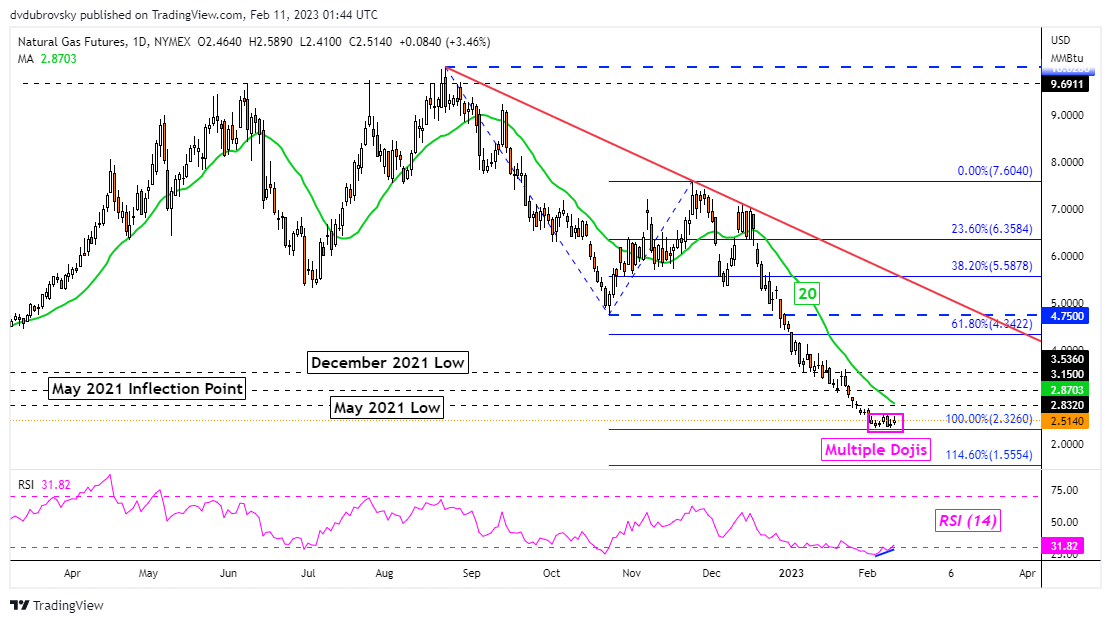
Natural gas prices managed to end last week on a positive note, albeit it was very lackluster. The commodity gained just 4.32% over the past 5 trading sessions, which in the context of consistent losses since the second half of last year, is barely noticeable. Still, it did mean that an 8th consecutive week of losses was avoided, finally bringing the longest losing streak since October to an end.
Prices were unable to clear the March 2021 low at 2.422 for 2 weeks in a row. Still, the weekly candle shows little signs of a reversal brewing as support was reinforced. Moreover, the anticipated trajectory of the bearish Head & Shoulders from last year remains in focus. If prices reach the target, it could mean testing lows from 2020. The latter is a range between 1.44 and 1.61.
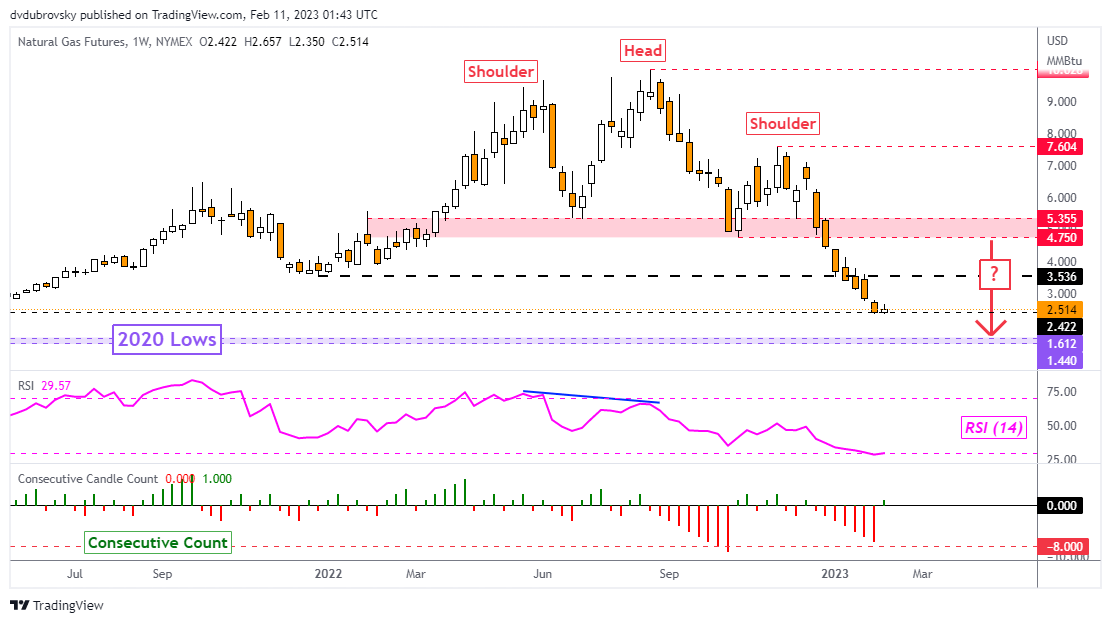
Taking a look at the daily chart, we can see that multiple Doji candlestick patterns have been forming since prices approached the 100% Fibonacci extension level at 2.326. This is an increasing sign of indecision, which can at times spell a reversal within the context of trending markets. Positive RSI divergence is also present, showing that downside momentum is fading.
A turn higher would likely place the focus on the 20-day Simple Moving Average (SMA). The latter could reinstate the dominant downside focus. If not, a confirmatory upside close above the SMA could open the door to a broader reversal. That would place the focus on lows from December 2021 around 3.536. The latter could hold as new resistance.
Otherwise, extending lower would place the focus back on the downside. That exposes the 114.6% extension at 1.555 towards lows from 2020.

The Australian Dollar is in the crosshairs of accelerating domestic price pressures and global central banks re-asserting their hawkish wares.
Reserve Bank of Australia (RBA) Governor Philip Lowe will be testifying before the Senate this week. Another grilling of the effectiveness of the bank’s communication methods appears likely to be at the top of the agenda.
On Wednesday, Mr Lowe will appear before the Senate estimates committee and then on Friday he will deliver his semi-annual testimony to the House of Representatives Economics committee.
Wedged in between those public appearances will be jobs data on Thursday.
The pandemic induced ultra-loose monetary and fiscal policy across the globe. With so much uncertainty at the time, that response was understandable. Aside from China, the pandemic is mostly over in the major economies.
For central banks, they have had to flick the ugly lights on, turn the music off and let everyone know that the party is over. The dirty deed of free money now has a price that needs to be paid in order to return economies toward focussing on productivity gains.
In Australia, a favourite pastime for some parts of the mainstream media is to invoke the mortgage belt to run for their torches and pitchforks whenever there is a rate hike.
Unfortunately, such popularism gains more traction than it should and only encourages these outlets to continue to undermine rationale economic management to sell more copy.
The reality is that high and unstable inflation creates uncertainty and increases the cost of capital to a more expensive level than it would otherwise be with low and stable inflation. A significant aspect of pricing debt is the outlook on inflation expectations.
If this component carries a high degree of risk, the return required to justify the bond investment will also be higher, adding to the debt burden.
This may create a drag on national productivity which could lead to a long-term lower standard of living than would otherwise be the case.
So, while some politicians in Canberra might be salivating at the prospect of shifting the blame of tighter financial conditions onto the RBA, it is merely the cost of the deeds of the past.
For the Aussie Dollar, the RBA is in a race with other global central banks to raise rates to the point where demand is suppressed enough to take the heat out of inflation.
Last week highlighted that those bankers with the loudest hawkish voices are being heard and their currencies could continue to respond in kind, at least in the short-term, until another central banker says something.
The gumption of the RBA in the meetings ahead may drive AUD/USD. While cash rates remain in favour of the US Dollar, bond spreads at the 2- and 10- year part of the curve are starting to move in favour of the AUD to start the week.
AUD/USD CHART


Precious metals may have retreated most recently, but technical charts suggest it may be too soon to conclude that the three-month-long uptrend is over.
The upward pressure in gold and silver has faded over the past couple of weeks after surprisingly strong US jobs data, triggering a repricing higher in US Fed rate expectations. US rate futures are pricing the Fed’s target rate to peak over 5% in July Vs below 5% at the end of last month.

In this regard, Philadelphia Federal Reserve President Patrick Harker’s remarks on Friday were comforting – he flagged the prospect of rate cuts in 2024 should inflation continue to ease and did not alter his view that moving to smaller interest rate rises would be a good strategy. Harker echoed Fed Chair Powell’s disinflation tone last week.
A key focus is now on US inflation data due Tuesday. US monthly consumer prices and core CPI likely rose 0.4% on-month in January. Core CPI likely rose 5.5% on-year and the headline inflation rose 6.2% on-year last month. A softer-than-expected data could reaffirm the view that US inflation is peaking and soothe investors’ nerves.

On technical charts, while XAU/USD’s fall below 1895-1900 confirms the upward pressure has faded a bit in the short term, it may not be sufficient to conclude that the uptrend is over. Gold continues to hold above the strong support area of 1775-1810, coinciding with the 200-day moving average and the lower edge of the Ichimoku cloud.
Moreover, the retreat so far is less than 38.2% of the rise from November – retracements of 38.2%-50% are considered to be reasonable, and not necessarily the end of the prevailing trend. However, gold would need to break above the support-turned-resistance at 1895-1900 for the immediate downward risks to ease. In sum, the broader bullish view for gold remains intact,unchanged from the previous updateeven though the short-term outlook is Neutral.

Silver is approaching a vital cushion area, including the 200-day moving average and the lower edge of a rising channel from mid-2022 (around 21.00-22.00). This follows a break below a horizontal trendline from early January at about 23.10, opening the way toward the mid-December low of 22.50, roughly the price objective of a sideways topping pattern.For the imminent downside risks to fade, XAG/USD would need to break above 23.00-23.10.

Crude oil gave up some ground today after making a 2-week peak on Friday. The WTI futures contract has traded under US$ 79 bbl while the Brent contract is approaching US$ 85.50 bbl.
Concerns around another hot US inflation figure on Tuesday have led to speculation that the Federal Reserve might need to be more hawkish than previously anticipated.
The futures and swaps markets are now looking at a peak in the Fed funds target rate above 5.20% this year, well up from around 4.9% a fortnight ago.
The US Dollar has inched higher so far today, with the largest gains seen against the Japanese Yen.
The next Bank of Japan (BoJ) Governor will be announced on Tuesday with speculation that Kazuo Ueda will get the nod. His standing toward monetary policy is somewhat unclear.
The 10-year Japanese Government Bond (JGB) has spent the day bumping up against the BoJ’s upper limit of 0.50% while USD/JPY traded above 132.00.
Treasury yields have held onto Friday’s move higher with the benchmark 10-year note near 3.75% at the time of going to print. Gold is a touch weaker near USD 1,860 an ounce.
APAC equities are mostly in the red, with the exception of mainland Chinese indices which are slightly firmer. Futures are pointing to a soft start for Wall Street.
Looking ahead, after Swiss CPI, a couple of ECB and Fed speakers might provide markets with something to ponder.
The full economic calendar can be viewed here.
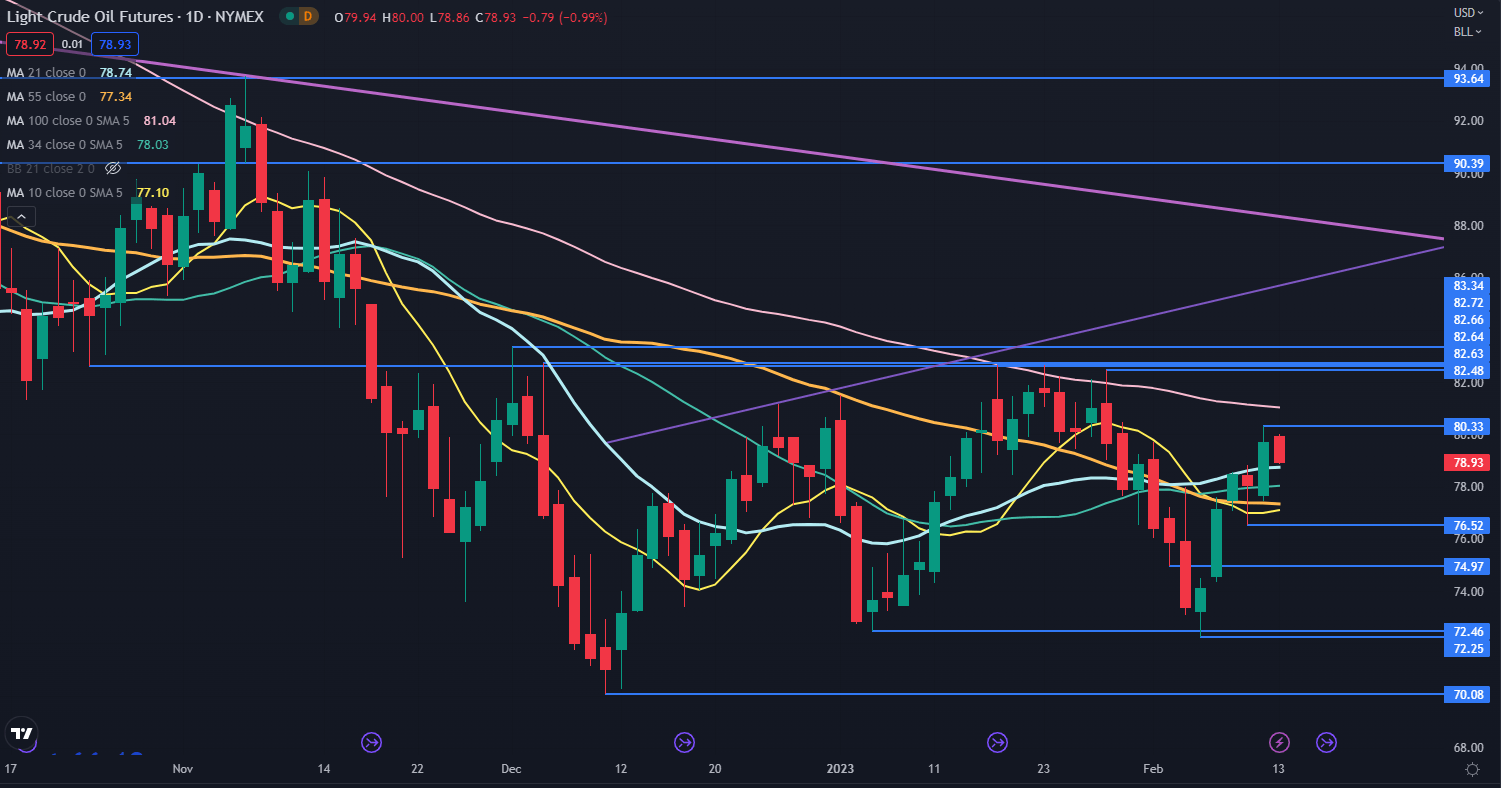
WTI crude oil has traded in a range of 70.08 – 83.34 for 3 months.
When the price made a 2-week high on Friday, it moved above the 10-, 21-, 34- and 55-day Simple Moving Averages (SMA). If it continues to hold above these SMAs, bullish momentum might unfold.
Nearby resistance could be at Friday’s high of 80.33. Further up there could be a significant resistance zone in the 82.48 – 82.72 area, where there are several breakpoints and previous peaks.
On the downside, there could be support at the recent low of 76.52 ahead of the prior lows of 72.25 and 70.08.

The foreign exchange market’s reaction to economic data is one of the most important subjects for traders to consider, but also one of the most vexed.
The monthly round of official and private releases from around the world covers everything from inflation and employment to the forward-looking views of corporate purchasing managers. Together with central bank pronouncements, it forms what we might call the framework of foreign exchange trading.
Markets may well hunker down, losing both volume and volatility, in the run-up to an eagerly anticipated number. Official US labor market statistics are perhaps the most obvious example here. When the trading community expects serious gains or crushing losses the session can be subdued from Asia’s open and right across Europe as participants nurse suspicions or hopes. Even when the market expects neither many traders will – in financial journalism’s enervating cliché – “wait and see.”
This makes sense of course, enervating or not. Obviously, there’s a link between the economic performance of a country with a freely floating currency and the performance of that currency against its peers. At the most basic level a strong piece of economic data will boost a currency, a weaker one will tend to see it fall.
However, to take the matter no further would be a grave error. For one thing, individual pieces economic data tend to influence currencies in a very fleeting way. The gains provided by even a blockbuster, expectation-shattering number can be undone by the end of a day’s session, and well before that in some cases. It may even mean no more than a few minutes’ spike one way or another.
So, there’s clearly more to know about data and its effects.
The first and perhaps most important thing is that, while data provide the rhythm, the world moves to a monetarist cadence and central banks will always play lead. So, ultimately, the longer-term effects any piece of economic news must be considered with a view to how it might change monetary policy. No single data release is ever likely to do that, and markets would have caused to worry if it did. Central banks like to be ahead of the numbers, ready to tighten or loosen policy as needed before trends turn.
Therefore, we might see the markets only very briefly cheer strong retail sales, say, or powerful job creation. They might be great for the politicians, but, if inflation remains docile, they might not mean anything at all in terms of central bank policy changes. And if rates aren’t going up or coming down, then the longer-term effect of the data on the currency won’t amount to much.
Of course, these days docile inflation is little more than a happy memory across much of the world as war in Ukraine boosts both food and fuel prices at a time when post-Covid supply chain storms are still raging.
In July of this year, the United States Federal Reserve delivered a three-quarter point interest rate rise, something which would have been considered extraordinary monetary action for most of the past thirty years. And yet the US Dollar actually lost ground by the end of the session for, in its post-rate-hike remarks, the Fed left markets reasonably sure that future actions were going to be a lot more measured.
So, we can on occasion see the phenomena of a ‘dovish’ rate hike, or even a ‘hawkish’ rate cut. That’s when a central bank takes action but strongly implies that it has finished doing so, or that the barrier to more is extremely high. Higher interest rates have not been terribly helpful to rare-breed Sterling bulls this year either. The United Kingdom’s political and economic turmoil has left the market wondering if its economy can bare higher borrowing costs. The US certainly looks much better placed to do so.
With all this in mind, merely watching and reacting to pieces of economic news is unlikely to make for a satisfactory trading strategy. Indeed, the Dollar’s broad gains this year have rendered data watching all-but meaningless in many countries. Their currencies have fallen against the Greenback regardless of the numbers as the US currency reveals itself as the ultimate safe-haven play.
Competent traders know where the market is focused and where in the business cycle we are. What that tends to mean in practice is which specific data releases are most likely to trigger changes in the monetary mood music.
These can change dramatically over time. Older readers may well recall the days when western industrial production figures were the ones to watch for the best central bank steer. In more recent times unemployment figures took over. Policymakers were leery of wage inflation and, poised to “withdraw the punchbowl” if the labor market party showed any sign of getting out of hand.
Now of course inflation figures themselves are perhaps the ones which traders look at most obsessively, with prices’ stubborn elevation. One day, the focus will move on again. It always does. But a nuanced approach to trading economic data should remain a constant.

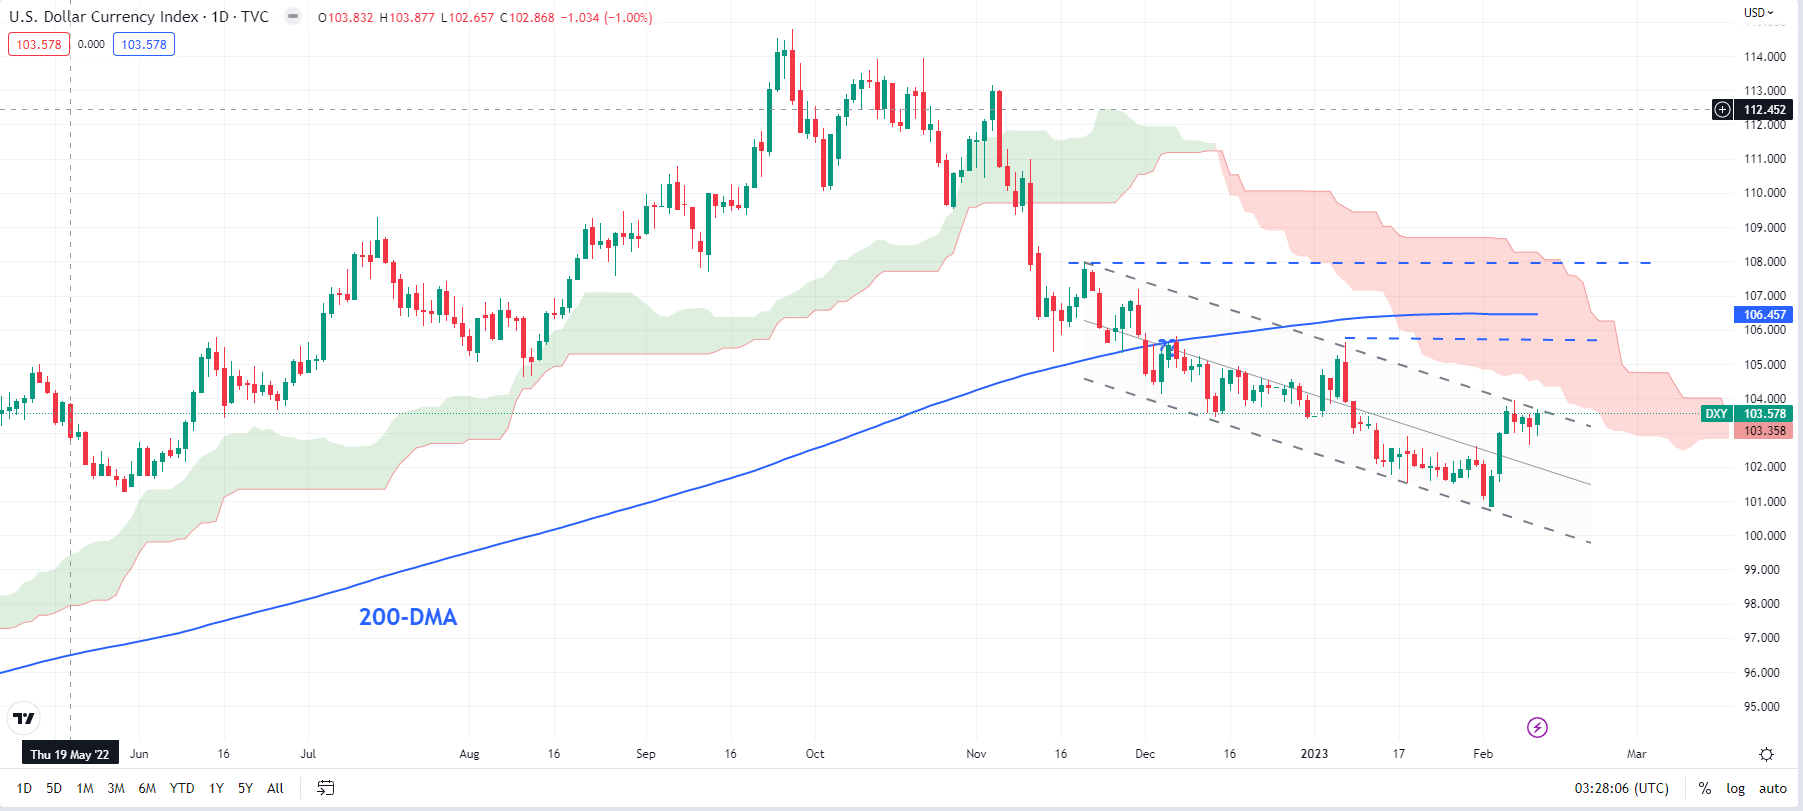
Technical charts suggest it may be too soon to conclude the end of the global US dollar slide. The recent jump in the greenback appears to be a consolidation/correction within the overall downtrend, at least on the daily charts (relevant for swing/positional traders). While the rebound may have occurred over the past couple of weeks, minor cracks in the US dollar’s decline had been emerging since mid-January (see“US Dollar Technical Outlook: Slide Showing Signs of Fatigue?”, published Jan. 14).
The US dollar index (DXY Index) is holding above solid support on the 89-week moving average (WMA), roughly around the June 2022 low of 101.30, and the lower edge of the Ichimoku cloud on the weekly charts. Asthe previous update highlighted, the 89-WMA has provided support several times in 2019 and 2020. There is quite a strong hurdle at Tuesday’s high of 104.00. A break above the cap could pave the way toward solid resistance at the January high of 105.65, slightly below the 200-day moving average (DMA), now at about 106.50. The index would need to break above the end-November high of 107.20 for the recent rebound to be more than just corrective.
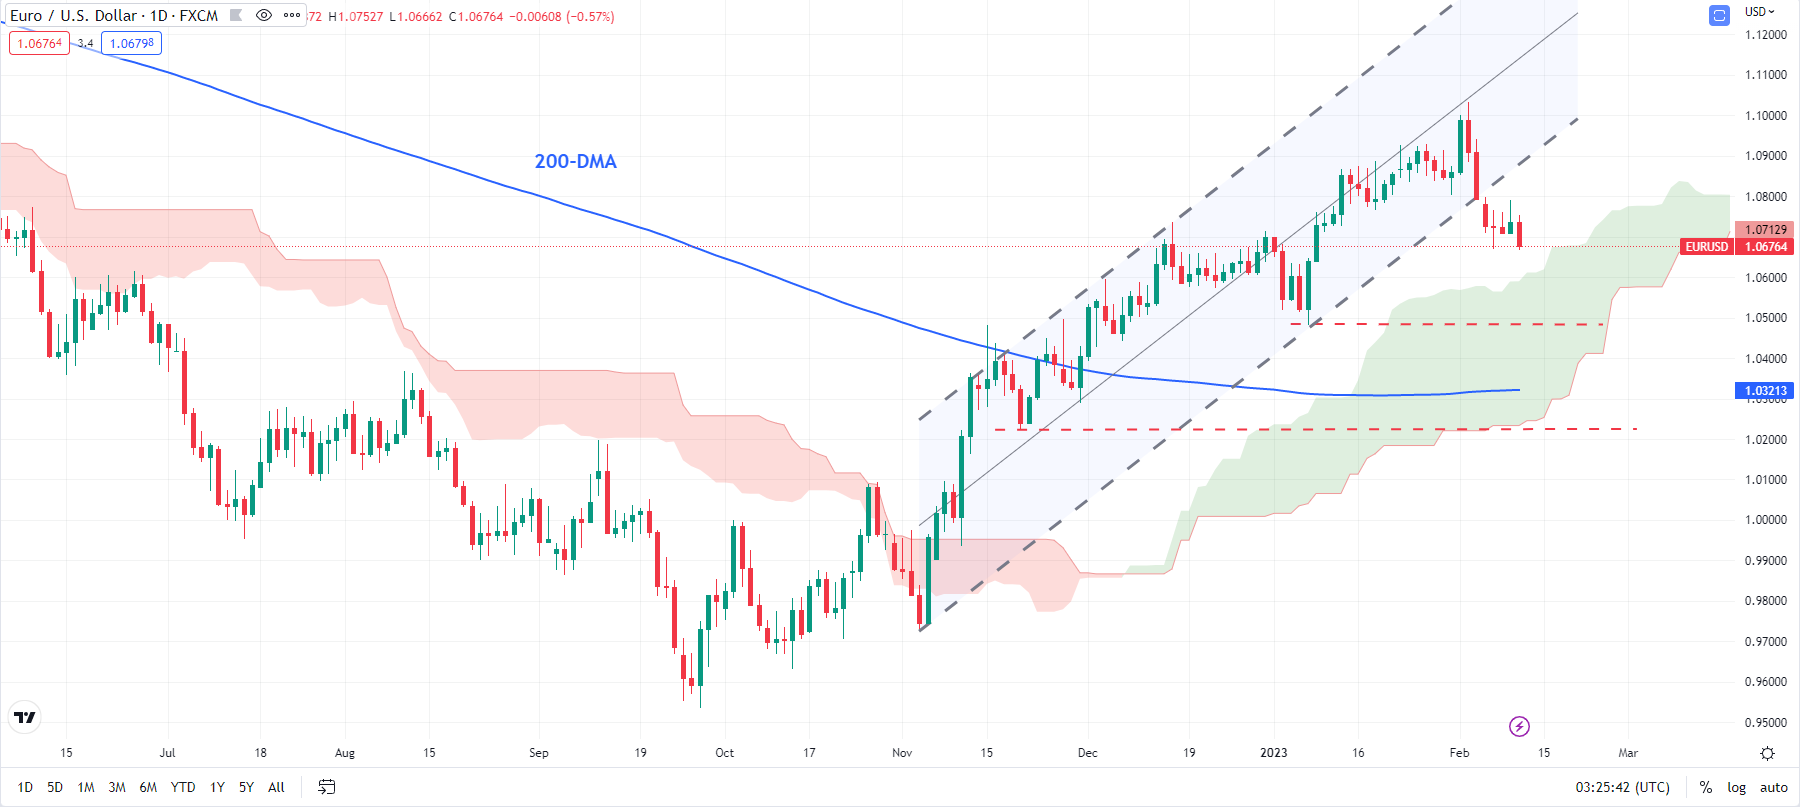
EUR/USD‘s drop below an uptrend line from November confirms that the immediate upward pressure has faded, but not necessarily over. The retreat has taken place from quite a strong resistance on the 89-WMA and the upper edge of the Ichimoku cloud. Having said that, EUR/USD hasn’t broken a price pivot yet on the daily chart. In this regard, the January low of 1.0485 is a vital cushion that coincides with the 200-DMA (now at about 1.0325). Any break below the 1.0325-1.0485 zone would confirm that the broader upward pressure had faded.
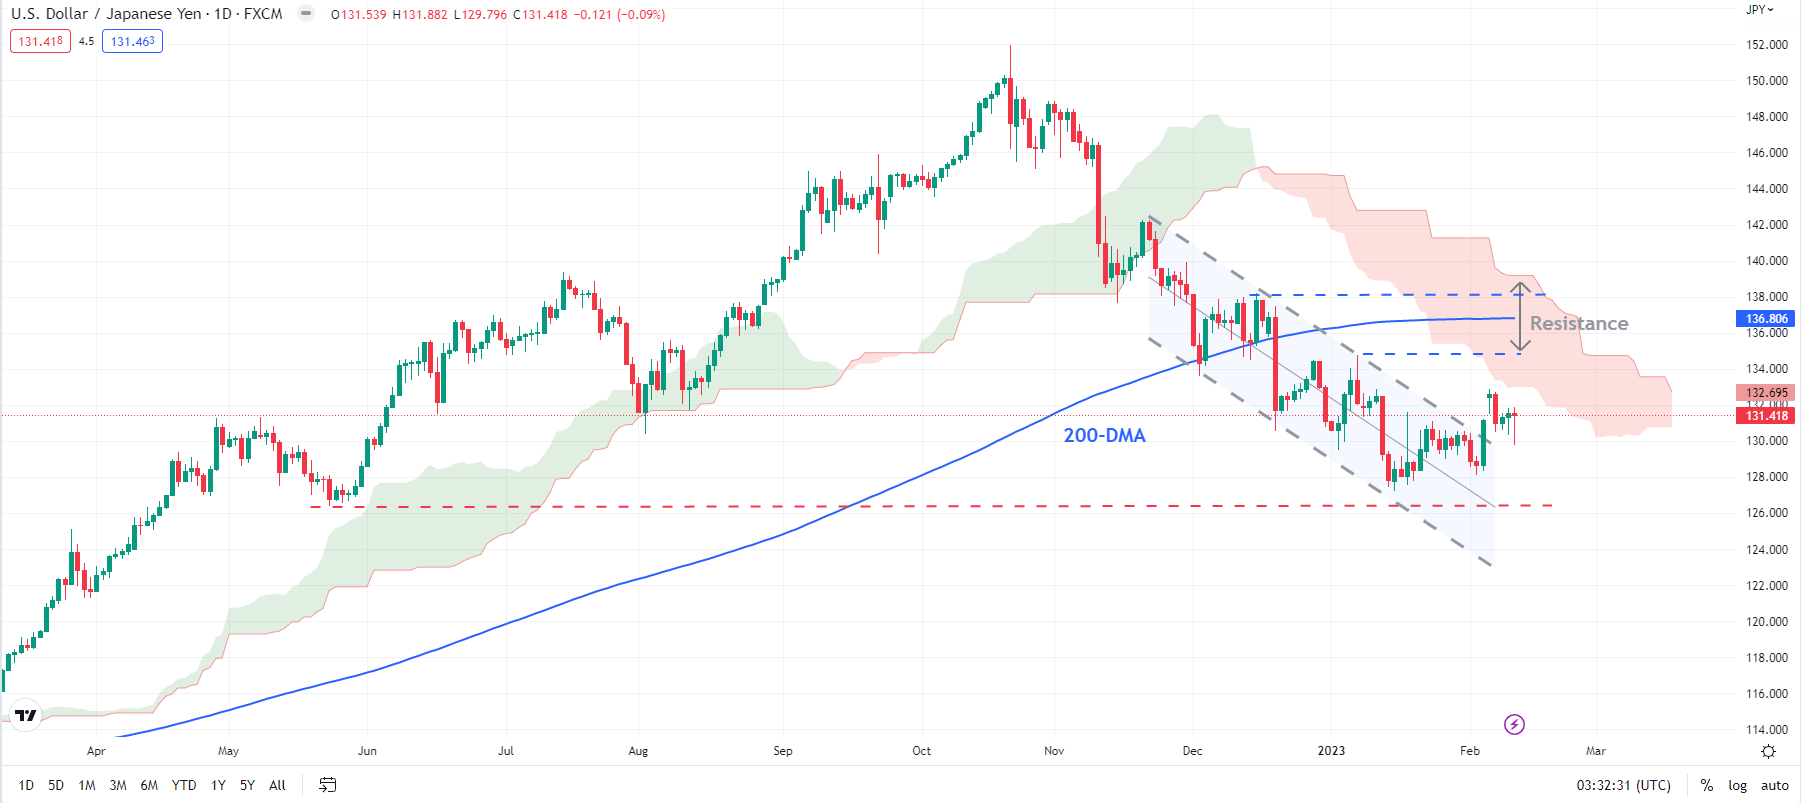
USD/JPY’s break above minor resistance on intraday charts on a horizontal trendline from late January indicates that the downtrend is losing steam in the short term, raising the odds of a range developing in the short term. This follows a rebound from near a fairly strong support area, including, the May 2022 low of 126.30. USD/JPY faces plenty of barriers that could limit the rebound, beginning with the January high of 134.80, and the 200-DMA, near the mid-December high of 138.15.
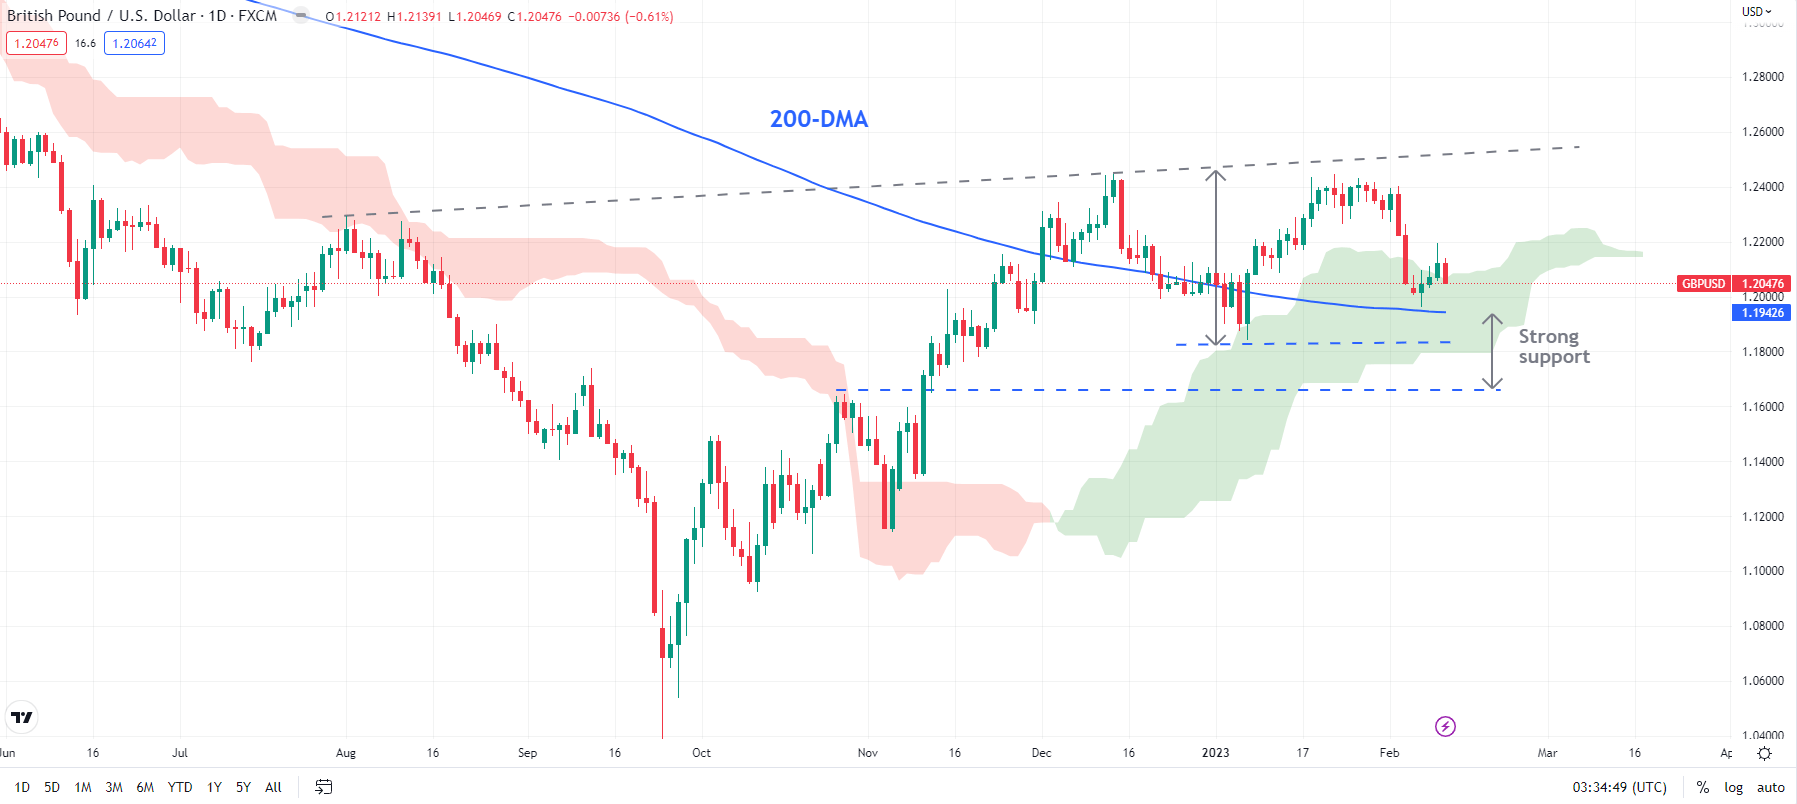
While the medium-term outlook for GBP/USD has been improving (becoming less bearish) in recent months (first highlighted in October), the near-term trajectory is less clear given the recent struggle to break past a key ceiling on the 200-DMA. For now, the 1.1800-1.2500 range remains intact (see the most recent update on GBP/USD highlighting the short-term scenario). A decisive break above the upper end of the range would confirm a bullish outlook on the daily chart. On the other hand, a break below the lower end of the range would trigger a minor double top (the December and January highs), potentially opening the way toward 1.1250.
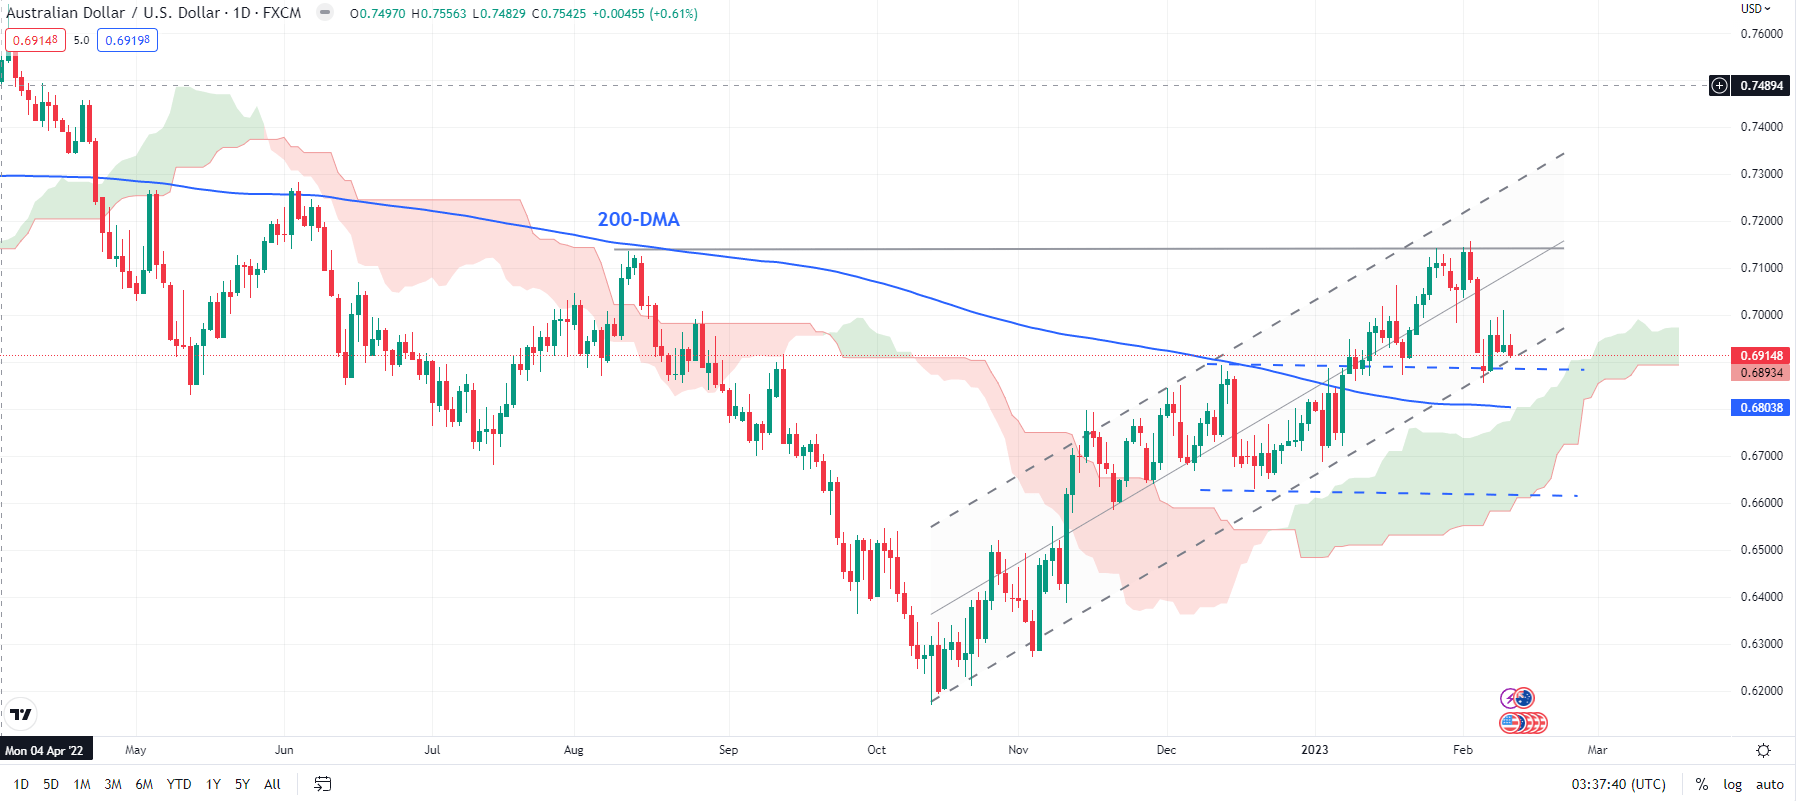
AUD/USD has nearly met the target of a minor double top pattern (the January and early-February highs) and is now testing a crucial cushion on a horizontal trendline at about 0.6850. This support is key, and any break below 0.6850 could trigger a minor head & shoulders-type pattern that would raise the odds of a drop toward the mid-December low of 0.6625. Immediate support is on the 200-DMA (now at about 0.6800). The higher-tops-higher-bottom pattern since late 2022 suggests that the broader trend remains up (see the recent AUD/USD update), even though the near-term outlook has shifted to neutral.

Global financial markets navigate through a rather challenging and constantly changing environment and gold is no different. Last week we had arguably one of the busiest schedules on the economic calendar that will have all year with three major central bank decisions, nonfarm payroll data and crucial PMI services data to name a few. That being considered it was the nonfarm payroll data and PMI data that stole the show, Significant sell off in the precious metal towards the end of last week, which has somewhat stabilized, as markets look ahead to next week’s crucial inflation print.
Now with this influx of economic data, comes a constant repricing of forward-looking expectations, which has the potential to facilitate choppy trading should the data contradict prevailing narratives (soft landing, resilient US economy, inflation fight not over).
Last week the Fed attempted briefly mention the disinflation that we had seen thus far but stress that rates are on track to head higher. The market perceived this as dovish and bought up equities as the dollar slid. Not long after, a super-hot labor market and a phenomenal recovery within the services sector reversed the direction of travel for gold and the dollar.
Gold has gotten off to an impressive start in 2023 and remains up for the year despite the recent sell off. As interest rates rise at a slower pace and inflation starts to ease off, real yields should turn lower, and this tends to support gold valuations. The chart below highlights the recent point of departure as the US 2-year yield accelerated above 4.5%, sending gold lower.
Daily Gold Chart Compared with US Treasury 2-Year Yields

Source: TradingView, prepared by Richard Snow
US dollar trends will also guide gold movement as a higher dollar makes gold more expensive for foreign buyers and a lower dollar eases the cost of the transaction for the dollar denominated metal.
Inflows into the world’s largest gold ETF (SPDR Gold Trust) are net positive for the year despite the selloff, according to the most recent data. This highlights the change in fortune for the yellow metal from last year which saw a net outflow of more than $2.4 billion.
Etf.com GLD ETF Net Flows for 2023 to date

While gold’s positive correlation with inflation is better observed over the long-term, the correlation between the two breaks down over the short to medium term but since it is such a massive market theme right now, inflation should still be monitored. Inflation data guides treasury yield dynamics which also feeds into the value of the US dollar. Yields and the USD have more of an effect on recent gold prices than the actual level of inflation. Forecasts suggest there will be another round of lower core and headline inflation for the month of January.


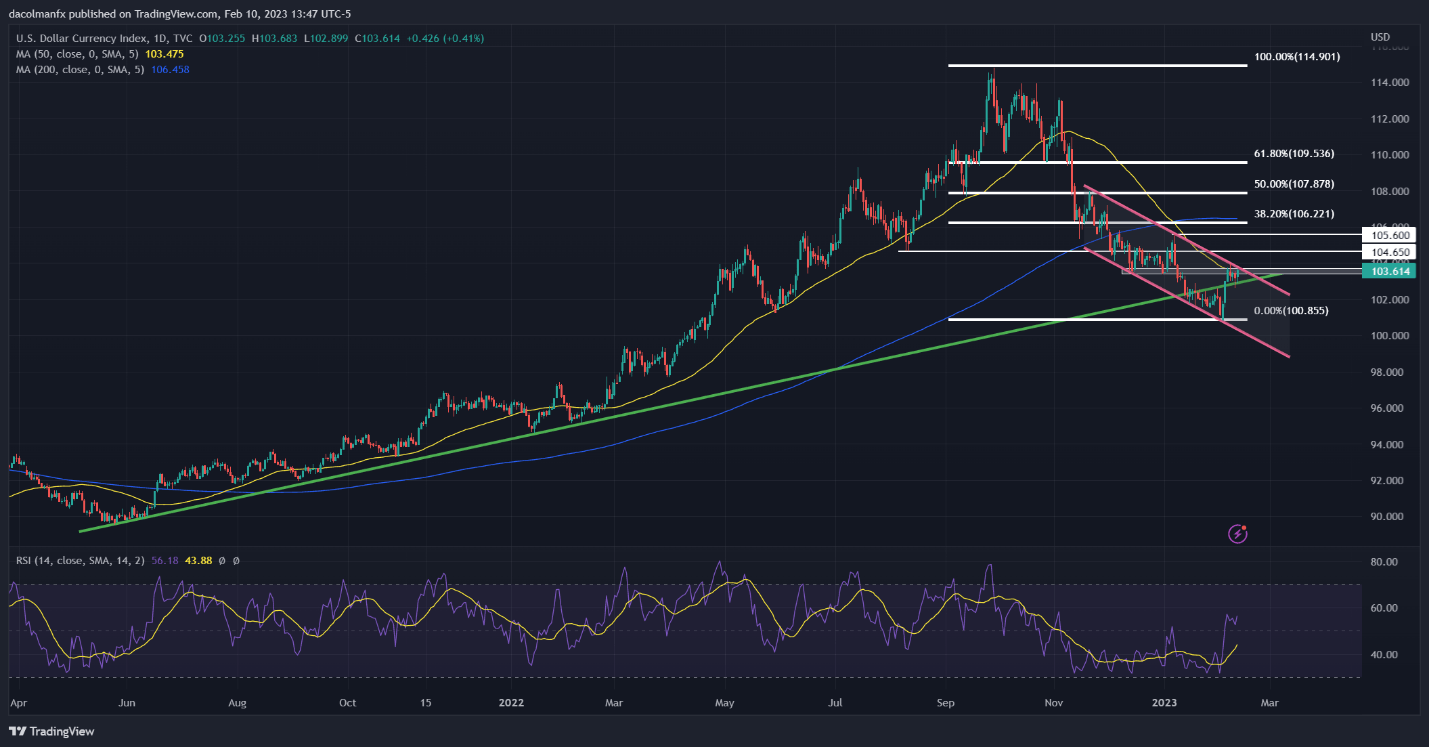
The U.S. dollar, as measured by the DXY index, had another solid week, up about 0.65% to 103.63 over the past five trading sessions, a move that allowed the greenback gauge to completely erased the losses recorded in January. The weekly gains were driven primarily by the strong jump in Treasury yields across the curve, which was triggered by expectations that the Fed will have to continue to raise borrowing costs and maintain a restrictive stance for longer than initially anticipated to win the battle against inflation.
The chart below shows how the 2-year and 10-year bond yields soared to more than four-week highs as traders repriced higher the monetary policy path, with the terminal rate now seen at 5.17% versus 4.92% earlier in the month, as shown by the 2023 Fed futures contracts included in the graph.
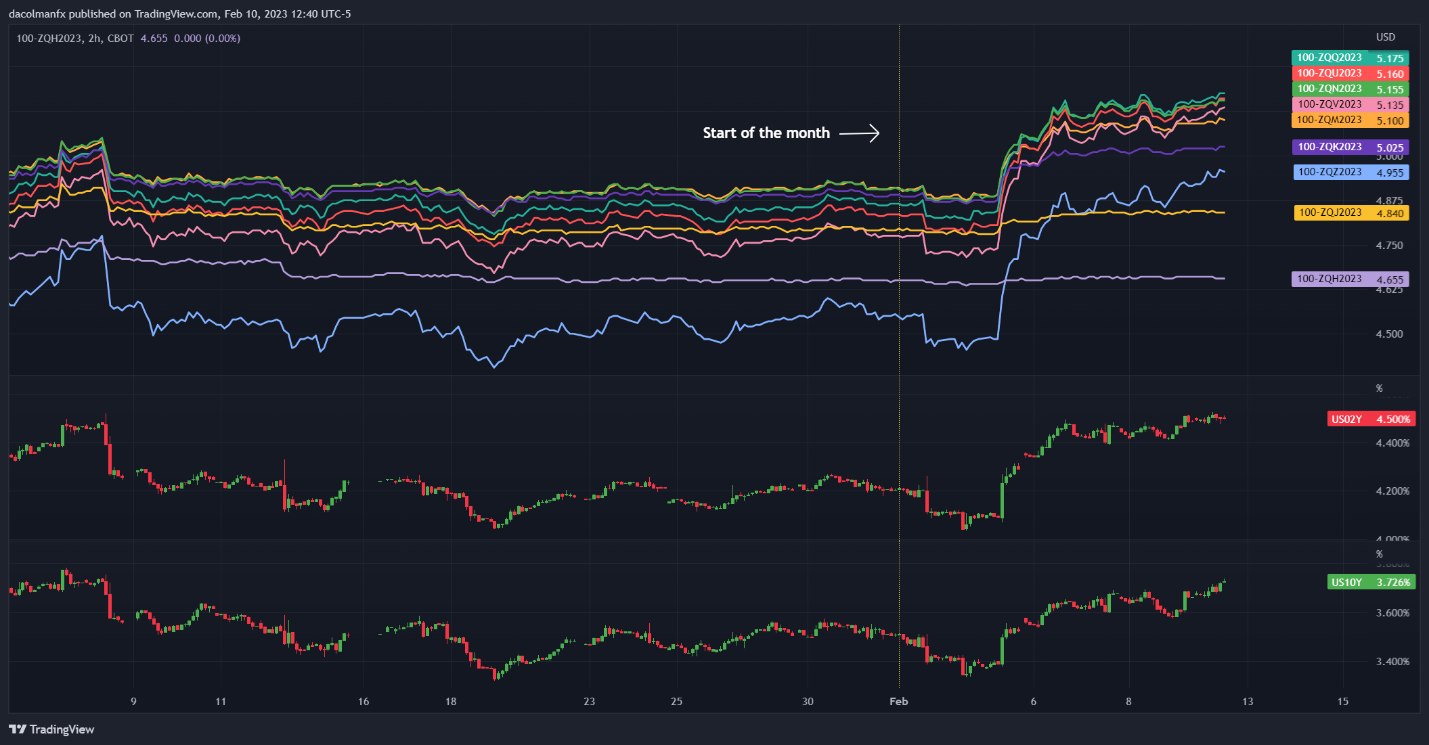
Robust labor market data has changed Wall Street‘s calculus, leading traders to reassess expectations for FOMC hikes in light of the fact that the American economy remains extremely resilient and able to tolerate further tightening. By way of context, the January jobs report showed the U.S. employers added 517,000 jobs, nearly double consensus estimates. Strong hiring at a time of multi-decade low unemployment could keep wage pressures and household spending skewed to the upside, reinforcing CPI dynamics and slowing its convergence towards the 2.0% target.
We’ll get a better sense of how consumer prices have been evolving soon when the U.S. Bureau of Labor Statistics releases last month’s inflation report on Tuesday. Both headline and core CPI are forecast to have risen 0.4% on a seasonally adjusted basis, a change that would reduce the annual rate by two-tenths to 6.3% and 5.5%, respectively. The directional improvement, however, could disappoint expectations, especially for the all-items gauge, due to the surge in gasoline prices, which spiked 4.4% at the outset of the year according to the American Automobile Association.
An undesirable CPI surprise could lead traders to reprice higher the trajectory for the terminal rate, while reinforcing the higher-for-longer message articulated by several Fed officials. This scenario could further bolster yields, especially those at the front-end of the curve, paving the way for the U.S. dollar to extend its recovery in the coming weeks. For this reason, the DXY index may be biased to the upside in the near term.
In terms of technical analysis, the U.S. dollar index appears to be approaching a key technical resistance near 103.80/104.00 after its recent rebound. If this area is decisively breached in the coming trading sessions, bulls could launch an attack on 104.65, followed by 105.60. On the flip side, if prices are rejected from current levels, initial support appears around the 103.00 handle, a floor created by a long-term rising trendline. Below this region, the focus shifts to the 2023 lows.
 Chat now!