Hang Seng Index Technical Outlook: A Pause, not a Reversal

Hang Seng Index Technical Outlook: A Pause, not a Reversal

HANG SENG INDEX TECHNICAL OUTLOOK – BULLISH

The recent retreat in Hong Kong shares appears to be a pause and not a reversal of the uptrend. Indeed, breadth market indications and technical charts continue to paint a bullish story over the coming weeks.

Price Facts, Sentiment, Narrative

image1.png

As of Thursday, 96% of the members in the Hang Seng Index (HSI) were above their respective 100-day moving averages (DMAs), not too far from 100% a week ago. Data from 2001 onwards suggests that when 100% of the members are above their respective 100-DMAs, the index has been up 60% of the time over the subsequent 120 days (see distribution plot of returns).

Distribution Plot of Returns Over 120 Days

Source data: Bloomberg; Chart created by Manish Jaradi using Python.

On technical charts, HSI has pulled back from stiff resistance on a horizontal line from early 2022 (at about), coinciding with the 89-week moving average. The drop below the lower edge of a rising channel from October confirms that the upward pressure has faded somewhat in the short term (somewhat because of the steepness of the channel. That is, even sideways price action can lead to a break below the channel, but it may not be necessarily bearish).

Hang Seng Index Daily Chart
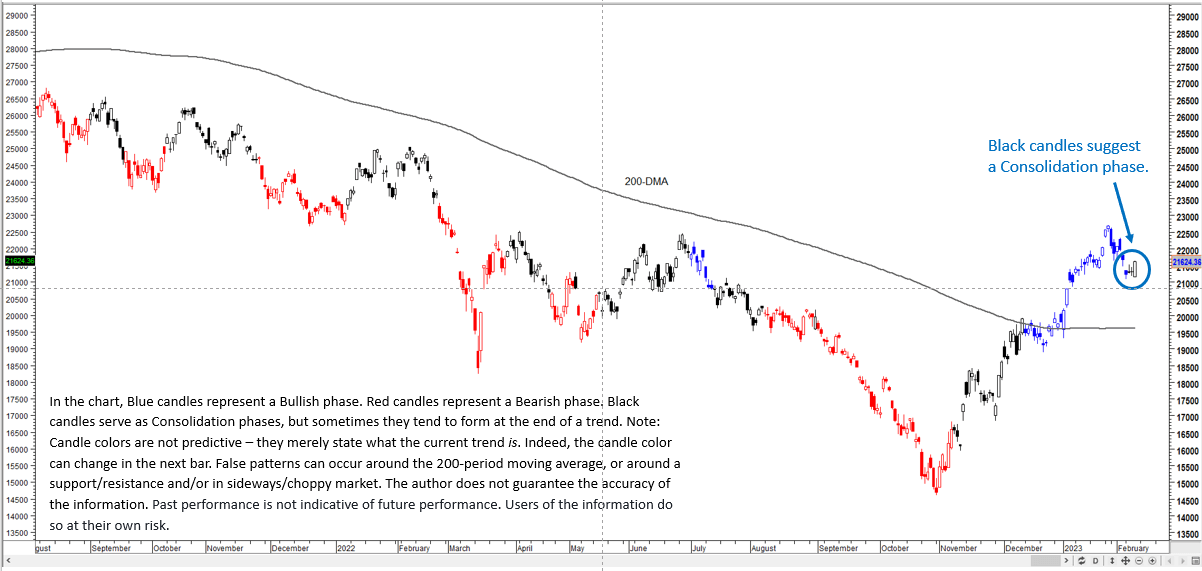
image3.png

However, the broader trend continues to be bullish, (see previous update for more details) as reflected by the Moving Average Convergence Divergence indicator in the positive territory and the color-coded candles. Having said that, consolidation doesn’t necessarily mean that the index can’t fall further – it could, but generally not deep enough to alter the broader trajectory.

Hang Seng Index Daily Chart

image4.png

In this regard, there is quite a strong converged cushion at the early-December high of 19926, coinciding with the 89-day moving average (DMA) and the 200-DMA. Stronger support is on the lower edge of the Ichimoku cloud cover (now at about 18000).

Dow Jones, S&P 500 Outlook: Retail Traders Boost Net-Long Bets. A Warning Sign?

Dow Jones, S&P 500 Outlook: Retail Traders Boost Net-Long Bets. A Warning Sign?

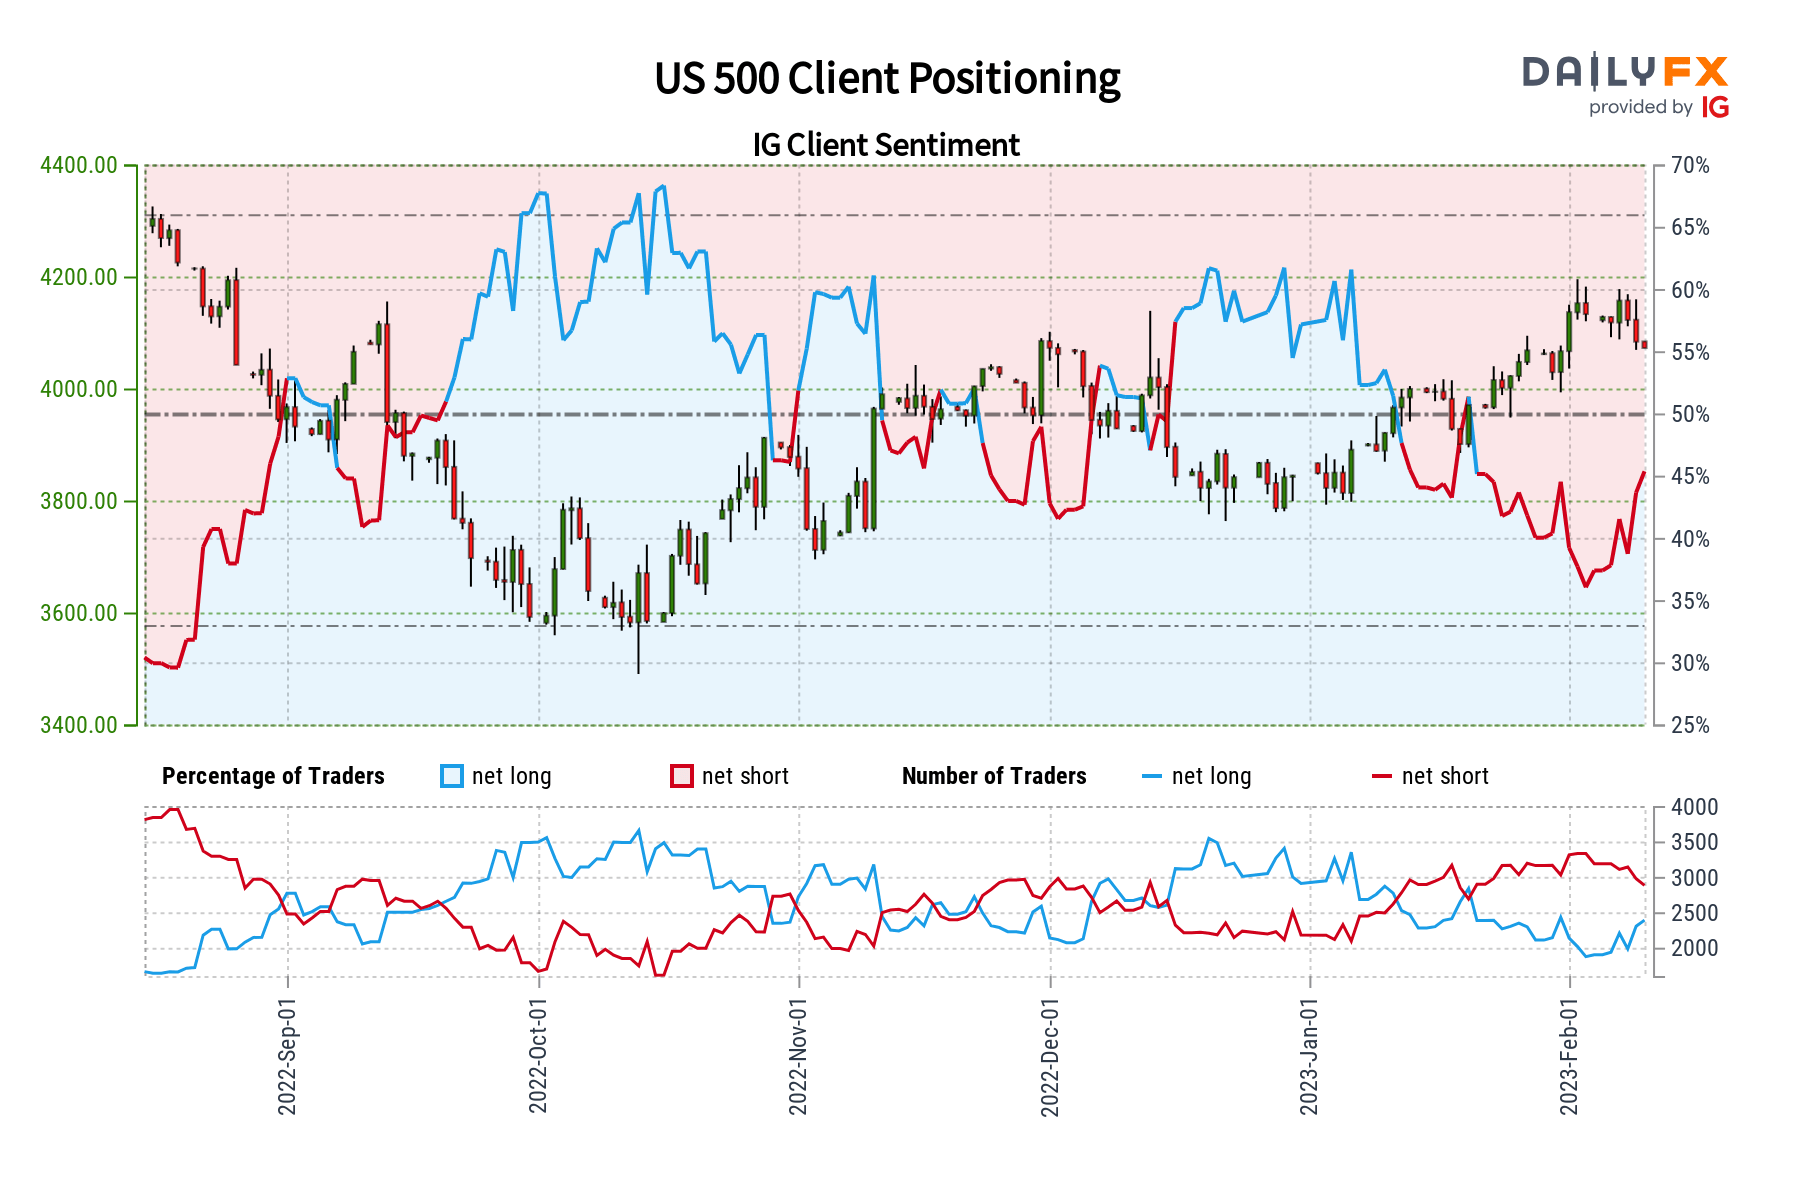
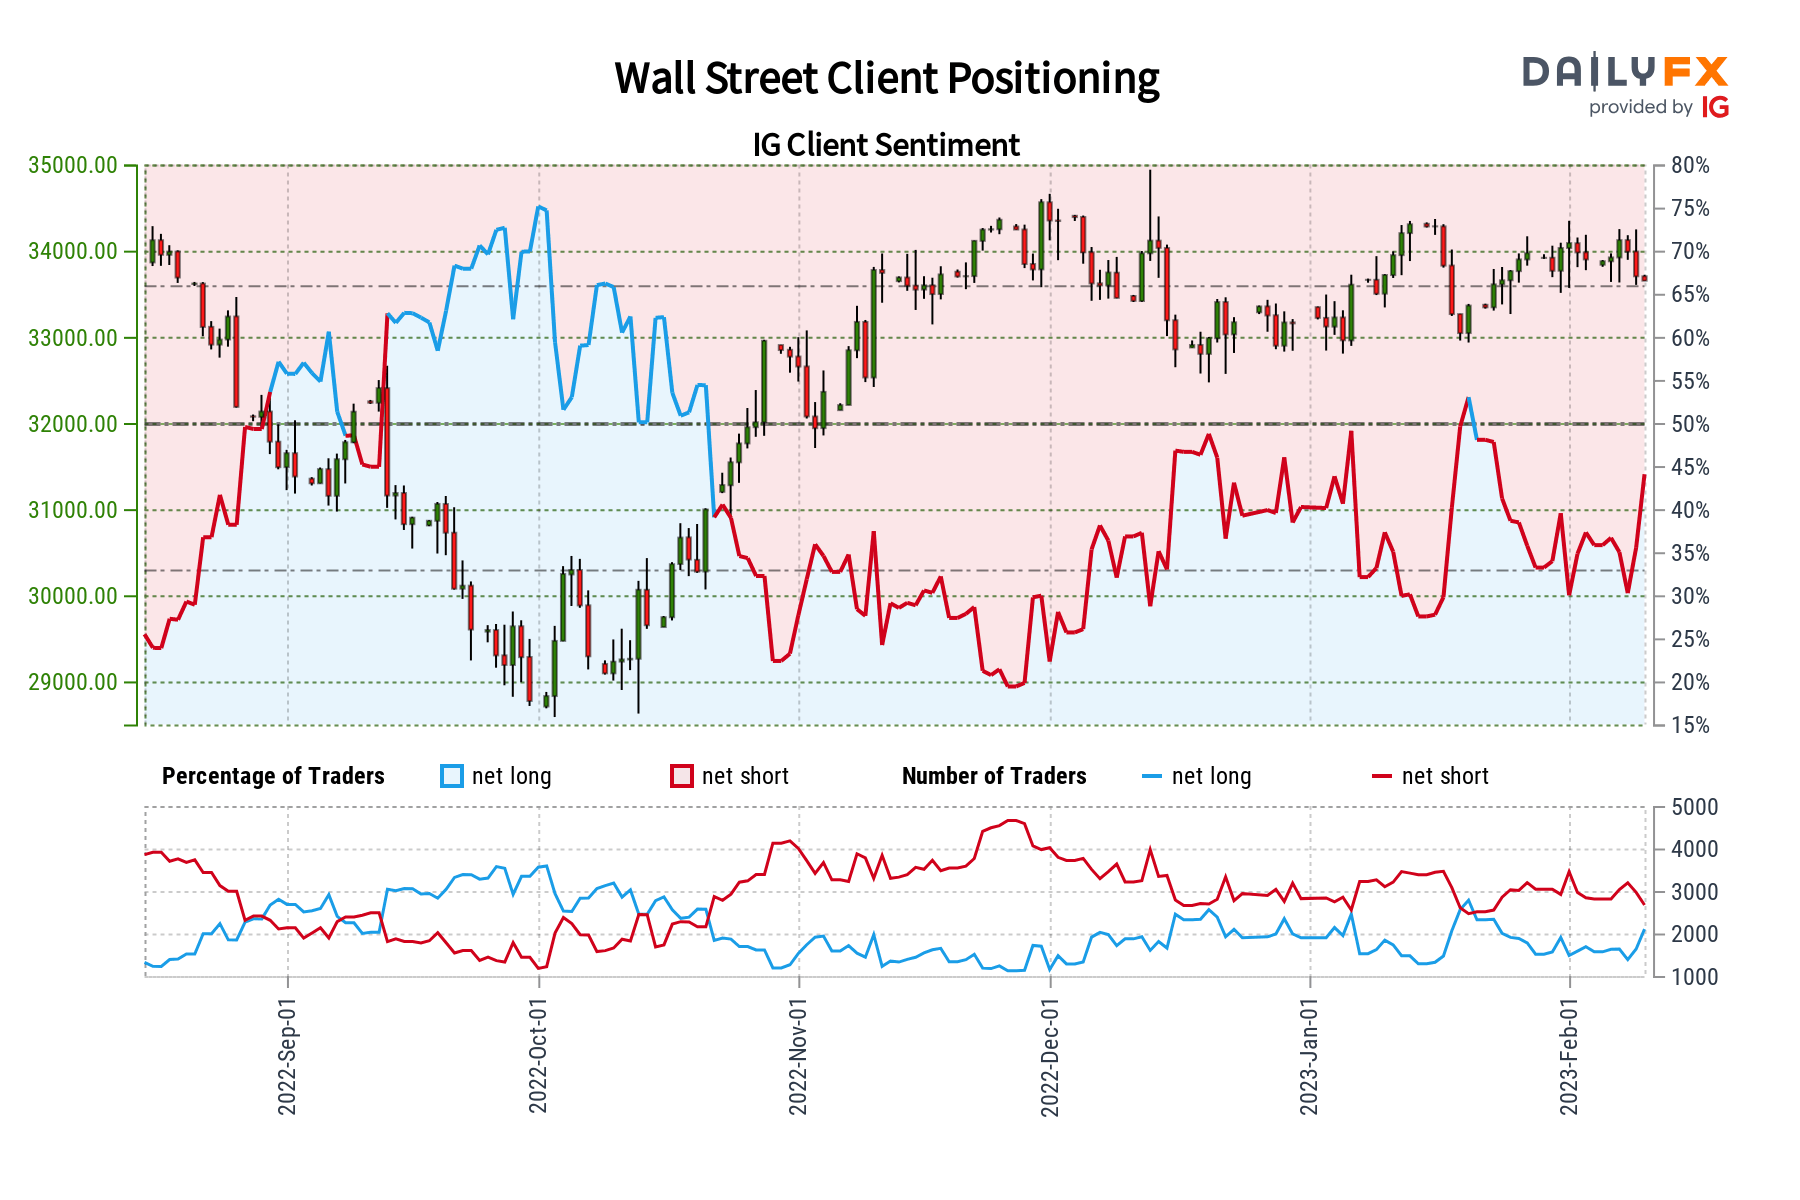
In recent days, the Dow Jones and S&P 500 have been aiming lower. In response, retail traders have been slowly increasing their net-long exposure on Wall Street. This can be seen through the lens of IG Client Sentiment (IGCS), which tends to function as a contrarian indicator. As such, if this trend in positioning continues, further losses may be in store for equities.

Dow Jones Sentiment Outlook – Bearish

According to IGCS, about 44 percent of retail traders are net-long the Dow Jones. Since most traders are net-long, this hints prices may continue rising. However, upside exposure has increased by 30.05% and 27.68% compared to yesterday and last week, respectively. With that in mind, recent changes in exposure hint that prices may soon reverse lower despite overall positioning.

Dow Jones Sentiment Outlook - Bearish

Dow Jones Futures Technical Analysis

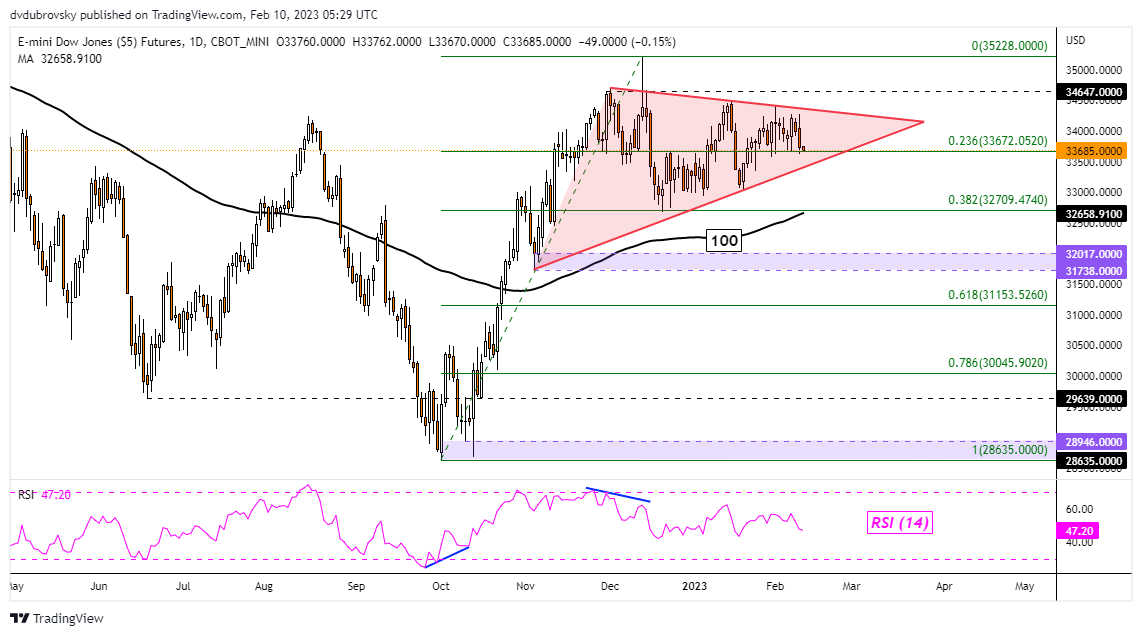
On the daily chart, the Dow Jones appears to be consolidating within the boundaries of a Symmetrical Triangle. Prices recently rejected resistance, turning lower towards the rising floor of the chart formation. The direction of the pattern’s breakout could be key for the following trend. Extending losses lower would open the door to resuming the dominant downtrend from last year. That would place the focus on the 100-day Simple Moving Average (SMA).

Dow Jones Futures Technical Analysis

S&P 500 Sentiment Outlook – Bearish

According to IGCS, about 45% of retail traders are net-long the S&P 500. Since most of them are still net-long, this hints prices may continue rising. However, net-long exposure has increased by 4.35% and 26.62% compared to yesterday and last week, respectively. With that in mind, recent changes in positioning warn that prices may reverse lower despite the overall balance of exposure.

S&P 500 Sentiment Outlook - Bearish

S&P 500 Futures Technical Analysis

S&P 500 futures appear to be trading within the confines of a bearish Rising Wedge from October. Recently, prices rejected the ceiling, setting the stage for a retest of the floor of the chart pattern. While the index remains within the wedge, the near-term trend may remain biased higher. However, confirming a breakout would open the door to resuming the dominant downtrend from 2022.

S&P 500 Futures Technical Analysis

Breaking News: UK GDP Data in Line with Estimates, GBP/USD Steady

Breaking News: UK GDP Data in Line with Estimates, GBP/USD Steady

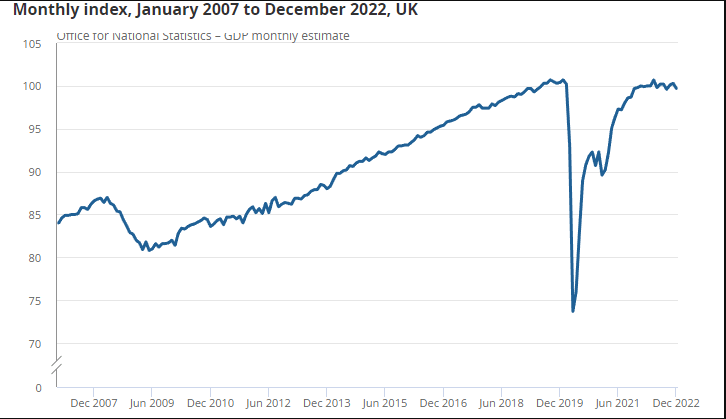
UK GDP preliminary data for Q4 2022 indicated a definite slowdown despite matching estimates. Monthly real gross domestic product (GDP) is estimated to have fallen by 0.5% in December 2022 while the bigger picture showed that GDP was flat in the 3 months to end December 2022. As a whole 2022 GDP came in at 4.1%.

Graphical user interface, text, application, email  Description automatically generated


image2.png

Customize and filter live economic data via our DailyFX economic calendar

The services sector fell by 0.8% in December 2022, after unrevised growth of 0.2% in November 2022; the largest contributions to this fall came from human health activities, education, arts, entertainment and recreation activities, and transport and storage. Output in consumer-facing services fell by 1.2% in December 2022 while production output grew by 0.3% in December 2022 compared to 0.1% in November. The main contributor to this growth was electricity, gas, steam and air conditioning supply.

Chart, line chart  Description automatically generated

Source: Office for National Statistics

UK GDP GROWTH PROSPECTS FOR 2023

The International Monetary Fund (IMF) recently upgraded its global GDP Forecasts for 2023 with the UK economy seen growing at -0.6% for the year. This would represent a sharp downturn following a largely resilient 2022 with the UK economy facing significant headwinds in 2023. The ongoing worker’s strikes, Government debt and ongoing issues around Brexit are all set to weigh on any attempted recovery in 2023.

The IMF emphasized that among its concerns for the UK economy moving forward is energy prices, employment levels and monetary policy with further tightening expected to fight inflation. Energy prices have since fallen sharply adding a ray of hope, however employment is yet to recover to pre-pandemic levels as the labor market remains tight but has not absorbed as many people back into employment as it had before. This is likely to result in less output and production in 2023.

MARKET REACTION

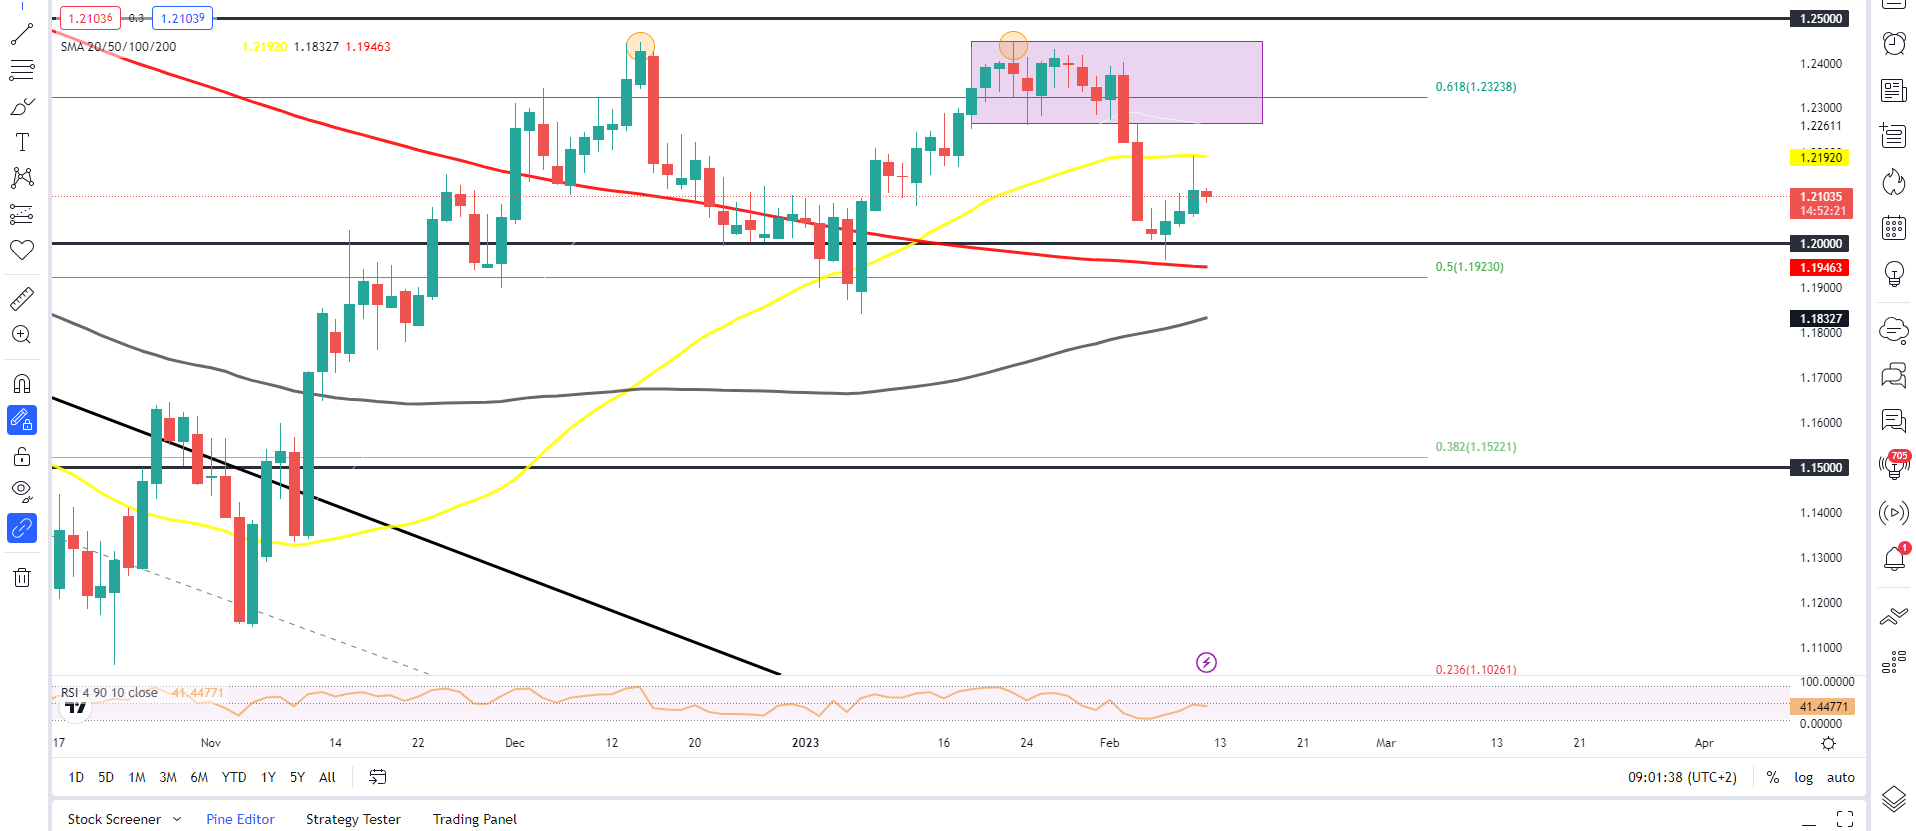
The initial market reaction following the news has seen GBPUSD decline 15 pips. Looking at the bigger picture from a technical perspective, GBPUSD price has bounced off the 200-day MA following it selloff toward the end of last week. Yesterday we saw resistance come into play around the 50-day MA at 1.21920 with the price hovering between the two MAs. Further downside remains more appealing over the medium term, however a break above the 50-day MA and retest of the range or the psychological 1.2500 area cannot be ruled out before the next leg to the downside unfolds.

GBPUSD Daily Chart, February 10, 2022

Chart  Description automatically generated

USD/CAD bulls attack 1.3470 hurdle as Oil price retreats, BoC contradicts Fed

USD/CAD bulls attack 1.3470 hurdle as Oil price retreats, BoC contradicts Fed

USD/CAD remains on the front foot for the second consecutive day, extending the previous day’s rebound from the weekly low to refresh the intraday top near 1.3455 during early Thursday. In doing so, the Loonie pair justifies the divergence between the monetary policy outlook at the Bank of Canada (BoC) and the US Federal Reserve (Fed). Also fuelling the quote could be the latest weakness in the Oil price, Canada’s key exports, and the mixed sentiment.

On Wednesday, the BoC released its monetary policy meeting minutes for the first time and highlighted the growing discussions among the policymakers to pause the rate hikes. On the same line, BoC Governor Tiff Macklemd asked for time to gauge how households and businesses adapt to higher rates before further moves. The policymaker also said, “Rate hikes have hit homeowners hard.”

Elsewhere, Fed Governor Christopher Waller teased a long fight with a 2.0% inflation target by citing expectations of tighter monetary policy for longer than expected. New York Federal Reserve President John Williams was almost on the same line while saying that the labor market is still very strong and noted that they have more work to do on rates; adding data will determine the path of rate hikes. Fed Governor Lisa Cook said that the central bank remains focused on restoring price stability, as inflation is still running too high. She added that they would need a restrictive monetary policy for some time.

It’s worth noting that the US diplomats also highlighted concerns that defend the higher Fed rates and fuel the USD/CAD price. US Treasury Secretary Janet Yellen mentioned, “While inflation remained elevated, there were encouraging signs that supply-demand mismatches were easing in many sectors of the economy.” Elsewhere, US President Joe Biden said during a PBS interview that there will be no US recession in 2023 or 2024.

On a different page, easing fears surrounding the US and China joins the firmer US Dollar Index (DXY) to weigh on the Oil prices, down 0.05% around $78.50 by the press time, which in turn allows the USD/CAD buyers to keep the reins.

No significant data/events are there for publishing on the calendar; hence, the central bankers’ comments and other risk catalysts will be critical for the USD/CAD pair traders to watch for clear directions.

Technical analysis

USD/CAD pair’s successful trading beyond the convergence of the 50-SMA and a weekly ascending trend line near 1.3370 keeps buyers hopeful of overcoming the immediate resistance line stretched from January 19 surrounding 1.3470.

Biden says Xi faces ‘enormous problems’

Biden says Xi faces ‘enormous problems’

WASHINGTON: President Joe Biden on Wednesday said his Chinese counterpart Xi Jinping faces “enormous problems,” including a fragile economy.

In an interview with PBS NewsHour, Biden said China was constrained in its ability to confront the United States by the need to protect international trade and that Xi himself is in an unenviable position.

“Can you think of any other world leader who’d trade places with Xi Jinping? I can’t think of one,” Biden said.

“This man has enormous problems,” Biden said.

The Democrat, who frequently describes the US-China relationship as the most consequential in the world, added that Xi “has also great potential.”

However, Biden said “so far, he has an economy that is not functioning very well.”

According to Biden, Xi recognizes his limited ability for maneuver in confrontation with Western countries.

Pointing to China’s so far relatively muted support for ally Russia in its invasion of Ukraine, Biden said “everyone assumed that China would be all in with Russia” – but “they’re not all in.”

The reason, according to Biden, is that Xi has drawn lessons from the overwhelming Western response against Russia, including imposition of powerful economic sanctions.

Biden vows ‘to protect’ country, refers to China balloon

“I called him this summer to say, ‘This is not a threat, just an observation – look what’s happened to Russia,’” Biden recalled.

Biden said he underlined in that conversation with Xi that 600 US corporations had quit Russia since its invasion began in Ukraine a year ago.

“I said, ‘You’ve told me all along that the reason why you need relationships with the United States and Europe is so that they invest in China.’ I said: ‘Who’s going to invest in China if you engage in the same kind of deal?’”

Biden met in person with Xi last November on the sidelines of the G20 summit in Bali for the first time since he became US president in 2021. They have also talked in five phone or video calls during that time.

US Secretary of State Antony Blinken last week announced a last-minute cancelation of a trip to Beijing as tensions flared again over the appearance of a high-altitude Chinese balloon over the United States – and its shooting down by the US Air Force on Saturday.

The United States says the balloon, which flew over sensitive military sites, was an espionage device. China says the balloon was just studying weather.

Inflation rate of +8.7% expected in January 2023

Inflation rate of +8.7% expected in January 2023

Consent to using cookies and similar technologies

  • With your consent, we will use the Matomo service to measure your user activity on our website and to improve our website’s functionalities.
  • To this end, we store information on your end device, such as cookies, and we only access information on your end device that is required for the relevant purpose.
  • The data collected are never shared with third parties and are stored for a maximum of 30 days in pseudonymised form.
  • You can withdraw your consent at any time with effect for the future by changing your
Russian rouble slumps to weakest vs US dollar since late April

Russian rouble slumps to weakest vs US dollar since late April

The Russian rouble slid to its weakest level against the dollar since late April on Thursday, driven down by market demand for foreign currency and Russia’s lower export earnings.

At 0550 GMT, the rouble was 1.1% weaker against the dollar at 73.10, after hitting its lowest point since April 27, 2022 at 73.3850 earlier in the session.

It had lost 1.2% to trade at 78.35 versus the euro and shed 0.9% against the yuan to 10.77.

Russia is now selling 8.9 billion roubles ($121.83 million)worth of foreign currency per day, compensating for lower oil and gas revenues, down 46.4% year-on-year in January.

Russian rouble slides to one-month low vs dollar

Slumping energy revenues and soaring expenditure pushed Russia’s federal budget to a deficit of about $25 billion in January, as sanctions and the cost of Moscow’s military campaign in Ukraine weigh on the economy.

Brent crude oil, a global benchmark for Russia’s main export, was up 0.1% at $85.2 a barrel.

Pressure on China’s factories grows as U.S. demand falls

Pressure on China’s factories grows as U.S. demand falls

BEIJING — For some factories in China, it’s not full steam ahead after the end of zero-Covid.

All the factories that U.S. toy maker Basic Fun works with in China — about 20 of them — told workers not to return immediately after the Lunar New Year holiday, said CEO Jay Foreman.

That’s because of a flood of inventory in the first half of last year, which didn’t get sold as consumer prices in the U.S. surged over the summer and into the fall, he said. Basic Fun’s products include Care Bears and Tonka Trucks.

The official Lunar New Year holiday in China ended Jan. 27, but the travel period runs until Feb. 15. The festival is typically the only time each year that migrant workers — more than 170 million people in China — can visit their hometowns.

“Every factory I spoke to said they’re going to have less people employed this year than last year,” Foreman said. He expects U.S. consumer demand to pick up later this year.

China’s exports to the U.S. in the toys, games and sports category account for about 6% of all exports to the country, according to China customs data accessed through Wind Information. That category of toy exports to the U.S. saw a slight drop in 2022, the data showed.

“Retail, anything consumer discretionary, they were hit quite hard. It was really a combination of high inventory and demand dropping quite a lot for the export markets,” said Johan Annell, partner at Asia Perspective, a consulting firm that works primarily with Northern European companies operating in East and Southeast Asia.

He said consumer electronics was seeing a similar situation.

“For other industries, the picture is much better. Some are struggling to keep up with trailing orders and catch up with everything they had to deliver last year,” he said.

China abruptly ended its zero-Covid policy in December. But restrictions on business activity were tight for most of 2022, including a lockdown of Shanghai for about two months in the spring.

Breaking News: UK GDP Data in Line with Estimates, GBP/USD Steady

UK FTSE Technical Outlook: Scope to Rise Further

FTSE TECHNICAL FORECAST – BULLISH

Technical charts and breadth market data suggest that the UK FTSE 100 index may have scope to rise further in the coming weeks/months.

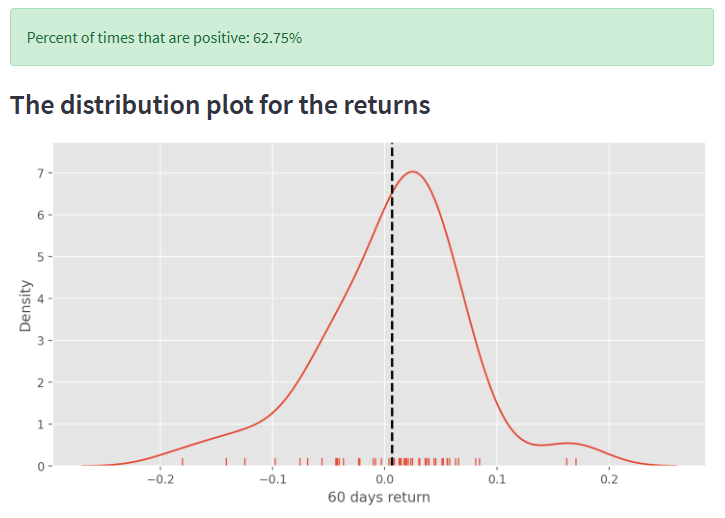
As of Wednesday, 90% of the members in the UK FTSE 100 index are above their respective 100-day moving averages (DMAs), not too far from 92% a week ago. Data from 2002 onwards suggests that when 92% of the members were above their respective 100-DMAs, the index has been up 63% of the time over the subsequent 60 days (see distribution plot of returns).

image1.png

Data Source: Bloomberg; Chart Created by Manish Jaradi Using Python. The author does not guarantee the accuracy of the information. Past performance is not indicative of future performance. Users of the information do so at their own risk.

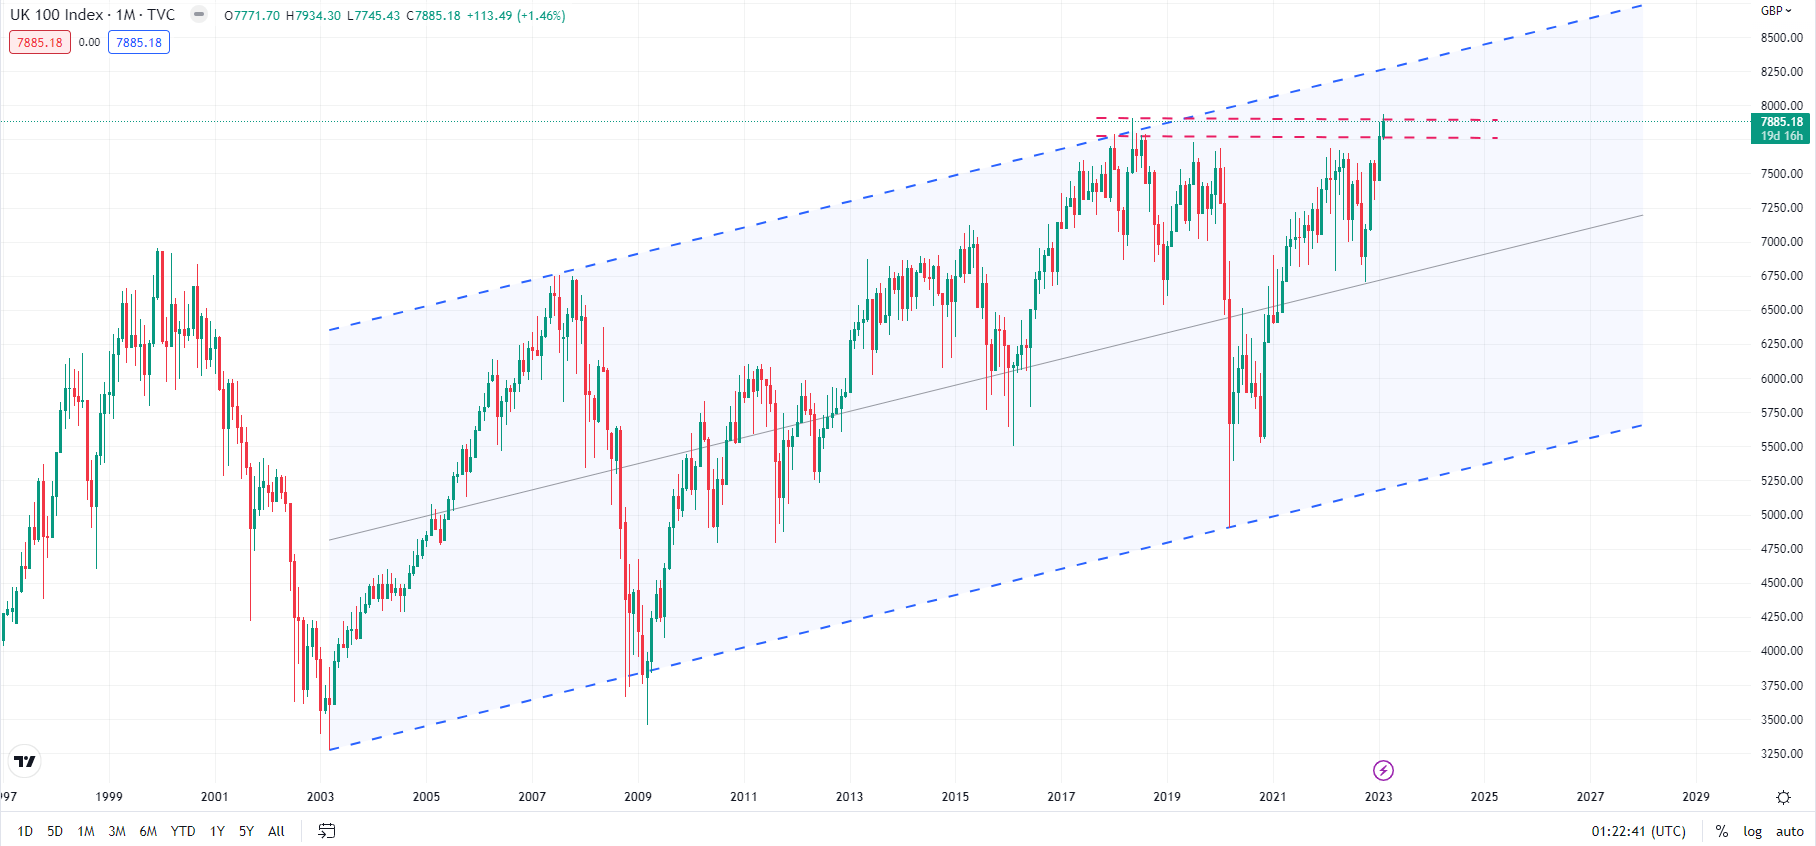
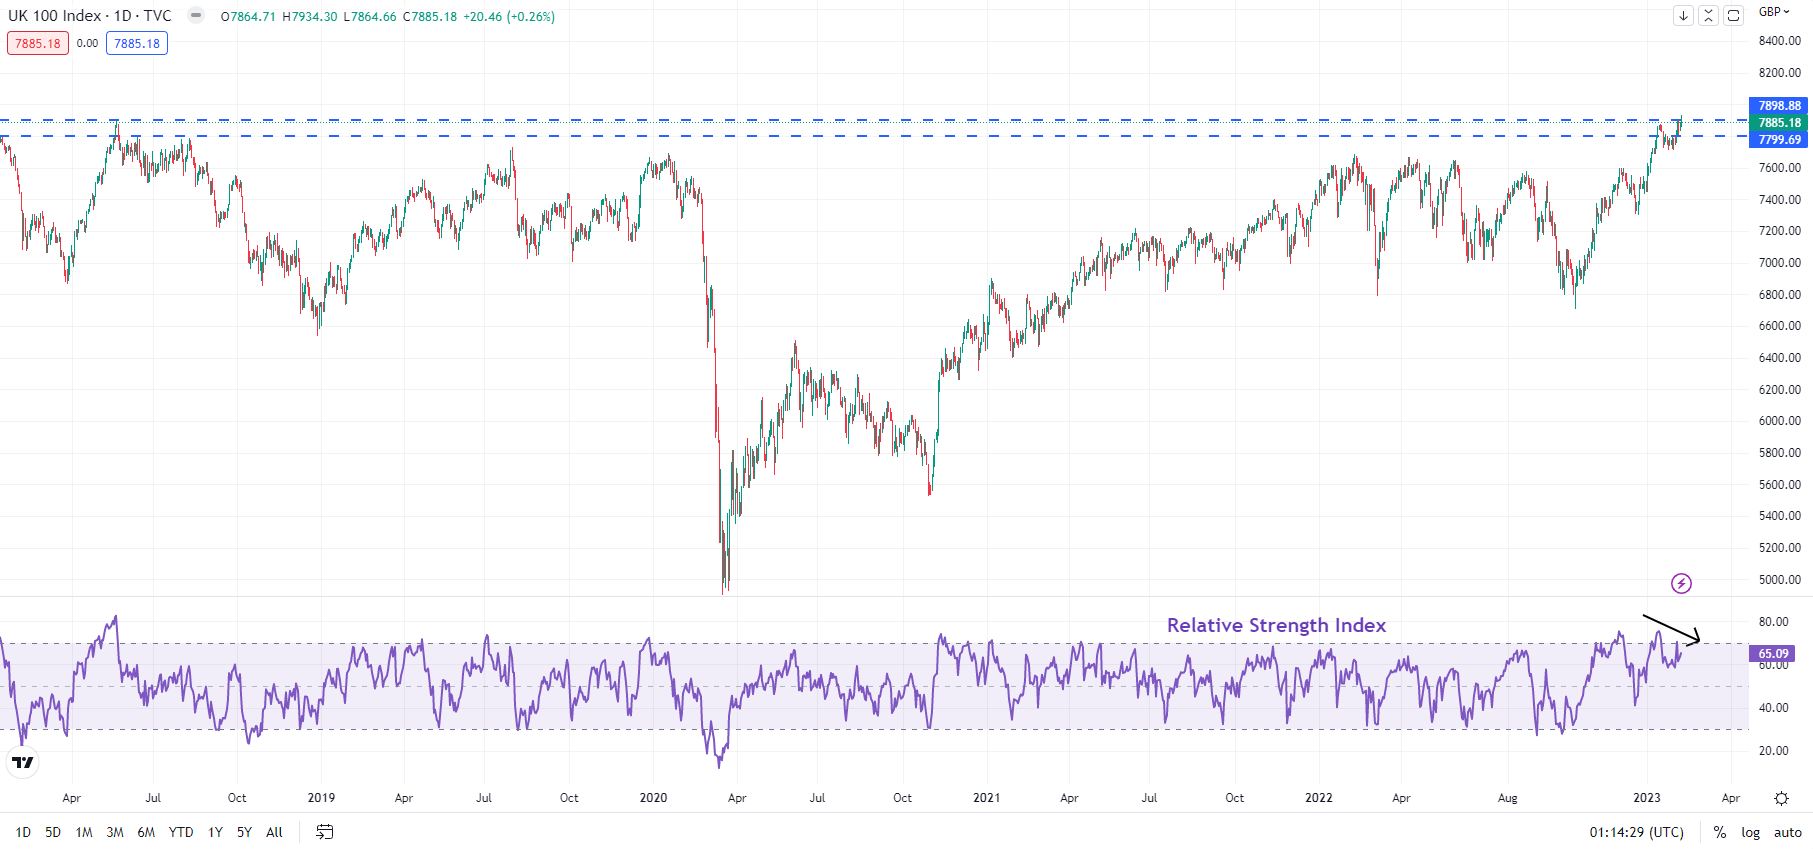
On technical charts, the index, up over 18% from October, is attempting to break above crucial resistance at the 2018 highs of 7790-7805. A decisive break above could pave the way toward the upper edge of a rising channel from 2003 (now at about 8300).

FTSE INDEX Monthly Chart

image2.png

A more bullish perspective would be the potential target of the reverse head & shoulders pattern (the left shoulder at the 2018 low, the head at the 2020 low, the right shoulder at the 2022 low) pointing to roughly 30% upside from current levels in coming months/years. In a way, it wouldn’t be surprising given that the index has been essentially sideways for the past two decades.

FTSE INDEX Daily Chart

image3.png