US Dollar Takes a Breather after Fed Hawks Boosted it. Will USD/JPY Climb Again?

US Dollar Takes a Breather after Fed Hawks Boosted it. Will USD/JPY Climb Again?

The US dollar is slightly weaker across the board today with more significant declines against the Aussie and the Kiwi. The dip comes after a solid rally going into the New York close. The greenback was supported by a change in perceptions of where the Federal Funds rate might peak.

Overnight saw four Fed speakers continue to press their hawkish message to the market. The reaction to those comments is in contrast to the interpretation of Fed President Jerome Powell’s remarks the previous day.

The consistent message is that further rate rises are on the cards and that the rate will need to remain high for a long period.

Overnight speakers were Fed Reserve Governor Christopher Waller, New York Fed President John Williams, Fed Governor Lisa Cook and Minneapolis Fed President Neel Kashkari.

It seems that the market has changed its tune on where they see interest rates going. The perception that the tightening cycle could be more aggressive than previously thought undermined Wall Street.

The Dow Jones, Nasdaq, Russell 2000 and S&P 500 saw declines in their cash session of -0.61% -1.11%, -1.52% and -1.68% respectively.

Future markets are pointing to a positive start to their day. Alphabet reported disappointing earnings during the day session while Disney revealed better-than-expected earnings and a cost-cutting restructure after the bell.

APAC equities have had a mixed day with Australia and Japan down slightly while China and Hong Kong indices are mostly in the green.

Crude oil is steady through the Asian session as hopes of China reopening have stoked speculation of increased demand. The WTI futures contract is a touch under US$ 78.50 bbl while the Brent contract is around US$ 80 bbl.

Gold has been left relatively unscathed from U.S. Dollar moves so far this week as it remains in a range of US$ 1860 to 1886 an ounce.

Treasury yields are pretty much unchanged so far today with the benchmark 10-year note trading just above 3.6%.

After the German CPI, the US will see some jobs data. There will be several ECB speakers today as well.

USD/JPY TECHNICAL ANALYSIS

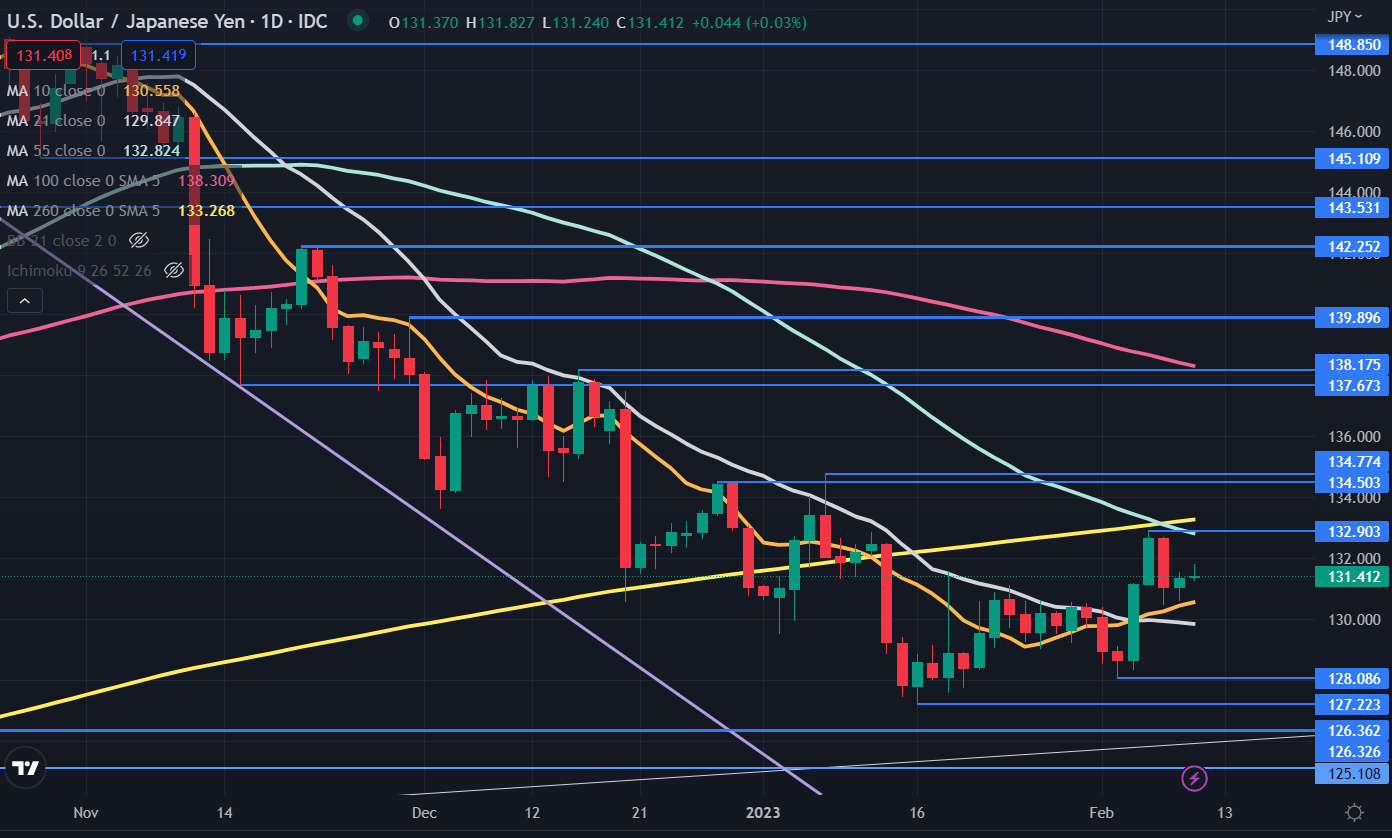
USD/JPY has been in a 127.22 – 134.77 range for seven weeks. The 55- and 260-day simple moving averages (SMA) are just above the price while 10- and 21-day SMAs lie below it.


This may indicate a lack of directional momentum and the range trading environment might be with us for a little while yet.

Resistance could be offered at the previous peaks of 122.90 134.50 and 134.77

On the downside, support might lie at the April and May lows from last year at 125.11, 126.33 and 126.36. The recent lows of 128.09 and 127.22 could provide close-by support.

image1.png


— Written by Daniel McCarthy, Strategist for DailyFX.com

Euro Outlook: EUR/USD, EUR/GBP May Fall as Retail Traders Boost Long Bets

Euro Outlook: EUR/USD, EUR/GBP May Fall as Retail Traders Boost Long Bets

The Euro has been losing ground against some of its major over the past few trading sessions. In response, retail traders have been boosting upside exposure in pairs like EUR/USD and EUR/GBP. This can be seen by taking a look at IG Client Sentiment (IGCS), which tends to behave as a contrarian indicator. With that in mind, is this a sign that more pain might be in store for the single currency?

EUR/USD Sentiment Outlook – Bearish

The IGCS gauge shows that about 56% of retail traders are net-long EUR/USD. Since most of them are biased to the upside, this hints that prices may continue falling. Meanwhile, upside exposure increased by 3.92% and 92.03% compared to yesterday and last week, respectively. With that in mind, the combination of current and recent changes in positioning offers a stronger bearish contrarian trading bias.

EUR/USD Sentiment Outlook - Bearish

Daily Chart

On the daily chart, EUR/USD broke under a bearish Rising Wedge chart formation. This count hint at the resumption of the dominant downtrend from last year. Still, a Doji candlestick pattern was left behind a couple of days ago as prices struggled to clear the 1.0713 – 1.0787 support zone. This is a sign of indecision. Further upside progress could open the door to revisiting the early February high at 1.1033. Otherwise, extending lower exposes the January low at 1.0483.

image2.png

EUR/GBP Sentiment Outlook – Bearish

The IGCS gauge reveals that about 42% of retail traders are net-long EUR/GBP. Since most of them are still biased to the downside, this hints prices may continue rising. However, upside exposure increased by 38.46% and 68.22% compared to yesterday and last week, respectively. With that in mind, recent changes in positioning warn that prices may extend lower ahead despite the overall balance of exposure.

EUR/GBP Sentiment Outlook - Bearish

Daily Chart

EUR/GBP recently struggled to hold a break above the 38.2% Fibonacci retracement level at 0.892. Prices turned lower towards the near-term rising trendline from December. As such, from a technical standpoint, the pair remains positioned upward. Further losses would open the door to testing the trendline, which may reinstate the upside focus. Otherwise, the January low at 0.8722 would come into focus.

image4.png


China as the Economic Engine for ASEAN Economies: SGD, IDR, MYR, PHP

China as the Economic Engine for ASEAN Economies: SGD, IDR, MYR, PHP

The Association of Southeast Asian Nations, also known as ASEAN, orbits the world’s second-largest economy – China. The bloc is aimed at helping to promote economic growth in participating countries such as Indonesia, Malaysia, the Philippines and Singapore. Using the Core-Perimeter model, China functions as the economic powerhouse (core) which ASEAN states strongly rely on as a source of their growth (perimeter).

The Relationship Between China and ASEAN (SGD, IDR, MYR, PHP)

On average in 2018, China accounted for one third of total trade in ASEAN nations, when looking at their top five trading partners. China’s economy has been maturing and gradually shifting away from exportsand towards consumption as the primary source of economic growth. This makes the East Asian giant relativelyless sensitive to external shocks than its ASEAN neighbors.

Significance of ASEAN Trade With China

Chart showing ASEAN trade with China

During the 2008 financial crisis, market mood substantially deteriorated along with the baseline outlook for growth. China’s year-on-year GDP fell from its 2007 high at 14 percent down to around 6 percent in 2009. Over the course of the recession, ASEAN currencies plummeted as capital rushed out of the perimeter amid signs of weaker growth from the core, the source of the regional bloc’s economic vitality.

Chart showing ASEAN FX

This is because those perimeter economies (ASEAN) are more at risk of experiencing external shocks that undermine their growth trajectory than the core (China) due to their cycle-sensitive nature. The latter’s economy has been slowly shifting towards a consumer-based economy, which gives it more insulation to external shocks than outward-facing economies like those in ASEAN.

As Chinese growth began to show signs of stabilization, the prospect of that positive economic reverberation echoing out into its ASEAN neighbors precipitated a rush of capital flowing into the bloc’s assets. TheSingapore Dollar, Indonesian Rupiah, Malaysian Ringgit, Philippine Peso all rose with other growth-oriented instruments as signs of optimism from the core gave a flicker of hope for an economic recovery in the perimeter.

Chart showing ASEAN FX, CSI 300

The China-ASEAN dynamic has another layer of complexity to it when considering how the Yuan performed relative to its Asian neighbors. An assortment of unique circumstances has produced examples where price action deviates from the patterns implied in the Core-Perimeter model. A look at how these dynamics manifested during the 2008 financial crisis, the US-China trade war and the Covid-19 pandemic in 2020 can help investors navigate similar scenarios and be prepared for instances when the assumptions of the Core-Perimeter framework are best set aside.


British Pound (GBP) Forecast: Cable Shaped by USD Factors

British Pound (GBP) Forecast: Cable Shaped by USD Factors

GBP/USD FUNDAMENTAL BACKDROP

In what has been a consistent theme throughout FX markets of recent, U.S. economic data and Fed guidance has been at the forefront of currency movements. The pound is no different and has found some relief after a significant USD rally last week. Yesterday saw Fed Chair Jerome Powell reiterated his message from last week’s rate decision whereby he cited disinflation once more; however, he did elude to the need for more interest rates hikes should the labor market remain robust. When asked about the potential for a move back to a 50bps increment in the next meeting, he cleverly declined to respond so as to not stoke too much market volatility. The Fed’s Kashkari echoed these hawkish sentiments in his speech yesterday noting that a tight labor market will not allow for an easy path towards reducing inflationary pressures.

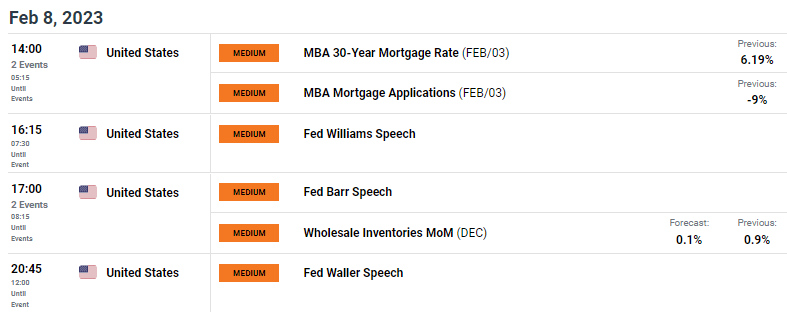
Later today, several other Fed officials are scheduled to speak (see economic calendar below) and should they follow the same path as their counterparts, GBP/USD may be in for further downside.

GBP/USD ECONOMIC CALENDAR

image1.png

From a UK perspective, strike action remains a concern for the government and on March 15, there are plans for civil servants to implement another strike. Chancellor of the Exchequer Jeremy Hunt will deliver his fiscal plan on the same day and will be under additional pressure to possibly reassess pay settlement queries. Overall, this is bearish for the pound as the strike action disrupts the UK economy and questions the UK leadership. slew

TECHNICAL ANALYSIS

GBP/USD DAILY CHART

image2.png

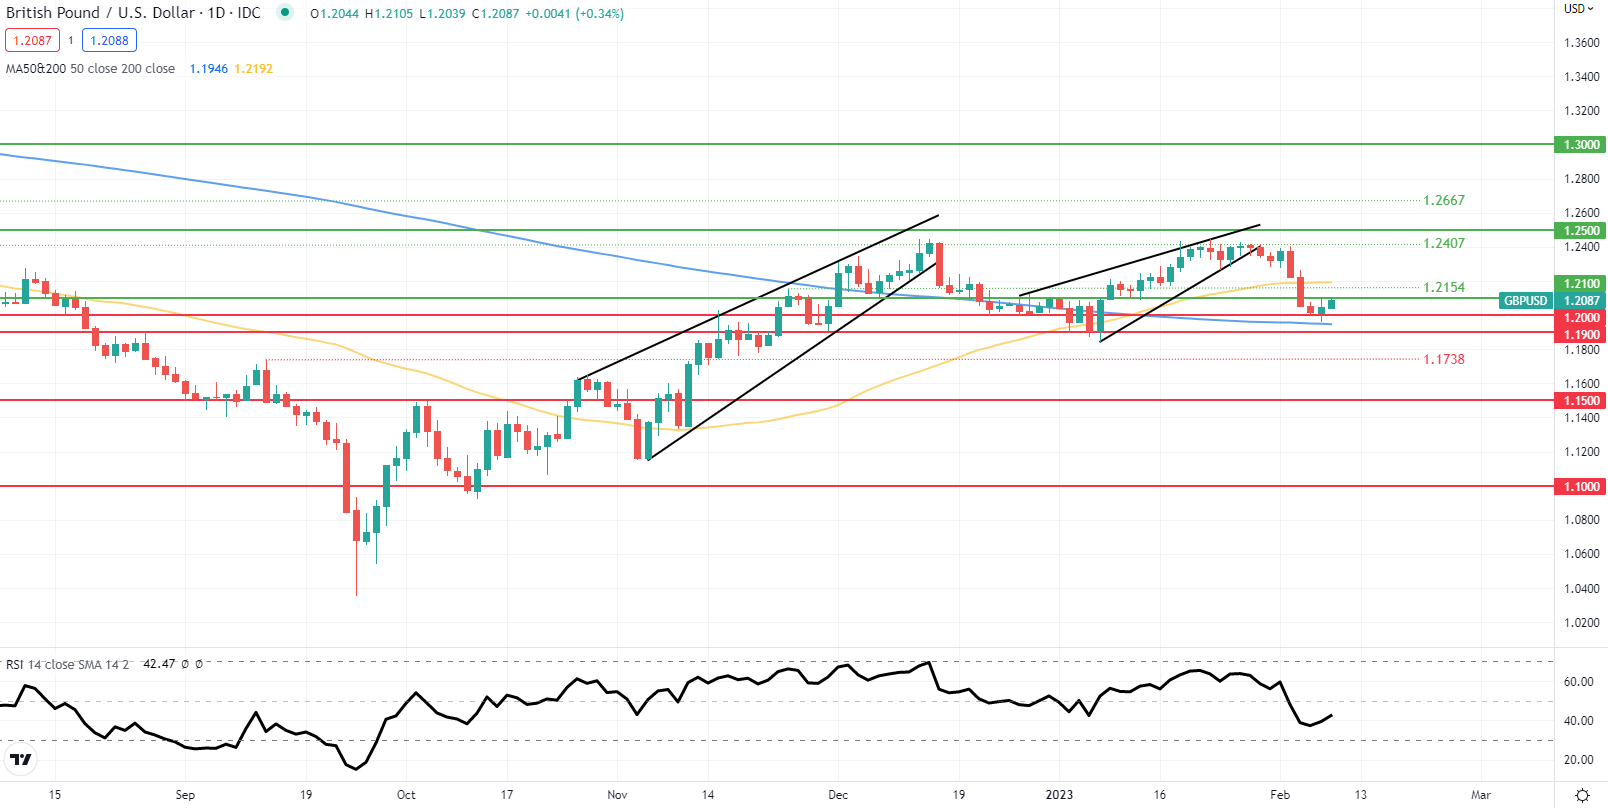
The daily GBP/USD chart has just pushed above the 1.2000 psychological level and looks to be testing the 1.2100 resistance handle. Now sandwiched between the 50-day (yellow) and 200-day (blue) SMA’s respectively, there is no real clear directional bias. Cable could easily slip back below the 200-day SMA depending on Fed chatter but first I would be looking for a daily candle close below the 1.2000 support level. Looking at the Relative Strength Index (RSI), the pair seems to be creeping up towards the midpoint 50 level but remains in favor of downside momentum leaving room for further pound weakness.

Key resistance levels:

  • 50-day SMA
  • 1.2154
  • 1.2100

Key support levels:

  • 1.2000
  • 200-day SMA
  • 1.1900
US Dollar Price Action Setups: AUD/USD, USD/JPY, EUR/USD, GBP/USD

US Dollar Price Action Setups: AUD/USD, USD/JPY, EUR/USD, GBP/USD

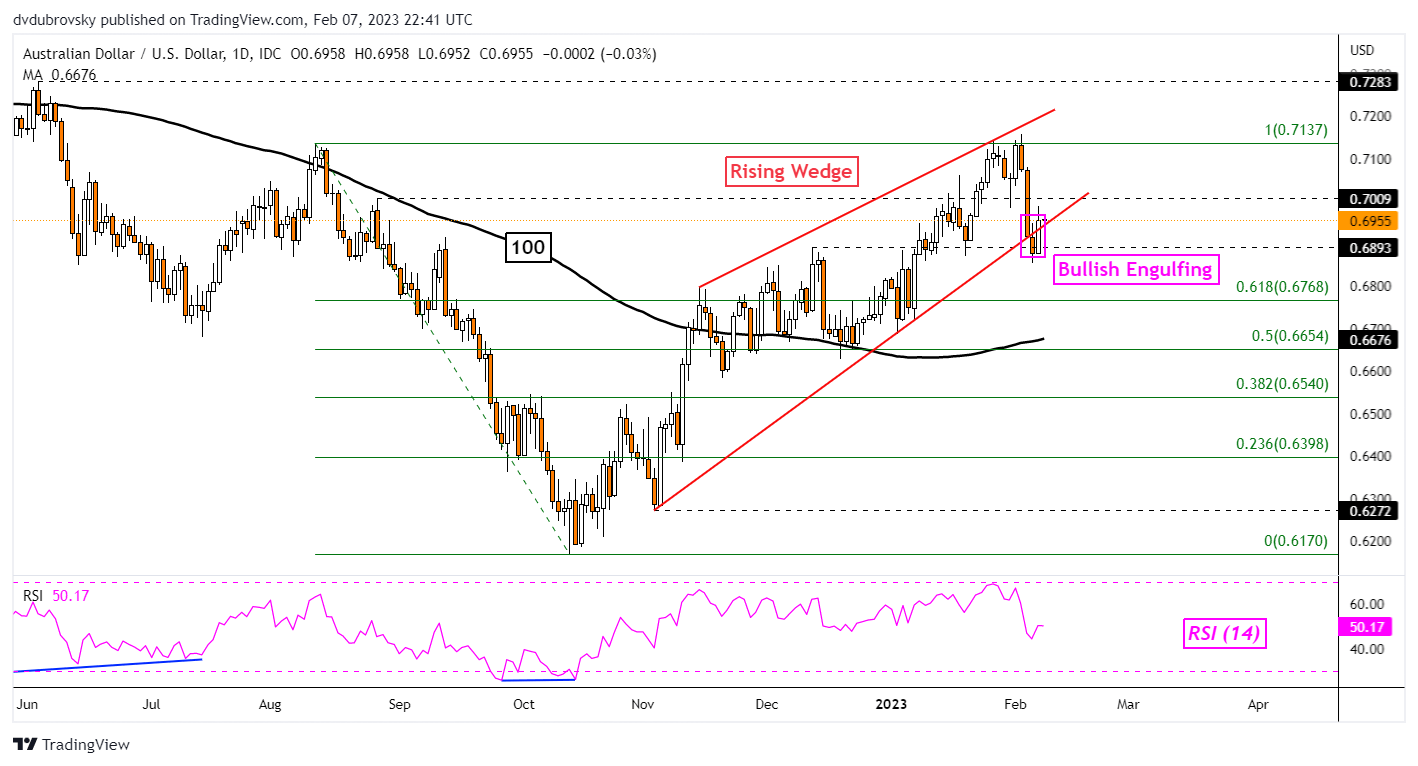
AUD/USD Daily Chart – Bullish Engulfing and Rising Wedge

The Australian Dollar is attempting to make a comeback against the US Dollar. AUD/USD broke under a bearish Rising Wedge chart formation on Monday. 24 hours later, the pair turned higher and left behind a Bullish Engulfing candlestick pattern. This is a sign that the bulls aren’t quite ready to give up just yet. Follow-through will be key in the remaining trading sessions this week. An upside push from here could maintain the bullish posture since November. Otherwise, confirming a breakout under the wedge would offer an increasingly bearish outlook.

AUD/USD Daily Chart – Bullish Engulfing and Rising Wedge

USD/JPY Daily Chart – Trendline Breakout Hits a Snag

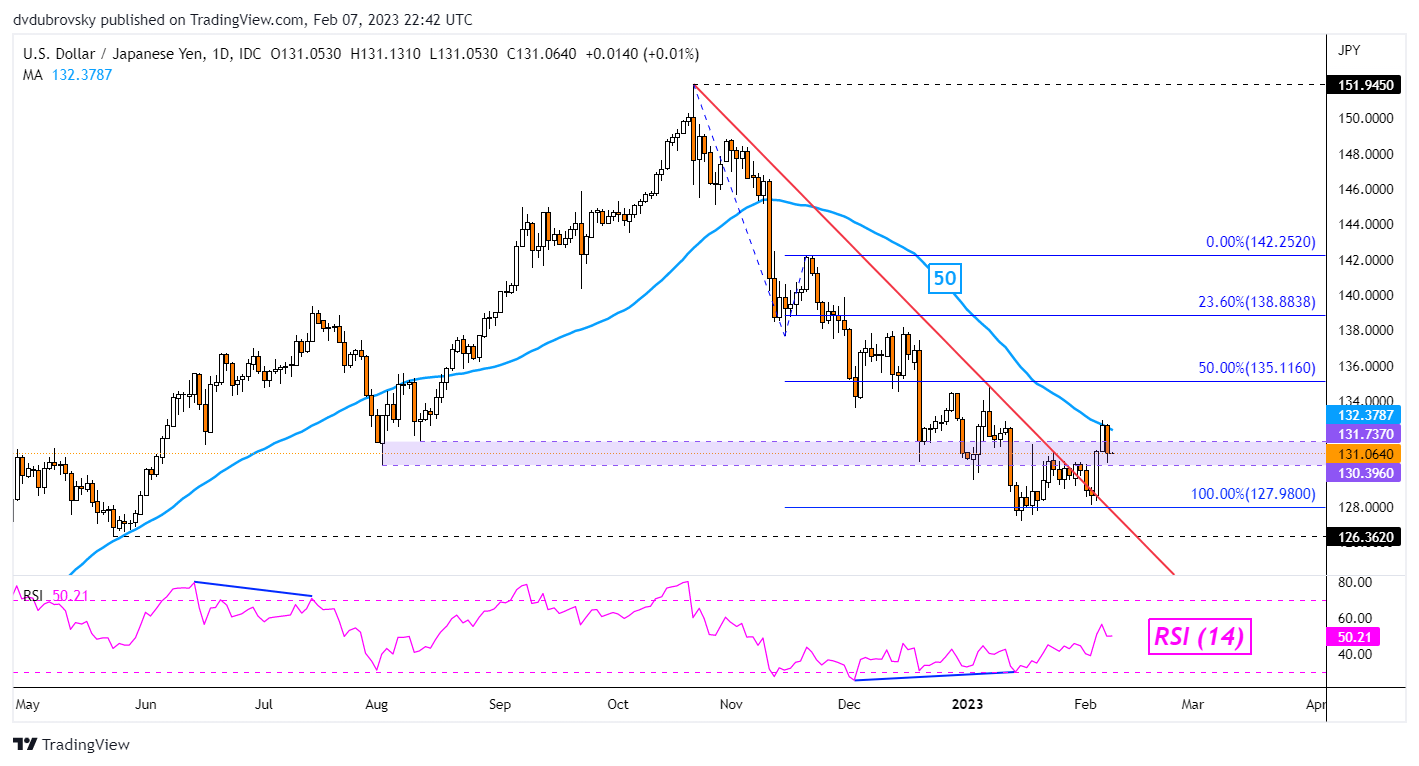
On Monday, the US Dollar closed at its highest against the Japanese Yen in about one month. That pushed USD/JPY further above a key falling trendline from October, opening the door to a broader reversal. But, the 50-day Simple Moving Average kicked in and held as resistance. That is undermining the breakout. A confirmatory push above the 50-day SMA would likely shift the focus back to the upside. Key support is around 127.98. As for resistance, the midpoint of the Fibonacci extension at 135.116 would be a key contender.

USD/JPY Daily Chart – Trendline Breakout Hits a Snag

EUR/USD Daily Chart – Rising Wedge Breakout and Doji

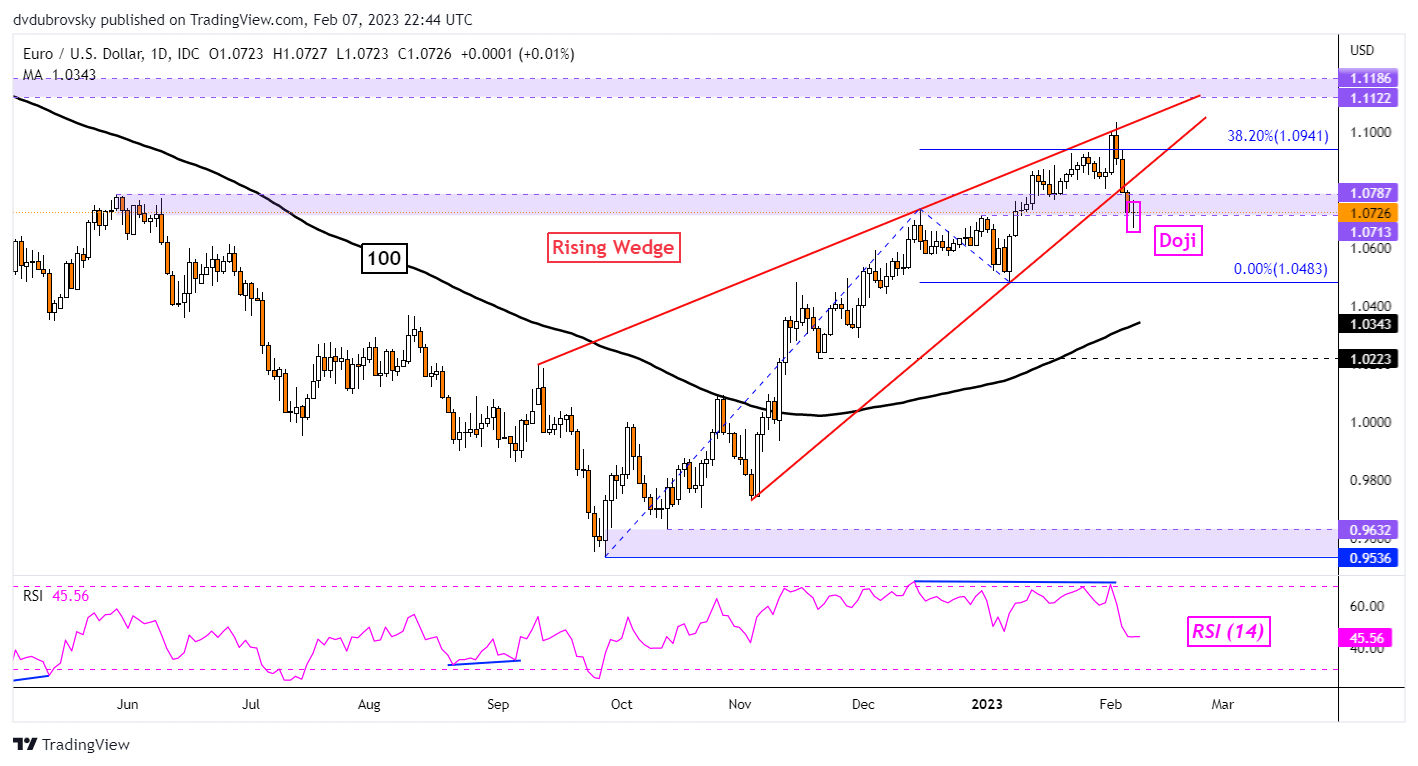
The US Dollar may be readying to extend gains against the Euro. That is because EUR/USD confirmed a breakout under a bearish Rising Wedge. Yet, on Tuesday prices left behind a Doji candlestick pattern. The latter is a sign of indecision. Upside follow-through after the Doji may undermine the wedge breakout, placing the focus on the floor of the wedge. It may hold as new resistance, pivoting prices lower. Extending losses places the focus on the January low at 1.0483.

EUR/USD Daily Chart – Rising Wedge Breakout and Doji

GBP/USD Daily Chart – Double Top Neckline in Focus

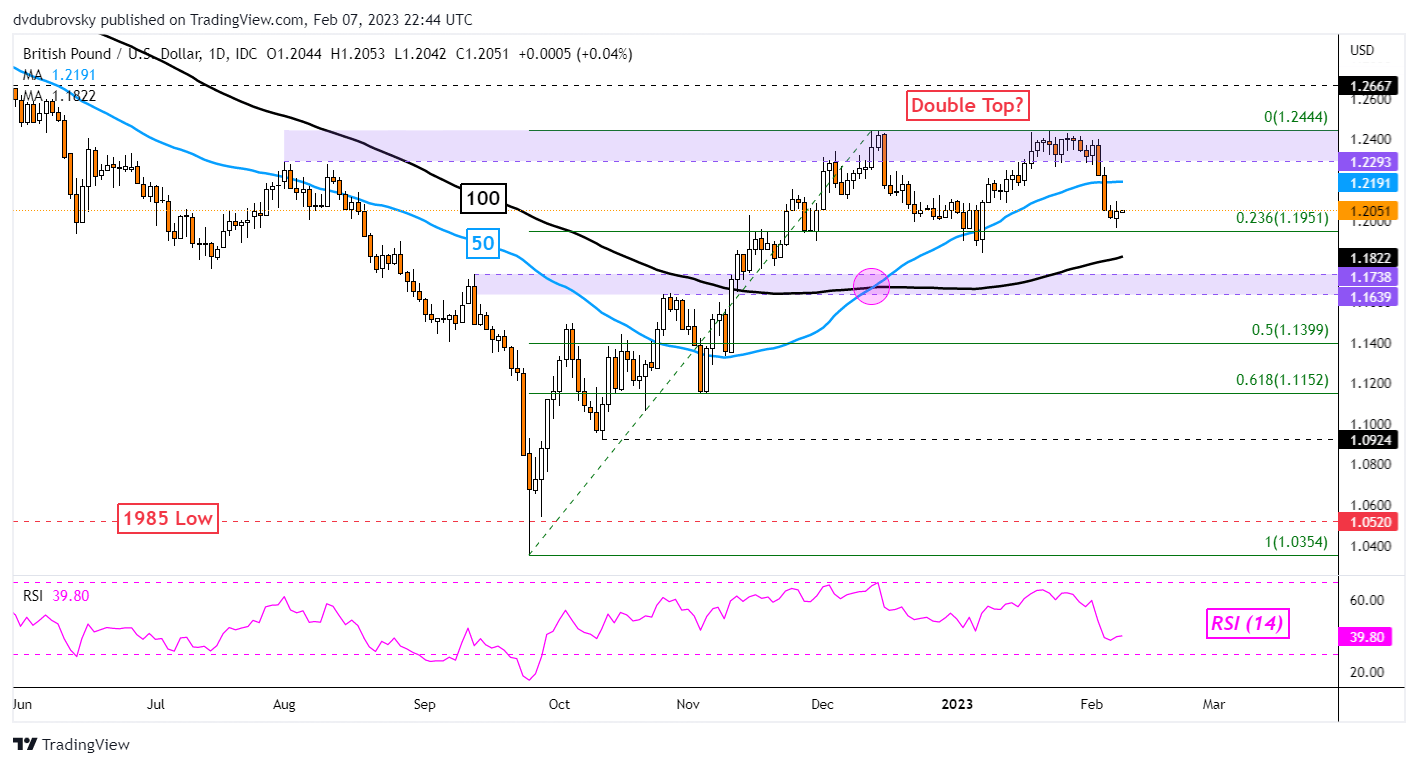
The US Dollar is facing its next key test against the British Pound. After a few days of losses, GBP/USD finds itself sitting on the neckline of a bearish Double Top chart formation. Clearing this point, which seems to be sitting around 1.1951, would open the door to extending losses toward the 1.1639 – 1.1738 inflection zone. Getting there entails clearing the 100-day SMA, which may hold as support and maintain the upside focus. Pivoting higher from here on the other hand may open the door to revisiting the 1.2293 – 1.2444 resistance zone.

GBP/USD Daily Chart – Double Top Neckline in Focus


Ethereum (ETH/USD) Eyes a Bullish Breakout

Ethereum (ETH/USD) Eyes a Bullish Breakout

Ethereum is pushing higher and is set to test levels last seen in mid-September last year. The second largest cryptocurrency by market cap has tried and failed, to conclusively break above the $1,680 level over the last month, but the latest test looks more promising. A series of higher lows over the last month, combined with resistance around $1,680 has produced a bullish triangle pattern which is set to be broken as we near its apex.

In addition to the bullish triangle pattern, Ethereum is also being supported by the 20-day moving average (red line) while the 50-dma is set to break above the 200-dma to form a golden cross, a closely watched bullish signal. This crossover normally suggests a longer-term bullish market set-up is in place.

A confirmed break higher would leave the September swing high at $1,789 as the first target. Above here there is only minor price action protecting $2,031.

Ethereum Daily Price Chart – February 8, 2023

image1.png

Gold Price Hangs Tough as US Dollar Dominates Proceedings. Where to for XAU/USD?

Gold Price Hangs Tough as US Dollar Dominates Proceedings. Where to for XAU/USD?

Gold appears poised for a breakout move after being sidelined so far this week. At the end of last week, it was caught in the crossfire of the US Dollar ricocheting around rate expectations.

The US Dollar has been sucking many currency pairs into a whirlpool of large daily moves, most notably against the Japanese Yen and the Australian Dollar. The gold price has been contained in a relatively narrow range of US$ 1,860 – 1,885 so far this week.

The driver of the greenback gyrations kicked off with probing perceptions around the rate path from the Federal Reserve before solid jobs data somewhat stupefied the market.

The strength of the US economy surprised many analysts as it came despite the rapid rise in the Fed funds rate since tightening began in March 2022.

Ultimately, Treasury yields are higher today than they were at this time last week and this helped to boost real yields. The real yield is the nominal bond return less the market-priced breakeven inflation rate, which is derived from Treasury Inflation Protected Securities (TIPS).

Gold being a non-interest-bearing asset, the increase in yields elsewhere could further undermine the yellow metal if that trend is to continue.

Overnight, Fed Chair Jerome Powell stuck to the Fed’s mantra, that being, further rate hikes are coming and that rates will need to stay high for quite a while to get inflation back down to their target of around 2%.

Risks assets, including equities and high beta growth-linked currencies, got a lift thanks to market perceptions that the Fed chief hadn’t pushed back hard enough on the market view that Fed is bluffing.

The interest rate market has raised the pricing of the terminal rate to near 5.15% but they still see a cut coming in late 2023. Something several Fed board members have consistently said is not likely.

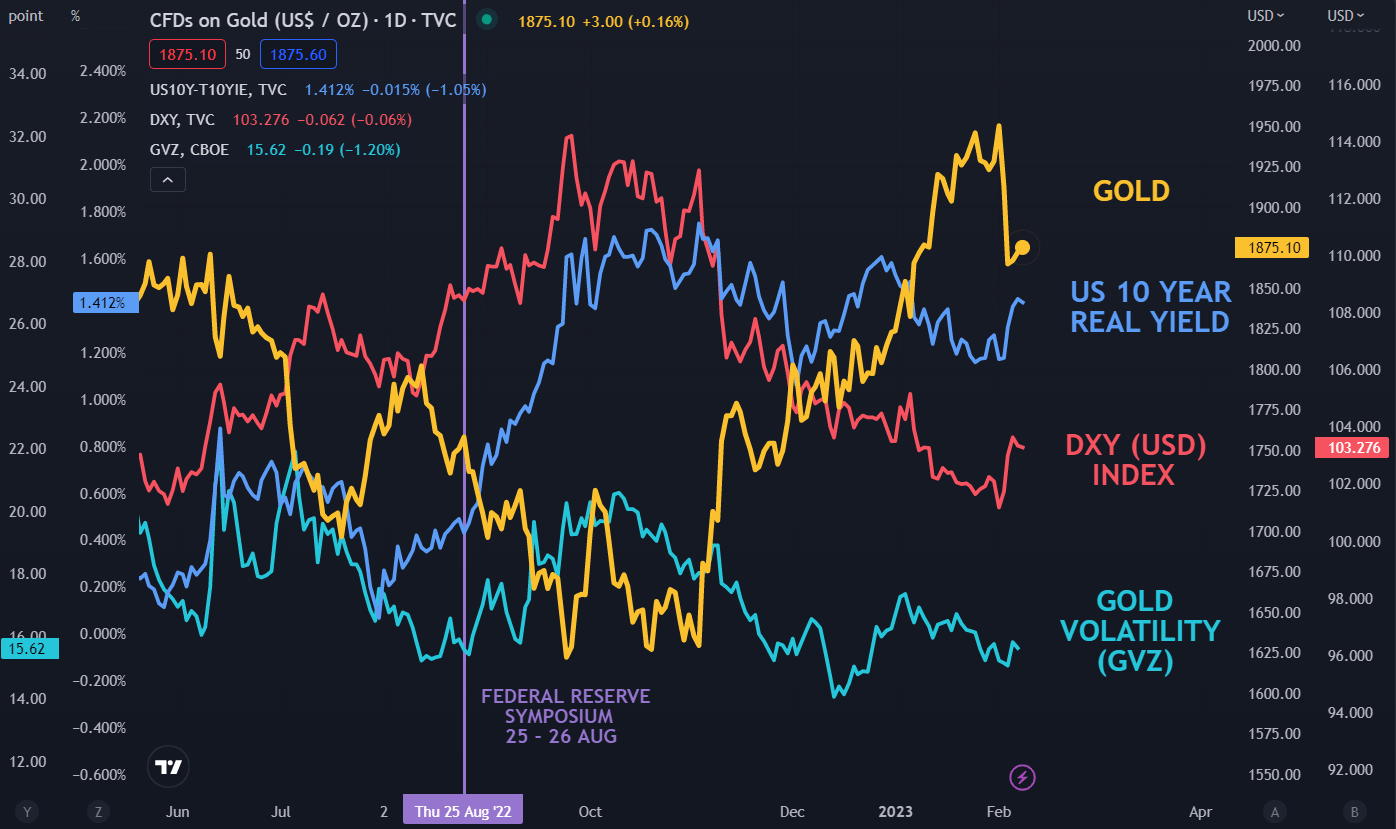
The US Dollar is softer into the Asian session today and gold is marginally firmer. Through all of the mayhem in other markets of late, gold volatility remains relatively low by historical standards. A breakout of volatility could see momentum build in the direction of the initial move.

GOLD AGAINST US DOLLAR (DXY), US 10-YEAR REAL YIELDS AND VOLATILITY (GVZ)

image1.png


Natural Gas Technical Outlook: A Pause or a Reversal?

Natural Gas Technical Outlook: A Pause or a Reversal?

NATURAL GAS TECHNICAL OUTLOOK – BEARISH

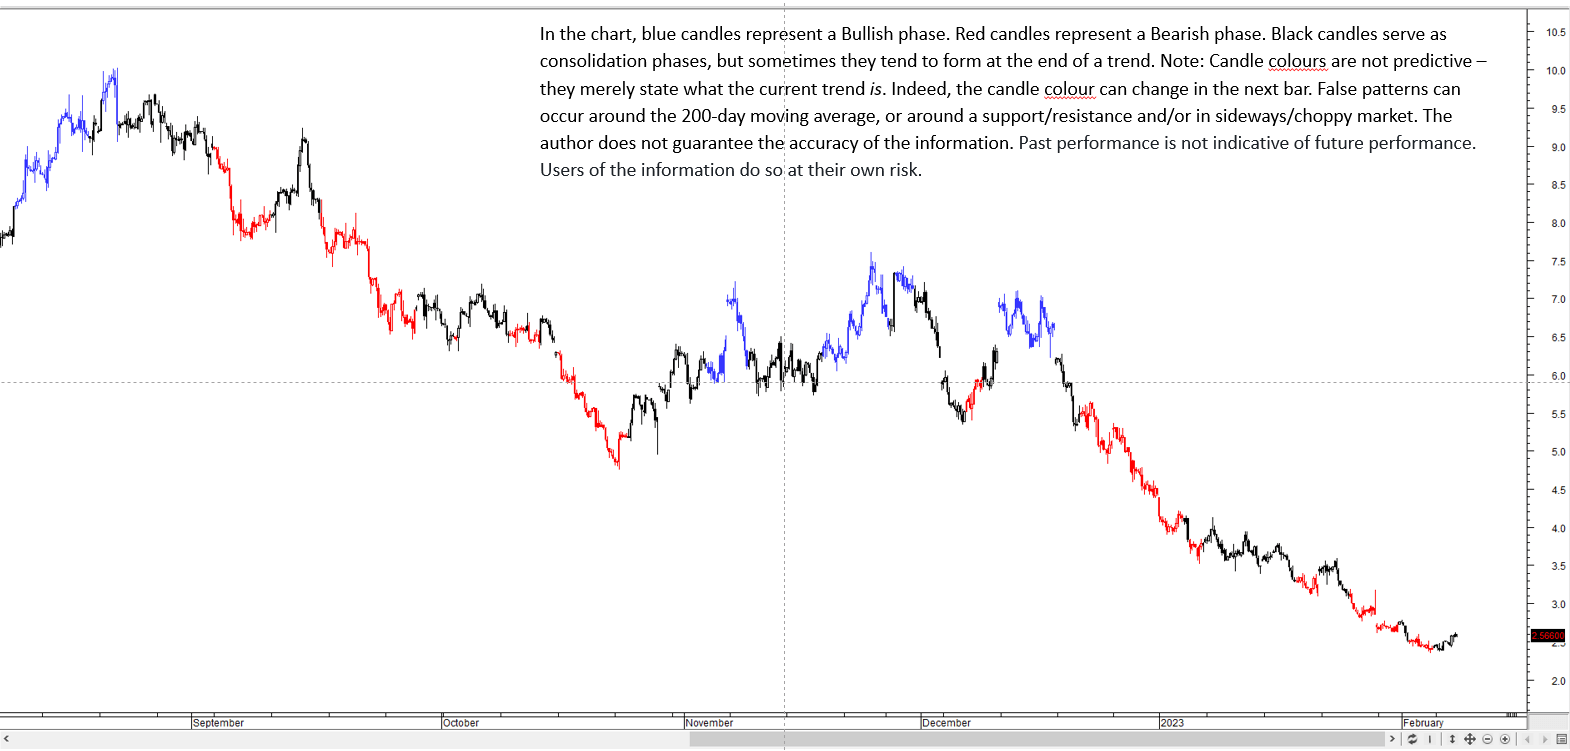
Natural gas prices may have rebounded materially in recent days, but so far it looks like a pause, rather than a reversal of the downtrend, even on some intraday timeframes.

US natural gas prices jumped to a one-week high on Tuesday despite forecasts for a largely warmer-than-usual period through Feb. 22. Also aiding gas prices is the growing view that Freeport LNG’s export plant in Texas would soon start to pull in more gas in the coming weeks after the company told regulators last week that it would start sending gas to one of three liquefaction trains at its long-closed export plants.

Natural Gas 240-minutes Chart

image1.png

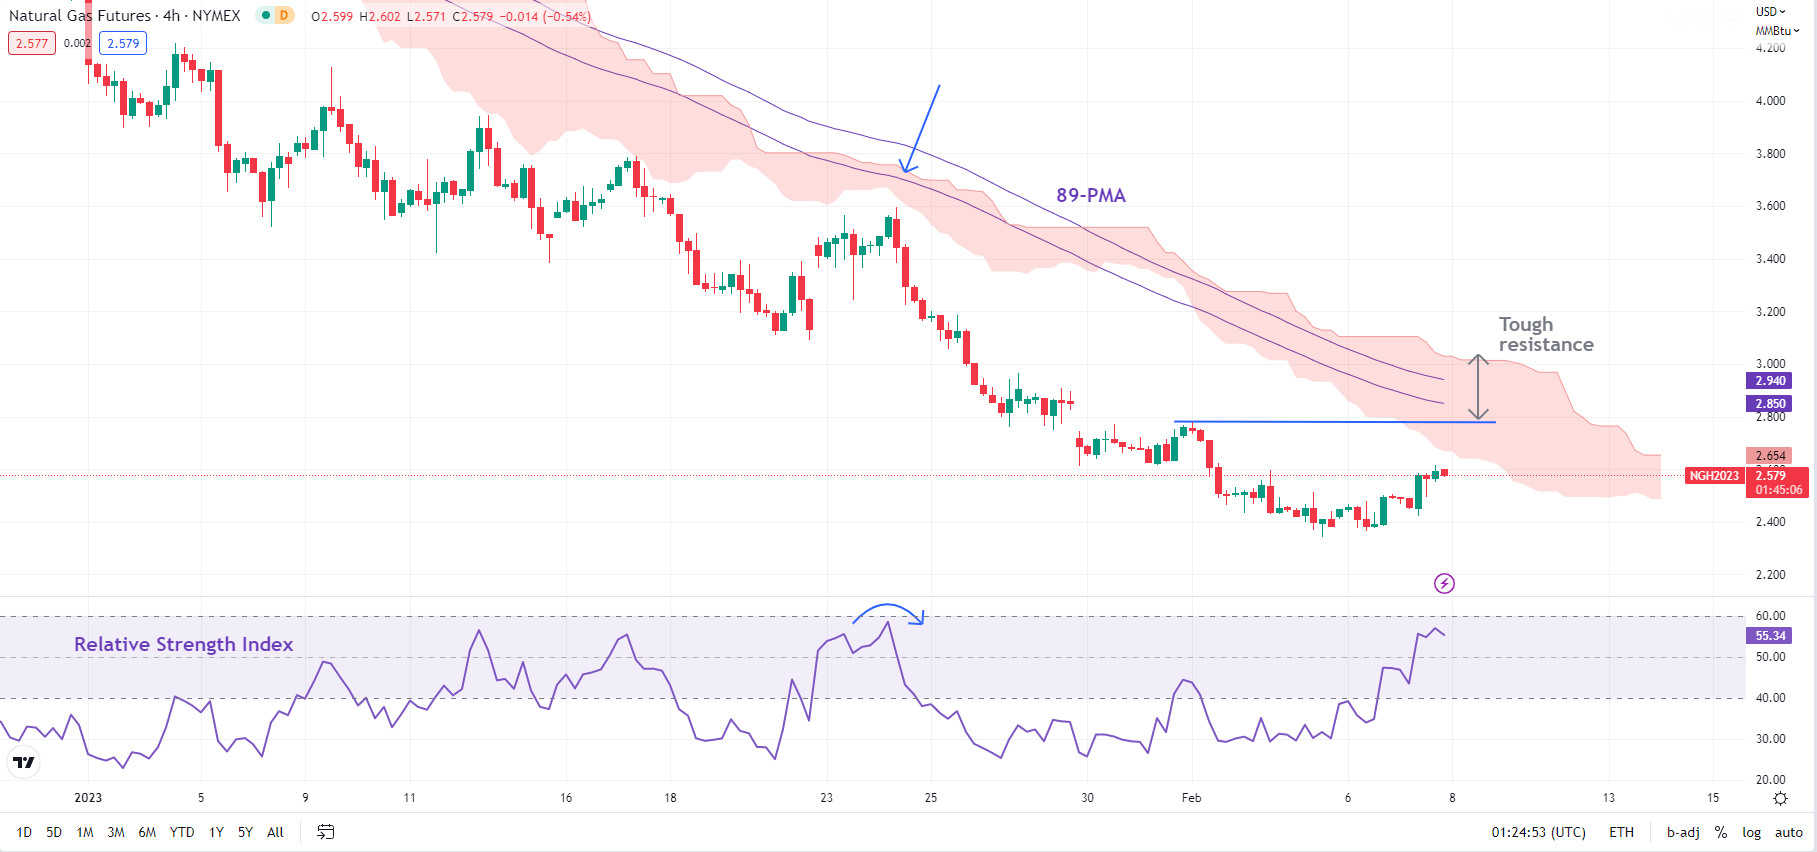
On technical charts, the bounce still looks like a pause/consolidation in the slide, at least yet (see 240-minute colour-coded chart). For instance, the 14-period Relative Strength Index on the 4-hour timeframe is still under 55 (corrective rallies tend to be capped around 50-55). Granted, the price action is still unfolding and the bounce could well extend, pushing RSI higher.

Natural Gas 240-minutes Chart

image2.png

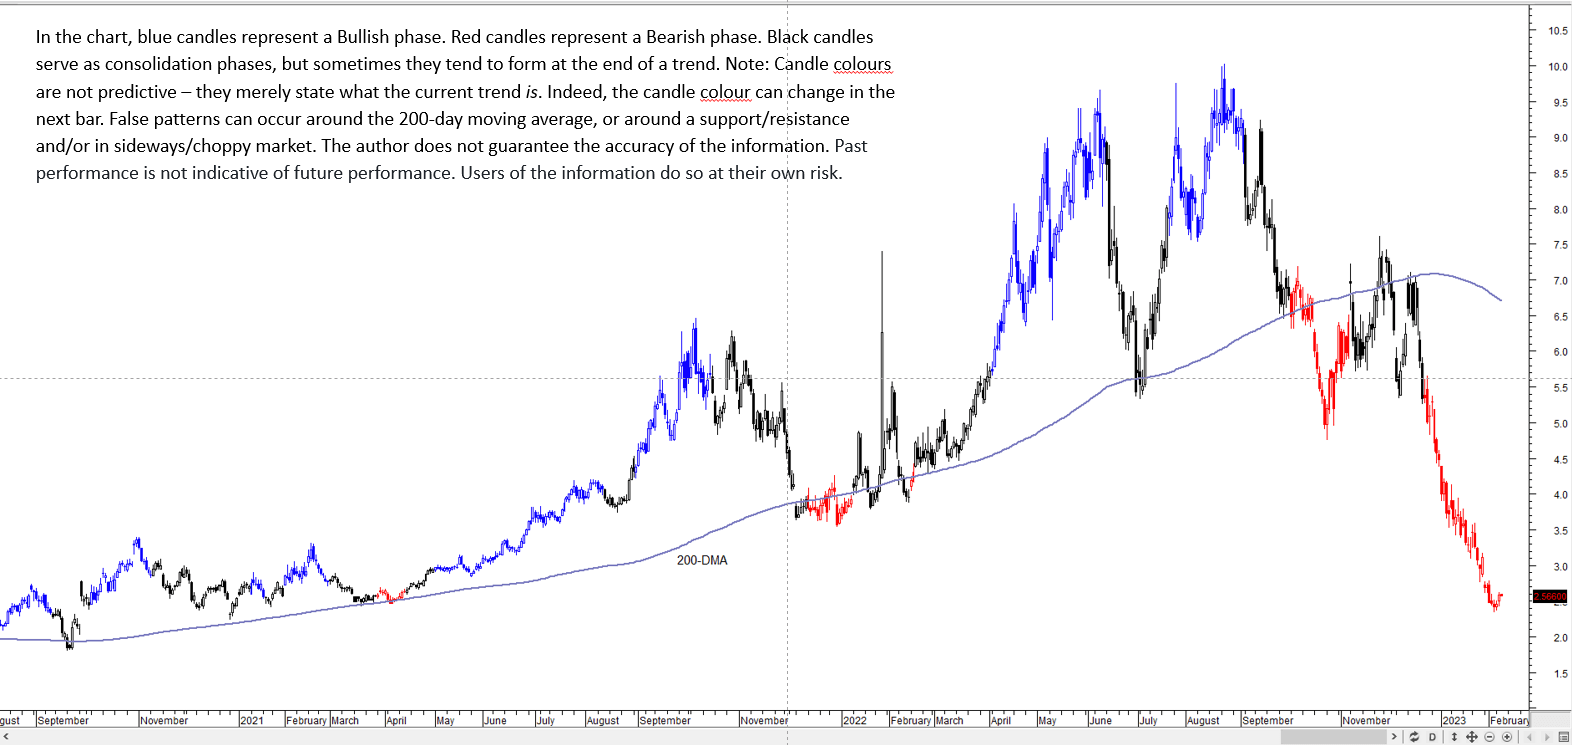
However, unless natural gas stays below tough converged resistance at the last week’s high of 2.78, the 89-period moving average on the 240-minute chart, and the Ichimoku cloud cover (at about 3.00), the path of least resistance is sideways to down. On the daily charts, the trend remains down (see the colour-coded daily chart).

Natural Gas Daily Chart

image3.png

Moreover, as highlighted in the previous update, a major double-top pattern (the 2022 highs) triggered at the end of last year points to further downside in natural gas, potentially toward the 2020 low of around 1.45 (see weekly chart). Immediate support is at last week’s low of 2.34, near the end-2020 low of 2.25. Subsequent support is a horizontal trendline from 1999, at about 1.45-1.50.

Crude Oli Hold the High Ground on US Dollar Weakness. Will WTI go Higher?

Crude Oli Hold the High Ground on US Dollar Weakness. Will WTI go Higher?

Crude oil has held onto overnight gains with the WTI futures contract trading above 77 U.S. Dollars and the Brent contract is trading over 83.50 U.S. Dollars.

Risk assets were generally buoyed going into the Asian session by the perception that Federal Reserve Chairman Jerome Powell was not hawkish enough in his commentary overnight.

Interest rate markets seem to have taken his comments on board, but equity and currency markets appear to be calling the Fed’s bluff.

Oil was further boosted by supplying supply chain issues arising in Turkey, due to the earthquake and in Norway, due to a technical fault.

Furthermore, inventory data from the American Petroleum Institute (API) revealed a 2.18-million-barrel deterioration rather than a build of a similar amount that had been anticipated for last week.

Currency markets have been very quiet through the Asian session after a wild US session that saw the greenback collapse across the board. The Japanese Yen and the Aussie Dollar were the main beneficiaries

Wall Street equities finished higher on the perceived less hawkish comments from Fed Chair Powell. This is despite Minneapolis Fed President Neel Kashkari maintaining that the peak in the Fed funds rate is likely to be near 5.4%.

Treasury yields are steady today, mostly holding on to the gains seen on Monday. The benchmark 10-year note is near 3.65%.

US President Joe Biden gave his State of the Union address after the North American close and while it covered a lot of ground politically, there was little in the address for markets. Inflation got a lot of attention but there was no reference to foreign policy.

Elsewhere, the Reserve Bank of India raised their key cash rate by 25 basis points to 6.5%.

The focus in the session ahead will be several speakers from both the ECB and the Fed.

The full economic calendar can be viewed here.

WTI CRUDE OIL TECHNICAL ANALYSIS

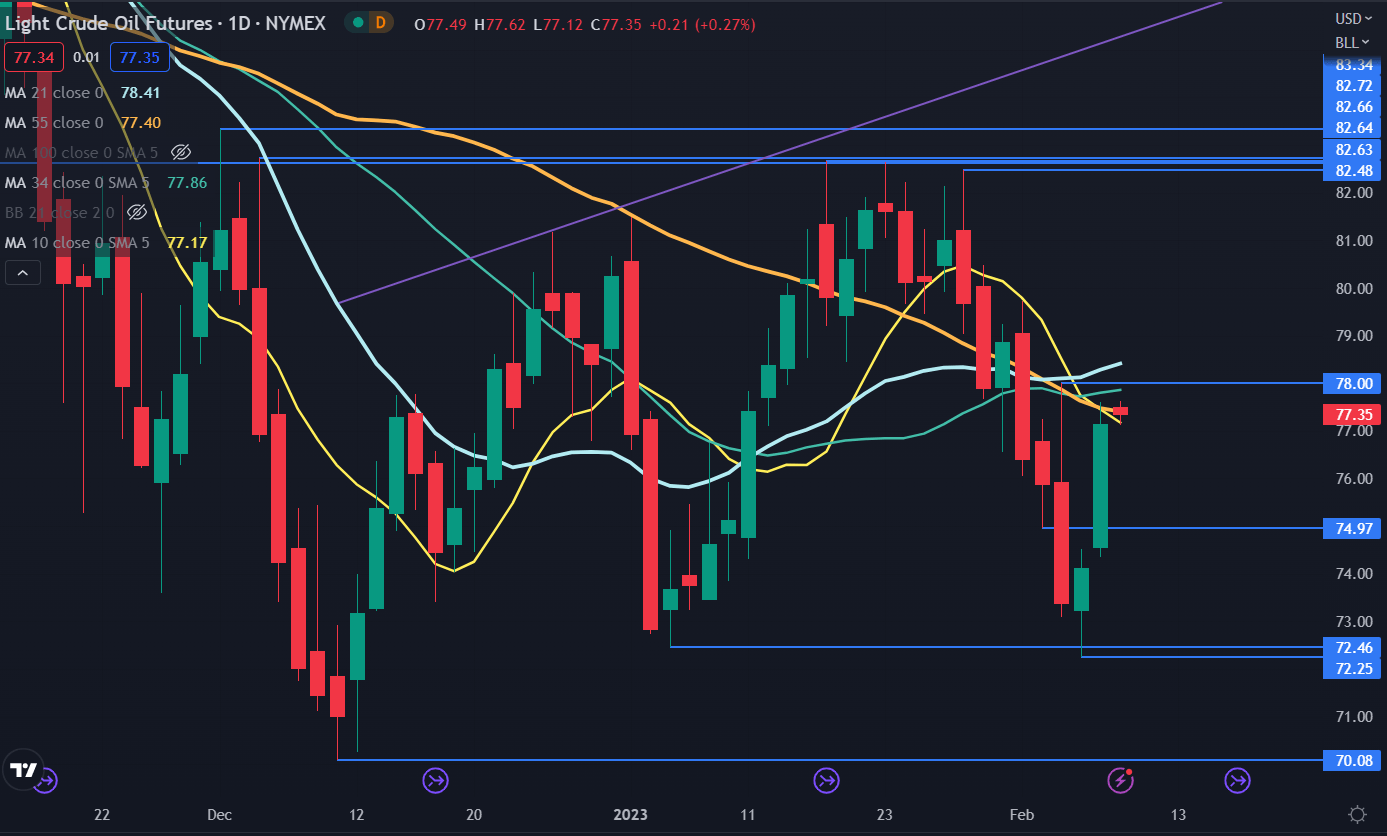
WTI crude oil has rallied to trade back in the range today.

The price is currently near the 10-, 21-, 34- and 55-day Simple Moving Averages (SMA). A significant break above or below these SMAs could signal a build of momentum in that direction.

Further up there could be a significant resistance zone in the 82.48 – 82.72 area, where there are several breakpoints and previous peaks.

On the downside, there could be support at the breakpoint of 74.97. Further down the prior lows of 72.25 and 70.08 may provide support

image1.png

Growth Versus Value Stocks: How Interest Rates Affect Valuations

Growth Versus Value Stocks: How Interest Rates Affect Valuations

When the Federal Reserve adjusts its monetary policy stance by either raising or lowering borrowing costs, the investment landscape changes, becoming more friendly or more hostile to the equity market. In this article, we will discuss how valuations and performance of value and growth stocks tend to be affected by rising and falling interest rates, but before we get to that, some context and definitions need to be established.

GROWTH STOCKS

Growth companies are often unprofitable and have speculative prospects, but investors are willing to pay a premium to own them because they have an innovative business/product that has the potential to deliver above-average returns over a long-term horizon, although there are no guarantees. They are riskier and therefore more volatile than the market in general, but their share prices usually rise faster than typical stocks because of their strong earnings growth outlook. Often, these high-flyers focus on increasing future revenue at the expense of delaying profitability, reinvesting their earnings into product research and expansion, so they do not frequently distribute capital to shareholders through dividends or buybacks.

VALUE STOCKS

Value stocks sit on the opposite spectrum. These are mature companies with a well-established business, solid balance sheets, proven history of financial performance and steadier but low growth over time. Despite their high quality and solid fundamentals, they have fallen out of favor and lost their “WOW” factor, so they trade a discount to the market and appeared undervalued based on various financial metrics such as price/earnings, price/book, cash flows, etc. Value companies typically pay dividends, offer lower volatility, and carry less risk than the market, but their share prices rarely experience explosive upward movements similar to those seen in the growth universe.

It is clear from the above introduction that different stocks have different characteristics; they are not created equal, so they will be affected by changes in monetary policy in dissimilar ways, but to try to gauge the possible impact, it is first necessary to understand a little about valuations. Very simplistically, the value of a company can be thought of as the present value of expected earnings.

By buying Apple’s shares, for example, a long-term investor has acquired an ownership claim in the company’s profits over time. To assign an intrinsic value to the perpetual cash flows associated with the business’ operations, analysts first forecast earnings growth and then discount the sum of the projected income stream to today’s dollars using a discount rate, usually a risk-free rate such as the 10-year U.S. Treasury yield. This is where interest rates play a huge role in equity investing.

Related: Everything You Need to Know About Types of Stocks

Let’s now analyze two imaginary companies, with different earnings profile over the next decade to determine how their value are affected by a changing interest rate environment. To do so, we’ll rely on a basic discounted cash flow model, using the formula below:

discounted cash flow model

The model is very basic and omits key variables for simplicity, but for our purposes is enough.

1. Value Company: Company XYZ is a well-established oil producer. XYZ is expected to generate $1,000,000 in cash flows next year, and grow them by 4% every year for the next 10 years. Let’s now value this company with the U.S. 10-year yield at 0.25% and then at 3%.

Value company cash flows

2. Growth company: Company ZZZ is a recently founded tech firm that launched an innovative cloud storage software. ZZZ is expected to generate $50,000 in cash flows next year, and grow them by 90% every year for the next 10 years. Let’s proceed to value this company with the U.S. 10-year yield at 0.25% and then at 3%.

Growth company cash flows

CONCLUSIONS

The tables above show that higher discount rates produce lower equity values, but the effects vary across investment styles. In general, however, growth companies will be more sensitive to rising interest rates because of the nature and path of their cash flows: little in their early stages, large later in their life cycle.

Going back to the two hypothetical examples, growth company ZZZ lost 21.3% of its value when the discount rate used went from 0.25% to 3.0%. In real life, the less attractive valuation will likely coincide with a steep drop in the company’s stock price. Company XYZ was also affected by the change in the rate environment, but its present worth only fell by 14.3%, suggesting that companies with value characteristics may fare better when monetary policy becomes more restrictive.

Focusing on real life examples, the charts below are composed of two panels. The upper panel shows the ratio between IWD (iShares Russell 1000 Value) and IWF (iShares Russell 1000 Growth), and the lower panel displays the U.S. 10-year yield by itself.

Chart 1 is from January 2020 to May 2020. During this period, when the 10-year yield dropped from about 1.89% to 0.66%, the IWD/IWF ratio declined roughly 19%, pointing to strong growth outperformance.

CHART 1 – IWD/IWF RATIO VS US 10-YEAR YIELD (JANUARY 2020-MAY 2020)

IWD/IWF ratio

Chart 2 is from January 2022 to May 2022. During this time span, the 10-year yield climbed from 1.50% to about 2.85%. Simultaneously, the IWD/IWF ratio advanced roughly 20%, indicating strong value factor outperformance in an interest rate environment.

CHART 2 – IWD/IWF RATIO VS US 10-YEAR YIELD (JANUARY 2022-MAY 2022)

IWD IWF ratio versus 10 year yield