ASX 200 and KOSPI Technical Outlook: Kospi is Getting Ripe for a Rally

ASX 200 and KOSPI Technical Outlook: Kospi is Getting Ripe for a Rally

ASX 200 TECHNICAL OUTLOOK – BULLISH

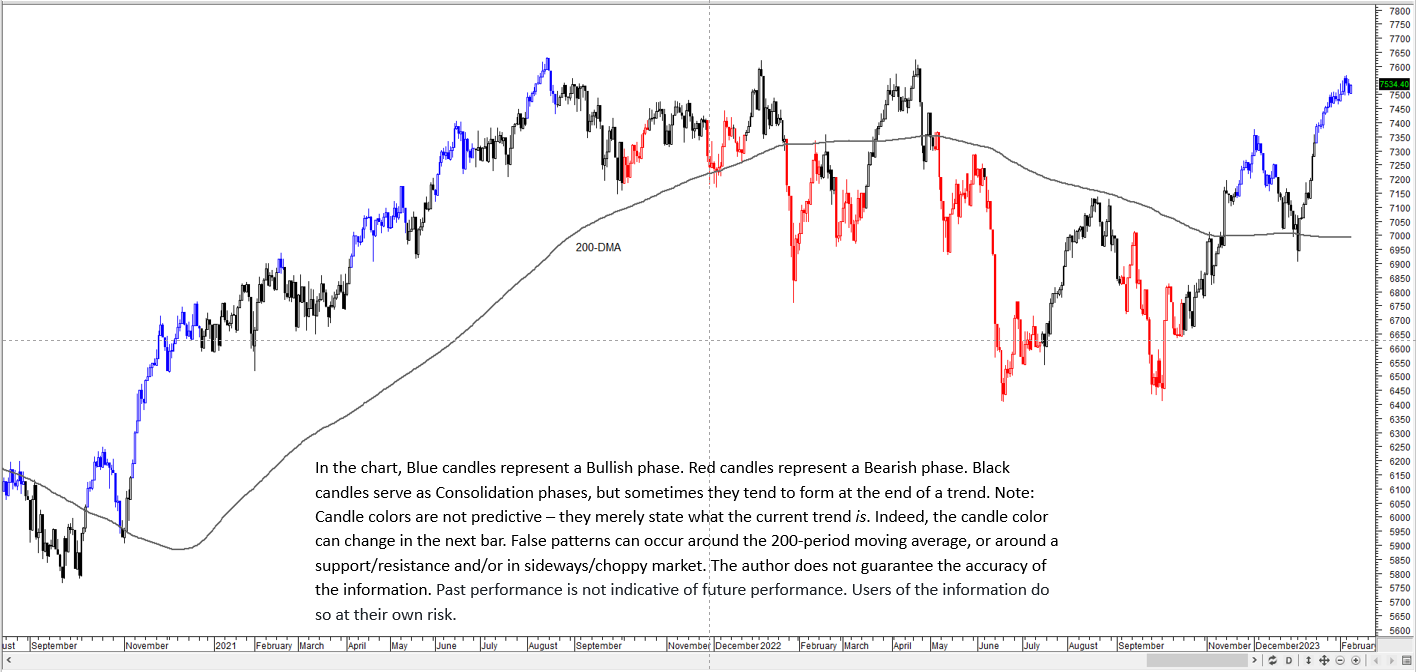
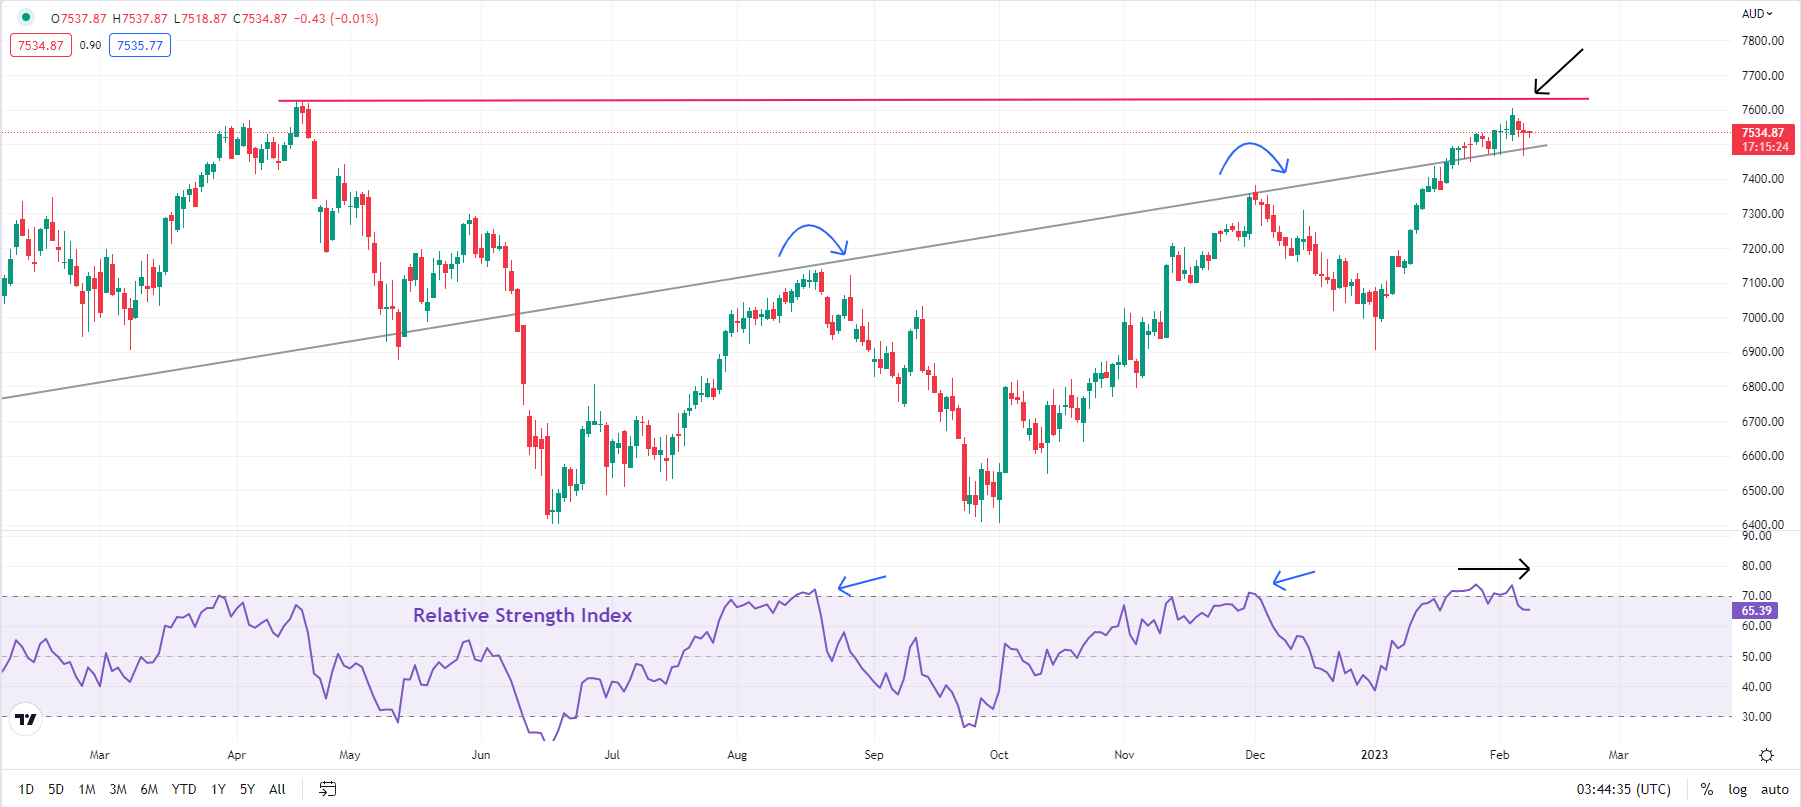
Australia ASX 200 index’s rally is showing signs of fatigue as it tests tough converged resistance on a rising trendline from a year ago and the April 2022 high of 7624, shade below the record high of 7633 hit in 2021. Flagging momentum on the daily chart — the 14-day Relative Strength Index (RSI) has been turning lower just as the index rose to a fresh higher earlier this week — suggests the index could find it difficult to crack the converged ceiling.


ASX 200 INDEX Daily Chart


image1.png


Chart Created by Manish Jaradi using Metastock


From a directional perspective, on the daily charts, the trend is up (see the daily chart). However, some consolidation/a minor retreat can’t be ruled out given overbought conditions. Moreover, in the last couple of weeks or so, the index has struggled to extend gains, potentially a sign of buyer fatigue.

ASX 200 INDEX Daily Chart


image2.png

Chart Created by Manish Jaradi Using TradingView

Immediate support is at the December high of 7375. Any break below would indicate that the short-term upward pressure had faded, pointing to a range developing. The broader uptrend is unlikely to be threatened while the index holds above the 200-day moving average (now at about 7000). As highlighted in the previous update, the break toward the end of 2022 above the August high of 7138 triggered a double bottom (the June 2022 and the October 2022 lows), pointing to a potential rise toward 7865.

KOSPI COMPOSITE INDEX TECHNICAL OUTLOOK – NEUTRAL

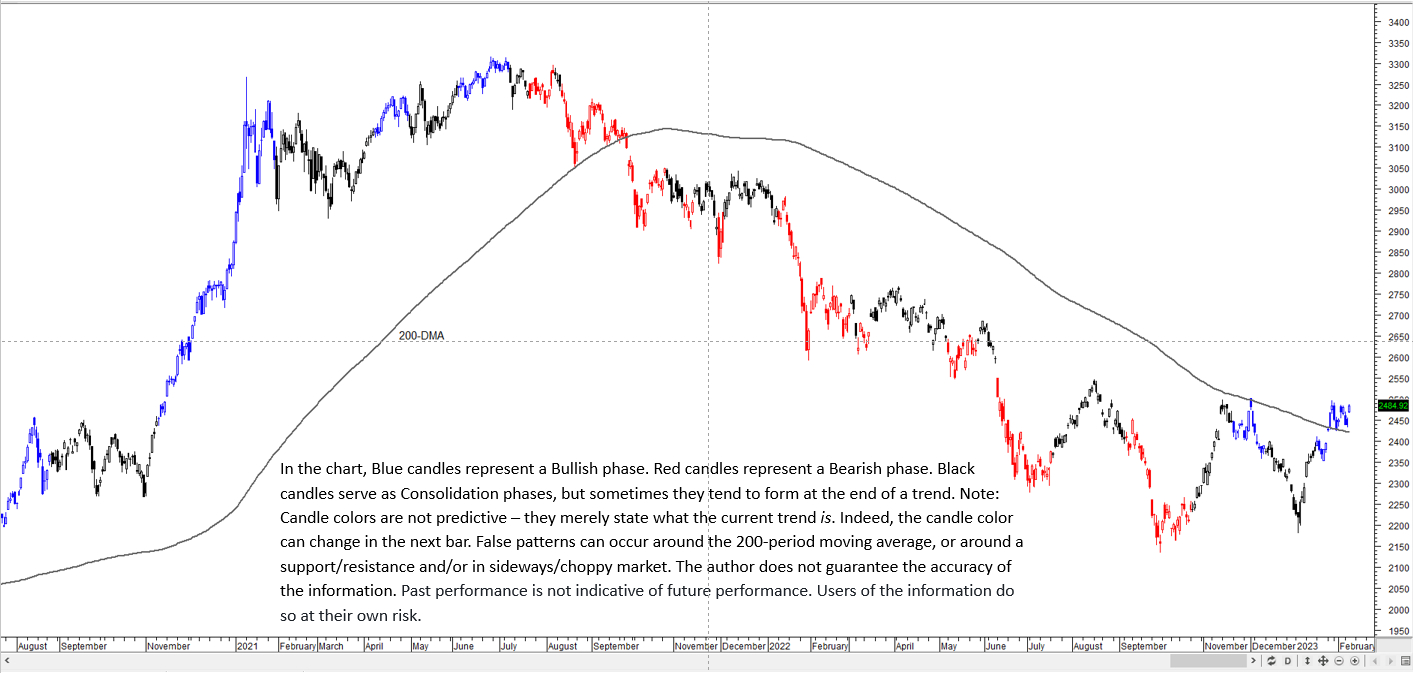
The Kospi Composite Index has lagged some of its peers in recent weeks but appears to be getting ripe for a rally.

KOSPI Daily Chart

image3.png

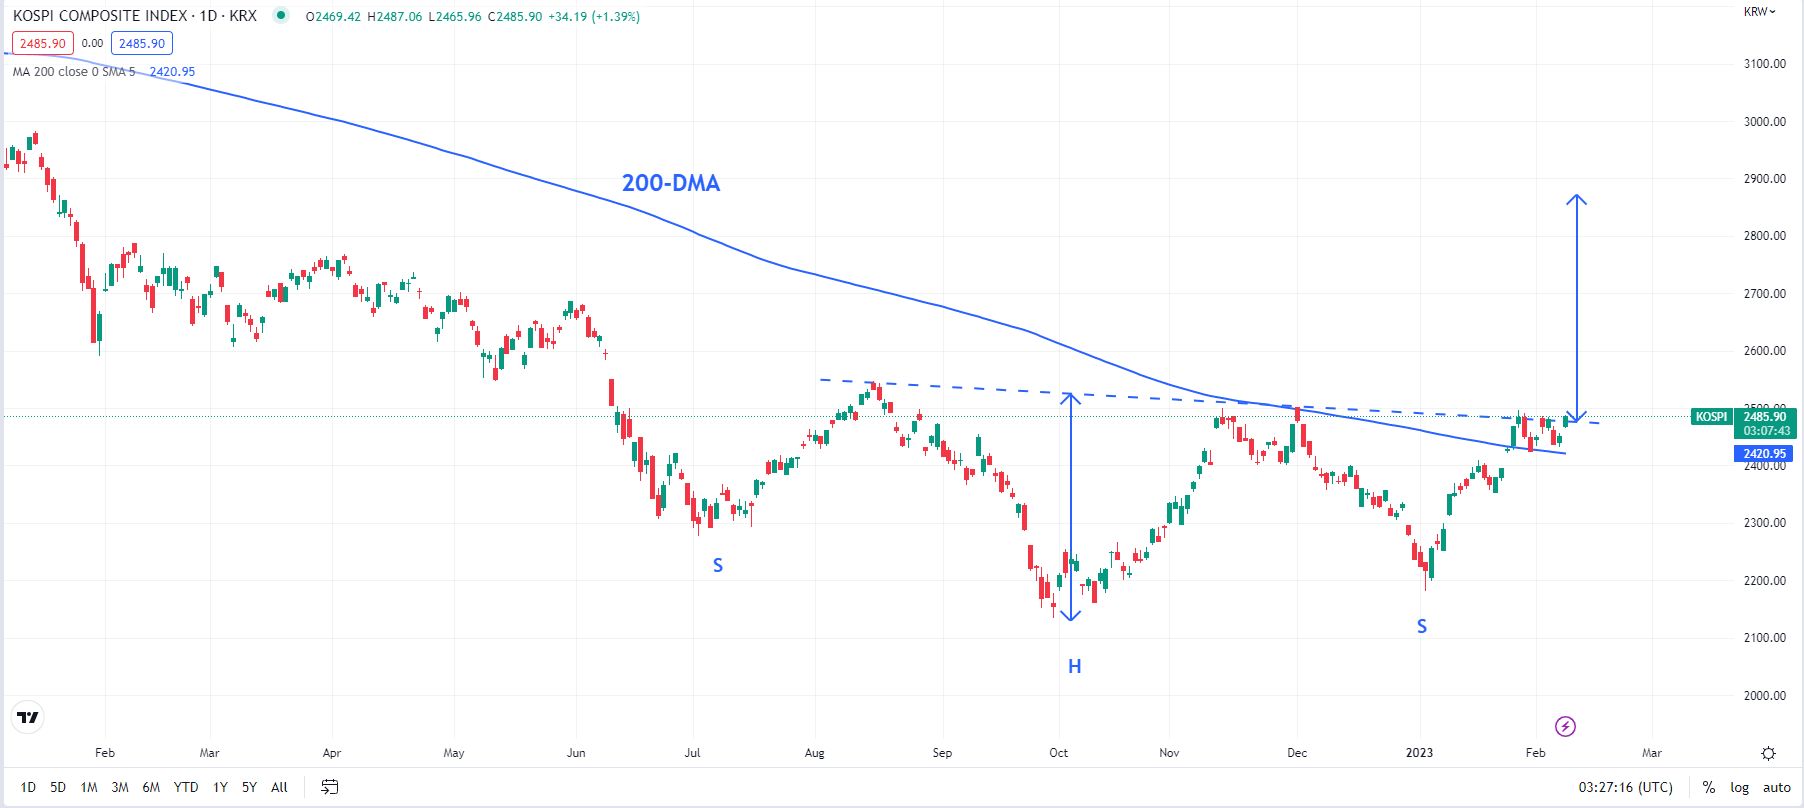
The South Korean benchmark index is attempting to rise above crucial resistance that could shape the trajectory for the coming weeks. A decisive break (2 daily closes) above the marginally downward-sloping trendline from August (at about 2480) would trigger a reverse head & shoulders pattern (the left shoulder is the mid-2022 low, the head is the September low, and the right shoulder is the early-January low), paving the way toward 2870.

KOSPI Daily Chart

image4.png

Such a break would also coincide with a rise above the 200-day moving average for the first time since late 2021 – a sign that the multi-month downward pressure was fading. For the bullish view to unfold, the index, at minimum, needs to hold above immediate support at the mid-January low of 2355. Strong support is at the early-January low of 2181.

Brent Crude Oil Taking Advantage of Weaker USD, IEA Outlook & Supply Interruptions

Brent Crude Oil Taking Advantage of Weaker USD, IEA Outlook & Supply Interruptions

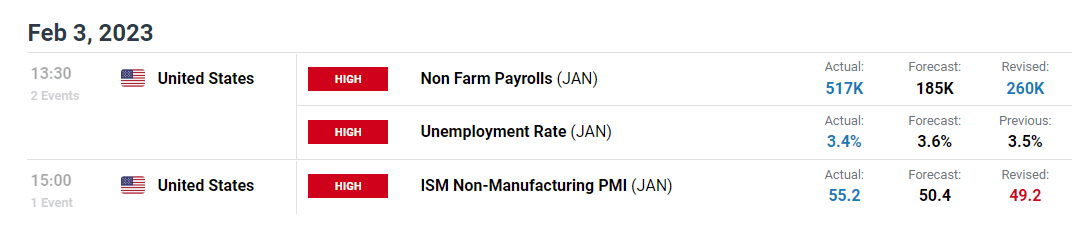
Brent crude oil is trading higher this Tuesday morning with a flurry of supportive fundamental factors in play. Beginning with the USD, a hawkish Fed official (Bostic) hinted at further rate hikes and possibly the move back to 50bps increments. Unfortunately for the greenback, the Dollar Index (DXY) didn’t rally as expected largely due to the fact that today’s address by Fed Chair Jerome Powell will attract markets attention. Taking into consideration last week’s stellar Non-Farm Payroll (NFP) report, it will be interesting to see whether Mr. Powell reinforces an aggressive stance to monetary policy or not. The former could be detrimental for crude oil prices negating recent upside gains.

Closing out the trading day, weekly API data will fall under the spotlight and should recent higher stocks release again, crude oil may be under pressure once more.

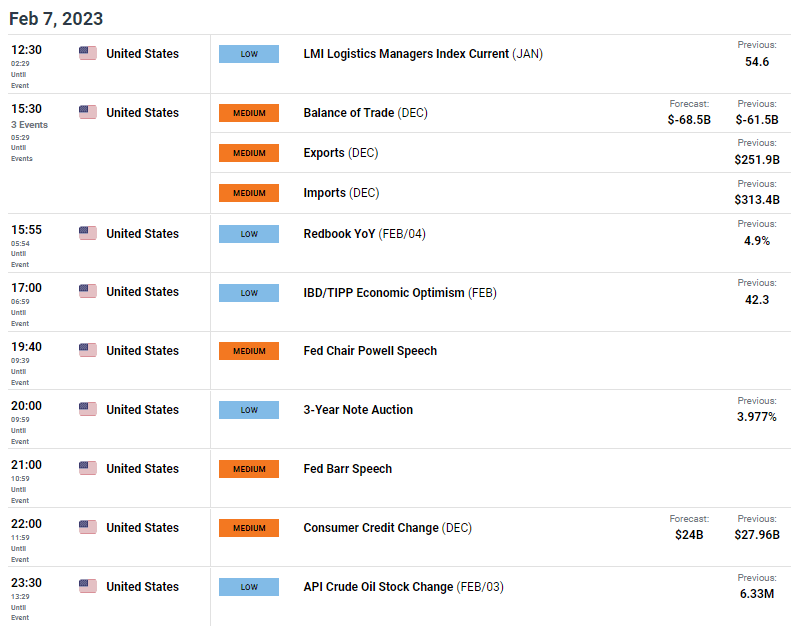
ECONOMIC CALENDAR

image1.png

The IEA reported that roughly “half of global oil demand will come from China”, fanning the China re-open story and buoying crude oil. The recent tragedy impacting Turkey and Syria has reached as far as the oil market by way of devastating a key export terminal in Turkey. The disruption in supply chain will hold from February 6 – 8 curbing supply to markets.

TECHNICAL ANALYSIS

BRENT CRUDE (LCOc1) DAILY CHART

image2.png

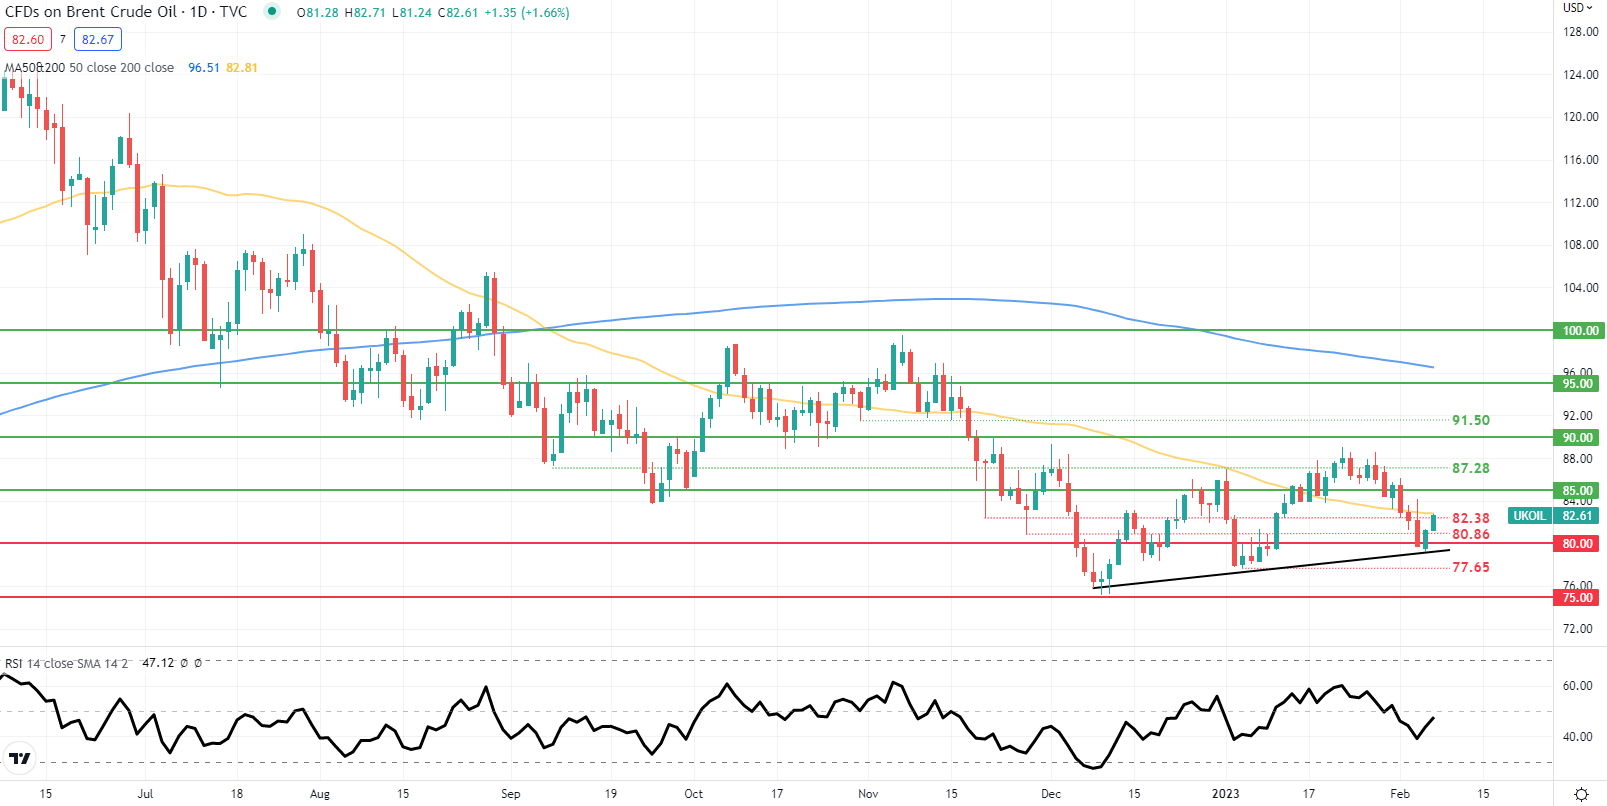
Price action on the daily Brent crude chart above shows bulls defending the short-term trendline support (black) coinciding with the 80.00 psychological handle. The 50-day SMA (yellow) is under threat but caution is being exercised by market participants as revealed by the Relative Strength Index (RSI) favoring neither bullish nor bearish momentum at this point. As mentioned above, Fed Chair Jerome Powell’s address is highly anticipated and could provide the catalyst short-term.

Dollar Extends Rally for a Few Key Breaks, S&P 500 Throttles its Descent

Dollar Extends Rally for a Few Key Breaks, S&P 500 Throttles its Descent

The fundamental aftermath of last week’s calendar is strong, but that doesn’t mean it will continue to drive speculative development through the foreseeable future. With the US Dollar, the combined FOMC hike, nonfarm payrolls beat and service sector activity acceleration has kept the rate forecast charge going through Monday trade. On the other hand, the interest rate implications didn’t seem to carry the same gravitas for risk assets like the US indices. Perhaps that will change when if there is a more direct hit to the core of the retail speculative resurgence – a troubling possibility with some meme stock trouble afterhours. Taking stock of sentiment to start the week, the S&P 500 extended the retreat it kicked off through the end of last week. The incredible head fake that began with the FOMC rate hike (and prominent market discount to their forecast) was followed by the significant beat on the labor and ISM reports through Friday. The volatility through that session was palpable with a 1.0 percent gap lower on the open and the largest upper wick in three months, but SPX was only lower by -1.0 percent by the close. Monday’s -0.6 percent extension on a smaller daily range and noticeably more restrictive volume only adds to that measured perspective. But there is reason to be cautious ahead.

Chart of S&P 500 with Volume, 20 and 200-Day SMA and Gaps (Daily)
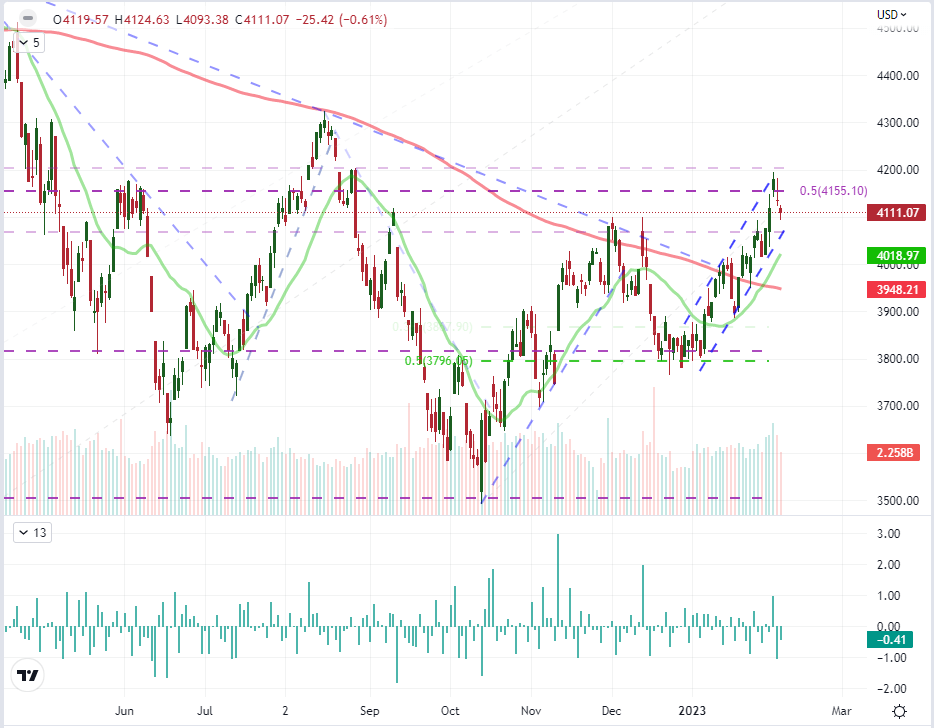
image1.png

In the market charge that we have seen specifically over the past month (as much as an 11 percent gain for the S&P 500), there has been a particularly uneven fundamental backdrop. Over that period there was a very modest improvement in US growth forecasts (the IMF raised its 2023 outlook 0.4 percentage points to 1.4 percent) and interest rate expectations for the Fed were essentially flat. So where did the markets draw that level of inspiration? It would seem to come from more speculative sources – as opposed by longer duration investors. We can see that in comparisons like the Nasdaq 100 to the Dow index (growth to value), the surge in retail options activity or the deterioration of yield premium for ‘junk’ assets among other measures. Perhaps the most poignant indication though was the surge in a few key meme stocks this past session. AMC shares surged as much as 21 percent and GameStop charged up to 13 percent this past session, but both paled in comparison to the Bed Bath & Beyond explosion to a Monday peak gain of 130 percent over Friday’s close. Yet, in one of the fastest lessons the market has given in some time, the company announced after the close that it intended to raise over $1 billion; and if the effort failed, they could file for bankruptcy.

Chart of Bed Bath and Beyond with Volume and ROC, Overlaid with GameStop and AMC (Daily)
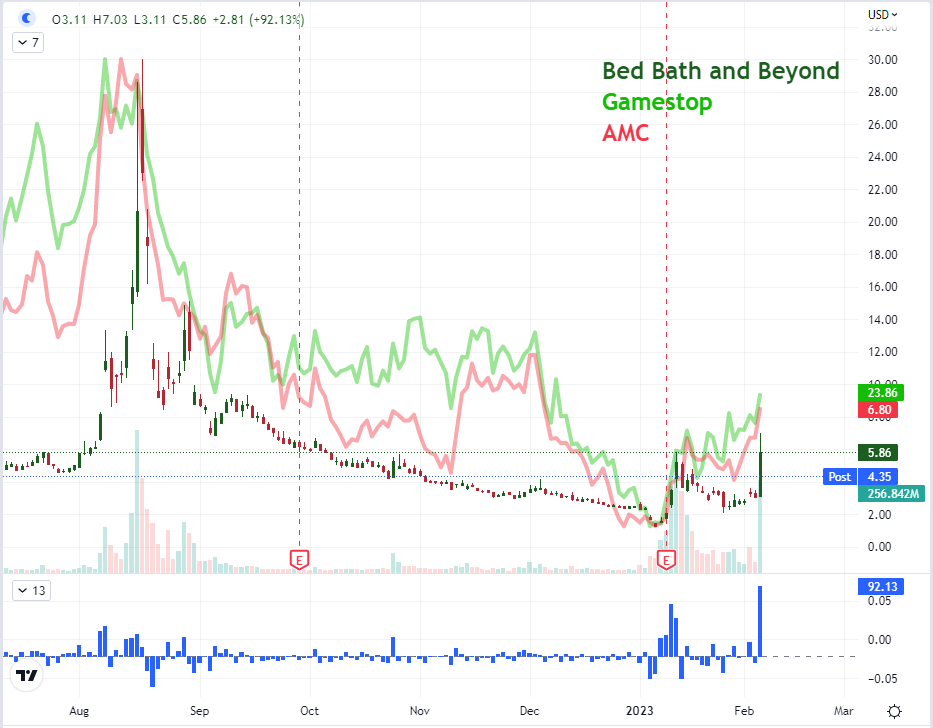
image2.png

Gauging the course forward with principal fundamental drivers, it is important to evaluate where there is productive development to be found on themes. Through this past session, there was a very clear sustained advance in interest rate expectations behind the US central bank. While the FOMC rate hike last and Fed Chairman rhetoric last week was certainly worth of the attention, it earnestly elicited only the market’s skepticism. It wasn’t really until the combo of the NFPs and ISM Friday that the ‘onus’ of a strong US economy leading to a reasonable belief in the Fed’s commitment that the market really took the outlook seriously. Through this past session, the rate forecast continued to charge with the implied Fed Funds rate through futures through midyear rise to the central bank’s own 5.1 percent target and the year-end discount of rate hike/s dropped from approximately -44 basis points to -24. Now, after the strongest three-day rally for the DXY Dollar Index since the September peak was found and with notable resistance above, what will carry us to the next technical milestone? There isn’t much rate discount to work off from here. But perhaps a more meaningful risk aversion can activate another leg of the Dollar’s appeal.

Chart of DXY Dollar with 50-Day SMA, 3-Day ROC Overlaid with Implied Fed Rate Dec 2023 (Daily)
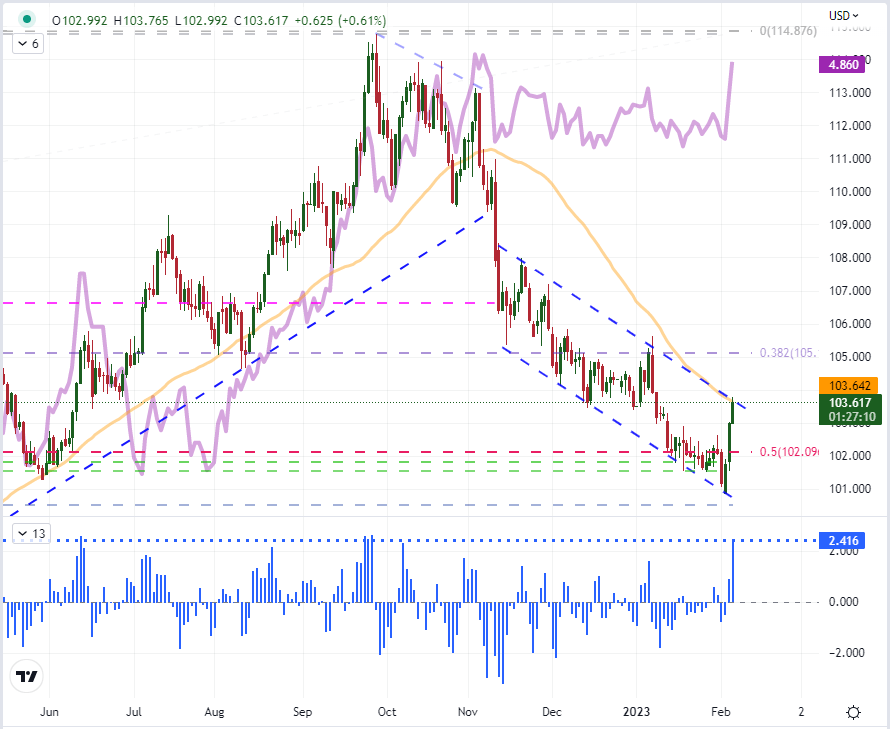
image3.png

Among the Dollar-based crosses that I am watching, to pairs looked particularly notable through Monday’s close. EURUSD dropped the 20-day SMA through the end of last week as well as the floor of the rising wedge formation from November. However, it didn’t really register as a full break. The follow through on Monday however gave it more distinctiveness. There is a 50-day moving average below that pair around 1.0690. That said, I still prefer USDJPY as a more fundamentally charged cross. There is a greater sensitive to interest rate differentials and principally the Fed’s interests are taken more seriously here – though news the BOJ was talking to a well-known dove as Kuroda’s forthcoming replacement added some lift. Risk trends are even more distinctive here as well. I will be watching this pair’s battle with the 38.2 percent Fib of the 2021-2022 range at 133 as the next decision point.

Chart of USDJPY with 20 and 50-Day SMA, Daily Gaps (Daily)
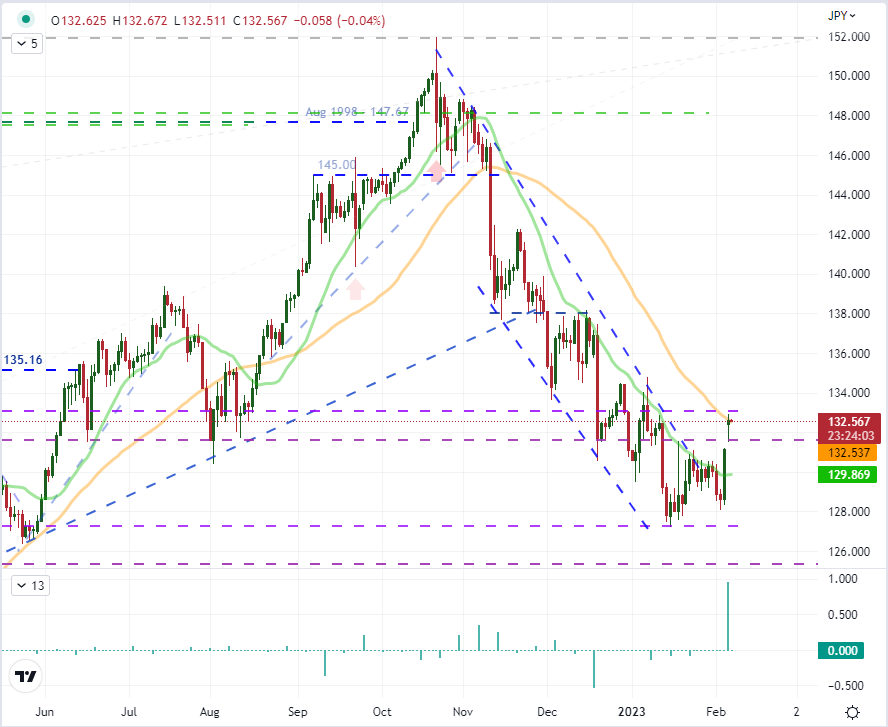
image4.png

From the scheduled event risk over the next 24 hours, there is a significant volume of updates due; but the weight of the listings is not particularly high. The most potent event for volatility would be the Reserve Bank of Australia (RBA) rate decision. Though there has been a lot of rate tempo oscillation this past week, the Australian group had cooled its outlook a few months back. That could very well change if the group picks up some of the worry the Fed has adopted over inflation, but that seems an outlier outcome. Fed Chairman Powell’s remarks are not likely to be much different than the rhetoric he has offered previously, but the market seems to be particularly sensitive to US rate forecasting which may change the response cadence.

Top Global Macro Economic Event Risk for the Next 24 Hours
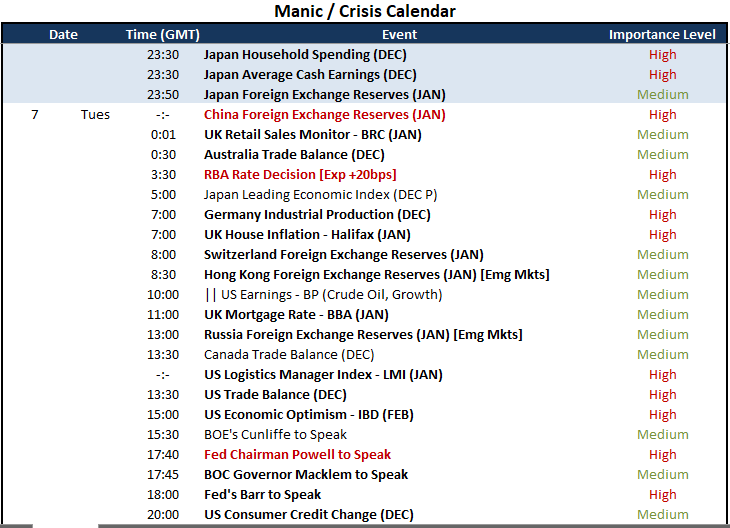
image5.png

GBP/USD Technical Outlook: Approaching Key Support

GBP/USD Technical Outlook: Approaching Key Support

GBP/USD SHORT-TERM TECHNICAL FORECAST – NEUTRAL

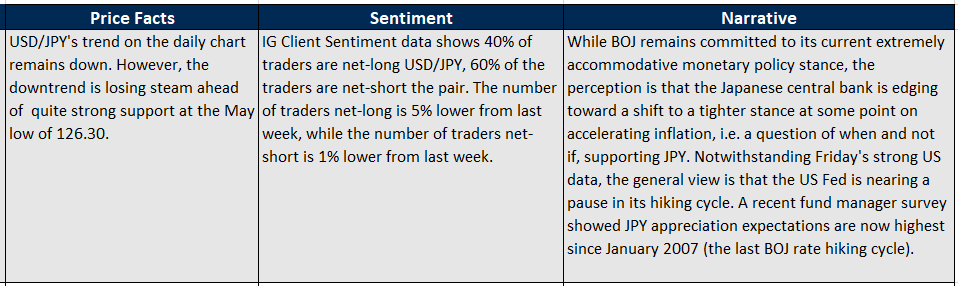
GBP/USD is nearing key technical support that could determine the trend for the next few weeks, possibly a few months.

A minor double top triggered on intraday charts points to the possibility of a drop to 1.1840 (see the previous update highlighting the case), roughly coinciding with the 200-day moving average, the Ichimoku cloud cover, and the October high of 1.1645. This support is strong and given the evolving trend on the weekly chart, the chances of the support area of 1.1645-1.1840 holding are high.

Price Facts, Sentiment, Narrative

image1.png

The risk of course is that a break below would trigger a minor double top (the December and January highs), potentially opening the way toward 1.1250. Moreover, it could negate the possibility of a bullish reverse head & shoulders pattern unfolding on the weekly charts (see the January 20 update).

GBP/USD Daily Chart

image2.png

For now, though, the Plus Directional Movement Index (DMI) and Minus DMI remain below 25, pointing to range continued range conditions (seethe end of November update hereandmid-January here). Furthermore, the relative monetary policy outlook supports a range view with perhaps a softer GBP/USD bias. Last week, the Bank of England (BOE) hiked interest rates by 50 basis points, while the US Federal Reserve raised rates by 25 basis points, as widely expected.

GBP/USD Weekly Chart

image3.png

The BOE scaled back some of its previous bleak economic forecasts and acknowledged easing inflation but indicated in its statement that smaller hikes and an eventual end to the tightening cycle may be in the cards in coming meetings. The Fed acknowledged early signs of disinflation, but Chair Powell said the central bank could conduct a few more rate hikes to bring down inflation to its target. On balance, the BOE hinted rates are near peak, while the Fed stopped short of indicating a pause, marginally weighing on GBP/USD.

Australian Dollar Jumps Post RBA Hike of 0.25% as Expected. Where to for AUD/USD?

Australian Dollar Jumps Post RBA Hike of 0.25% as Expected. Where to for AUD/USD?

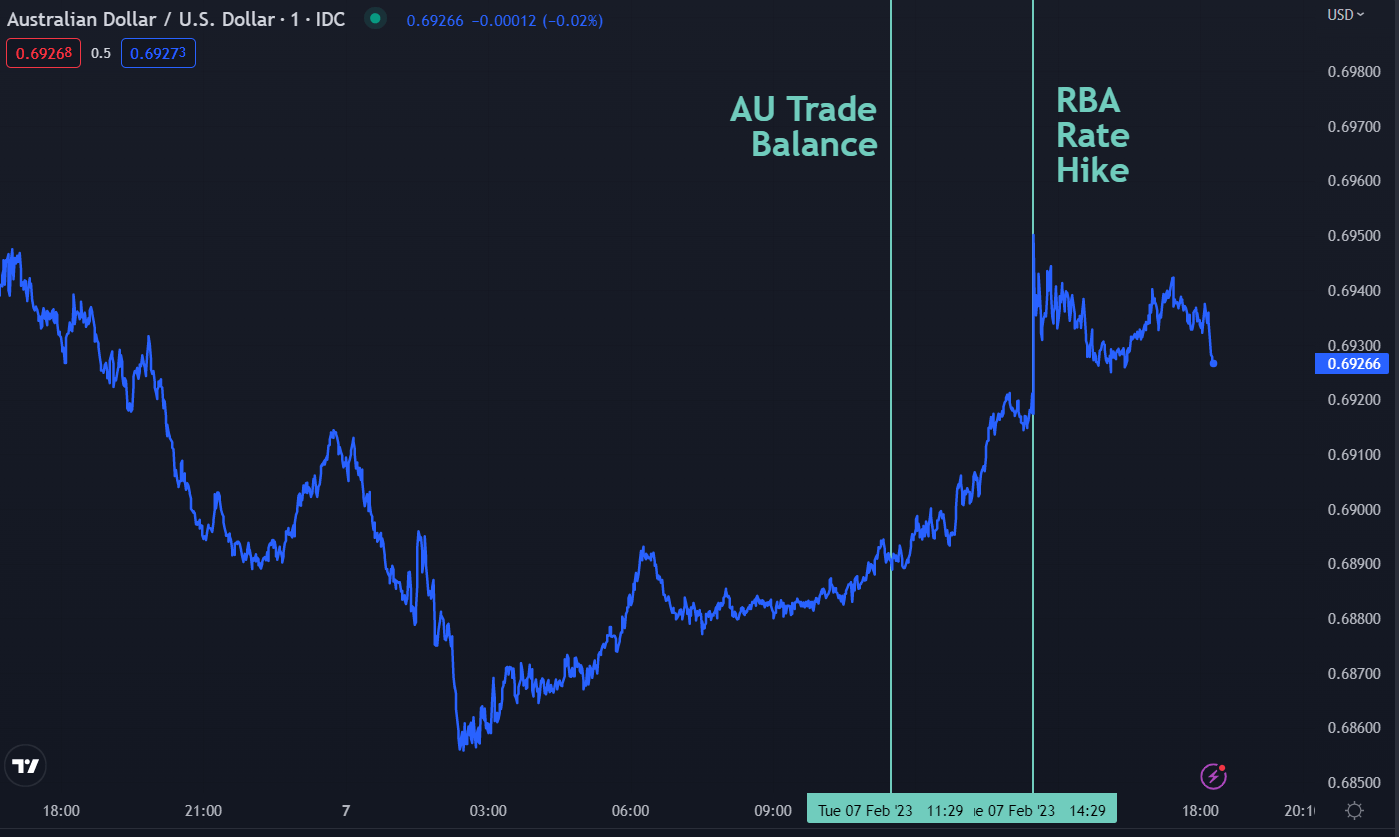
The Australian Dollar bumped high after the RBA raised its cash rate target to 3.35% from 3.10%, a total of 325 basis points has been added since the first hike in May 2022. It has since retraced most of the gains.

It seems that the re-acceleration of CPI has caused some concern at the top of Martin Place with the latest quarterly figures providing a headache for the bank.

To recap, the headline CPI of 7.8% beat forecasts of 7.6% year-on-year to the end of December and it was against 7.3% prior.

The December quarter-on-quarter headline CPI was 1.9% rather than the 1.6% anticipated and 1.8% previously.

The RBA’s preferred measure of trimmed-mean CPI was 6.9% year-on-year to the end of 2022 instead of estimates of 6.5% and 6.1% prior.

The trimmed mean quarter-on-quarter CPI read of 1.7% was above the 1.5% forecast and there was a revision to the prior quarter, up to 1.9%.

The market was undecided on a hike before the CPI data but quickly increased the odds on the evidence of growing price pressures. The futures market is starting to lean toward another potential 25 bp hike in March.

The RBA said in their accompanying statement, “The Board expects that further increases in interest rates will be needed over the months ahead to ensure that inflation returns to target and that this period of high inflation is only temporary.”

Earlier in the day, the trade surplus for December came in at AUD 12.25 billion, pretty much in line with estimates of AUD 12.45 billion and the prior surplus of AUD 13.2 billion saw an upward revision to 13.45 billion.

The January surge in iron ore, copper, gold, aluminium and nickel will further boost the domestic economy.

A lead indicator that could further stoke the flames of inflation is building approvals that came in at an 18% increase month-on-month for December. The unemployment rate remains near multi-generational lows at 3.5%.

All the macro data points to an economy firing on all pistons. It appears that the only cloud on the horizon is the concern around the rolling over of fixed-rate mortgage holders.

Much has been made of the so-called ‘mortgage cliff’ as many household borrowers took out fixed-rate loans when the interest cost was 3% lower. A large number of these loans are expected to roll over in 2023.

The RBA acknowledged this issue in the statement as they cited the lag effects of changes in monetary policy.

AUD/USD might get an initial bout of support from a more hawkish tilt from the bank, but the Fed has also picked up its hawkish rhetoric on its rate path. If the US Dollar gathers steam, it may not matter what the RBA does in terms of the impact on the Aussie Dollar.

AUD/USD CHART

Japanese Yen Technical Outlook: Is USD/JPY Building a Base?

Japanese Yen Technical Outlook: Is USD/JPY Building a Base?

USD/JPY SHORT-TERM TECHNICAL FORECAST – NEUTRAL

The Japanese yen’s slide against the US dollar in recent days confirms that the upward pressure has faded for now, but it doesn’t alter the broader uptrend trend established in recent months.

Price Facts, Sentiment, Narrative

image1.png

USD/JPY is up after US Fed last week hiked interest rates by 25 basis points and Chair Powell said the central bank could conduct a few more rate hikes to bring down inflation to its target.

US jobs and services data beat expectations, triggering a repricing higher in US rate expectations. In addition, reports that Bank of Japan Deputy Governor Masayoshi Amamiya could succeed incumbent Haruhiko Kuroda as central bank governor have provided some support to USD/JPY as BOJ’s ultra-easy policy is expected to continue.

USD/JPY Weekly Chart

image2.png

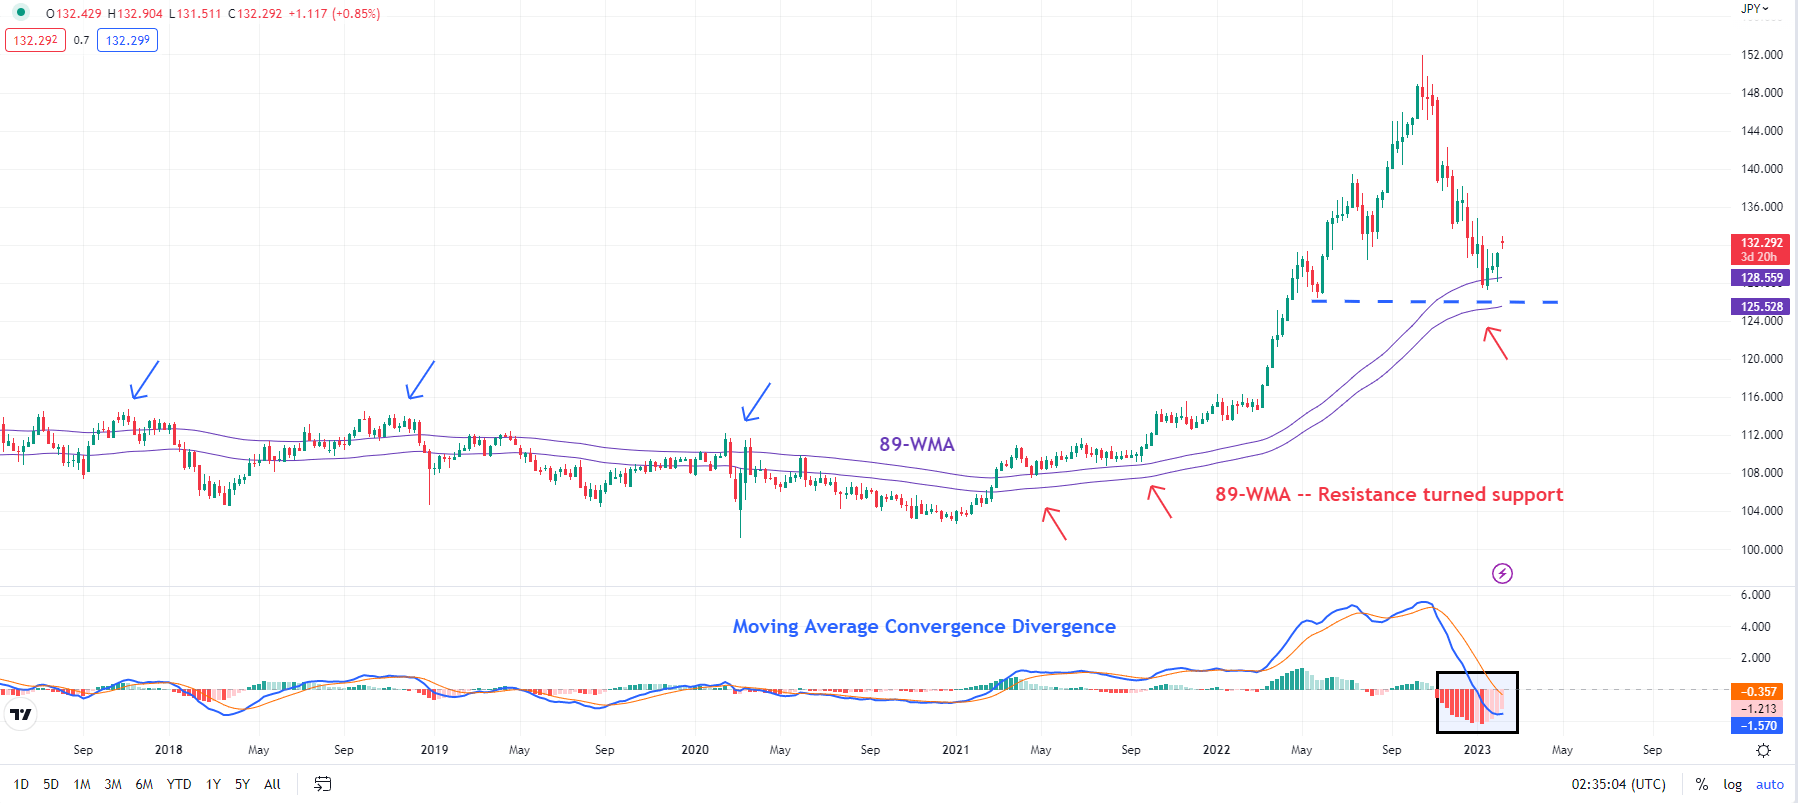
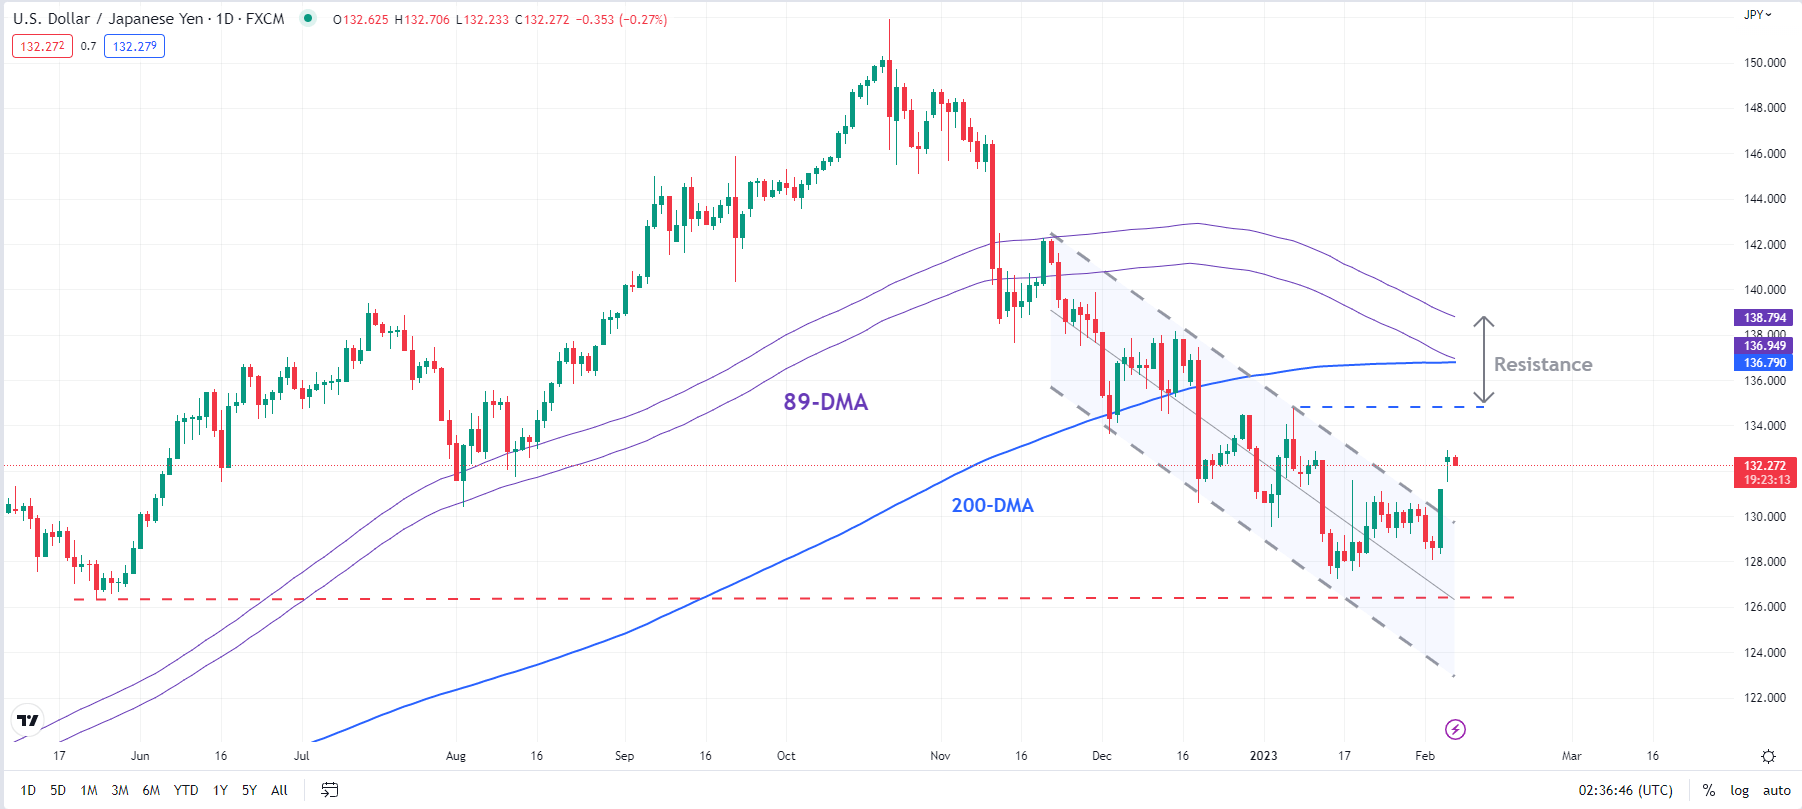
On technical charts, USD/JPY’s slide has been losing steam in recent weeks,as highlighted in the previous update. The subsequent break above the 89-period moving average on the 240-minute chart, near the upper edge of a declining channel since November, confirms that the three-month-long downward pressure has faded somewhat in the short term (see mid-January updatehighlighting the scenario).

USD/JPY Daily Chart

image3.png

However, zooming out a bit, on the daily chart, the recent bounce looks corrective. Unless USD/JPY is able to clear a stiff barrier at 134.00-137.00, including the 89-day moving average, the 200-day moving average, around the early-January high, the broader trend remains down (see the daily chart).

What the MACD Indicator is and How it Works

What the MACD Indicator is and How it Works

What is MACD?

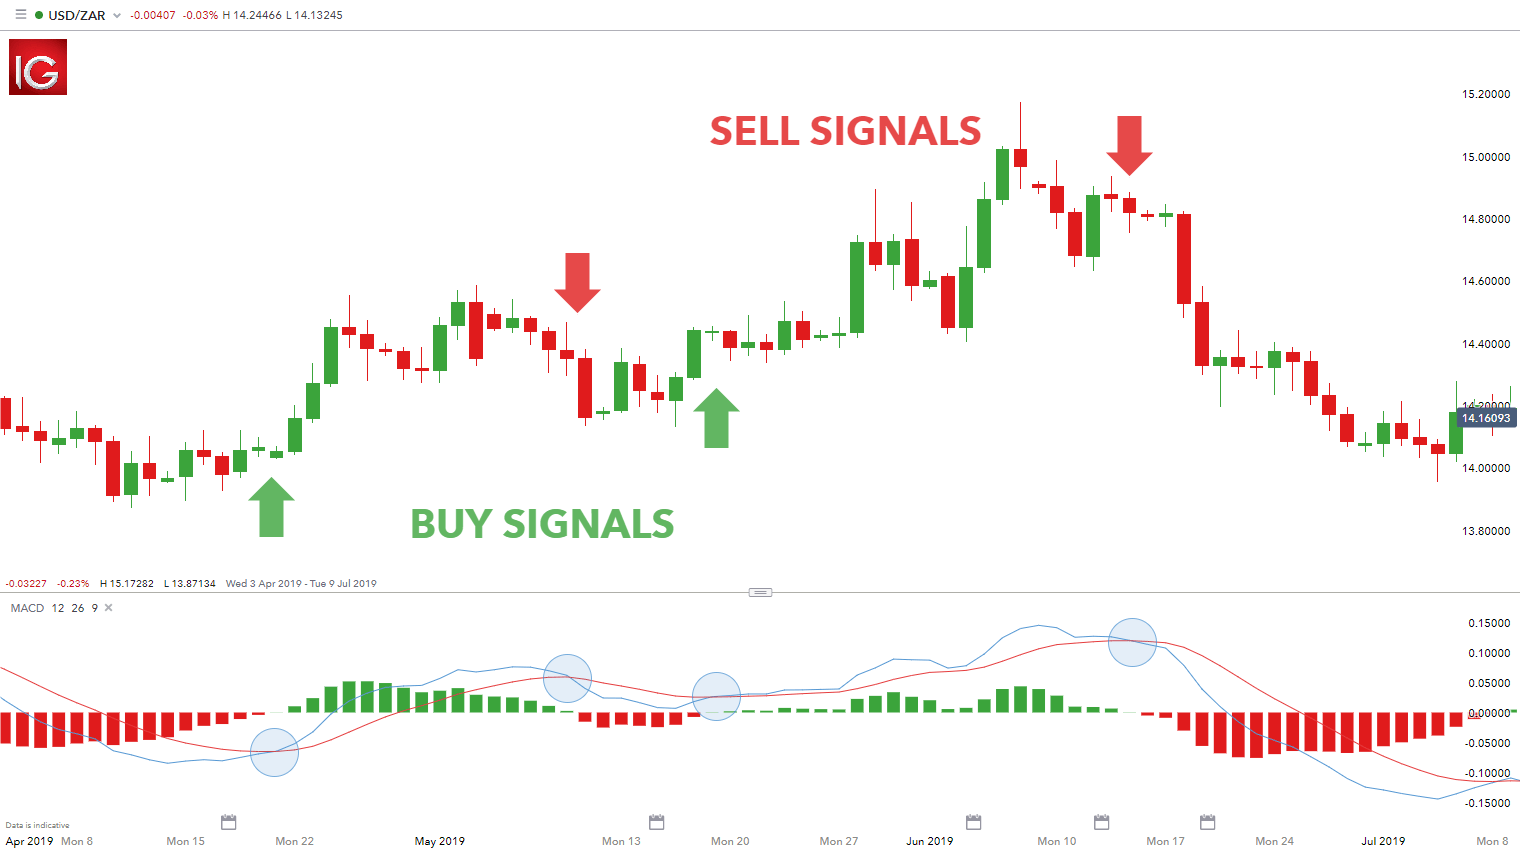
The Moving Average Convergence Divergence (MACD) is a technical indicator which simply measures the relationship of exponential moving averages (EMA).The MACD displays a MACD line (blue), signal line (red) and a histogram (green) – showing the difference between the MACD line and the signal line.

MACD indicator

The MACD line is the difference between two exponentially levelled moving averages – usually 12 and 26-periods, whilst the signal line is generally a 9-period exponentially smoothed average of the MACD line.

These MACD lines waver in and around the zero line. This gives the MACD the characteristics of an oscillator giving overbought and oversold signals above and below the zero-line respectively.

What does MACD measure?

The MACD measures momentum or trend strength by using the MACD line and zero line as reference points:

  • When the MACD line crosses ABOVE the zero line, this signals an UPTREND
  • When the MACD line crosses BELOW the zero line, this signals an DOWNTREND

In addition, the MACD signals buy or sell orders which are given when the two MACD lines cross over as outlined below:

  • When the MACD line crosses ABOVE the signal line, traders use this as a BUY indication
  • When the MACD line crosses BELOW the signal line, traders use this as a SELL indication

USD/ZAR MACD trading signals

How is MACD calculated?

Most charting platforms offer the MACD indicator, and implement this calculation using the aforementioned default periods. The formula below breaks down the varying components of the MACD to make it comfortable for traders to apply.

MACD formula calculation

As mentioned previously, the MACD histogram plots the difference between the two moving average lines. The histogram fluctuates in and around the zero designation on the MACD indicator. When the MACD line is above the signal line, then the histogram will be positive. The opposite is true when the MACD line sits below the signal, whereby the histogram will plot below the zero as a negative value. A zero value on the histogram indicates a crossing over of the two moving average lines thus marking buy/sell signals.

Limitations of MACD

The MACD indicator is considered to work best in trending markets. This limits its use for traders depending on their trading strategies. For example, range bound/consolidating markets will generally give flawed signals when using the MACD. Traders will need to truly understand the MACD as well as when to employ the indicator for optimal use. Novice traders may find this indicator difficult to use initially, which is why going through basic moving average and EMA fundamentals will benefit traders who are looking to make use of the MACD indicator.

The variations that can be implemented with the MACD indicator is almost infinite which makes it very personal to the trader. This subjective nature of the MACD will mean that results differ from trader to trader which take away any consistency. Traders will need to follow a basic outline when using the MACD:

  • Selecting EMA parameters
  • Using an appropriate time frame, as MACD may function differently across time frames

MACD Indicator: A Summary

The MACD is unique in that it serves as an oscillator as well as MACD crossover indicator. This dual purpose gives two signals in one indicator allowing for a less cluttered chart. Traders may find this useful which makes understanding the MACD worthwhile.

Become a Better Trader with Our Trading Tips

  • Learn about other oscillators and indicators to enhance your trading for both beginner and experienced traders:
  1. Relative Strength Index (RSI)
  2. Exponential Moving Average (EMA)
  3. Simple Moving Average (SMA)
  • Technical traders have different  styles  and  forex trading strategies. Explore these thoroughly to find out if this type of analysis suits your personality
  • If you are just starting out on your trading journey it is essential to understand the basics of forex trading in our new to forex guide
US Dollar Bumped by Hawkish Fed and the RBA Joins the Rate Hike Party. Higher USD?

US Dollar Bumped by Hawkish Fed and the RBA Joins the Rate Hike Party. Higher USD?

The US Dollar is treading water so far today after massive gains across the board thanks to Fed commentary for higher rates raising the prospect of a hawkish Fed Chair later today.

Yesterday, Atlanta Fed President Raphael Bostic highlighted that the tight labour market seen in Friday’s data might mean that the peak in rates could be higher than where the market is currently pricing.

Futures and swaps markets are now pricing a 2023 peak in US rates above 5.10%, up from below 4.90% last week.

The comments lifted Treasury yields across the curve with the short end seeing the largest bump. The benchmark 2-year note fell just short of 4.50% in the US session and all bond yields have eased a touch in the Asian session so far today, in line with a softening US Dollar.

Wall Street finished their day lower with the Nasdaq notching a 1% decline. APAC equities have had a quiet day with Australia’s ASX 200 slightly in the red, Japan’s Nikkei 225 fairly flat and Chinese markets scratched out small gains

The RBA hiked rates by 25 basis points today in a somewhat pastiche approach to monetary policy after the Fed’s re-acceleration toward hawkishness. The move boosted the Aussie Dollar and has been the biggest gainer against the greenback.

It is being reported that Washington is planning to slap a 200% tariff on Russian Aluminium in the next week or 2.

The Japanese Yen is firmer after solid wage data raised speculation that the Bank of Japan might reconsider its ultra-loose monetary policy stance.

Crude oil is slightly firmer with the WTI futures contract near US$ 74.75 bbl and the Brent contract is a touch above US$ 81.50 bbl. Gold is steady at around US$ 1,875 an ounce at the time of going to print.

In other news, the New York Stock Exchange (NYSE) has agreed to pay 60% of claims from the trading glitch last month.

The focus later today will be Fed Chair Jerome Powell’s speech at the Economic Council in Washington. The very strong labour market, and Bostic’s comments yesterday might have laid the groundwork for stronger hawkish rhetoric from the chief rate setter.

The full economic calendar can be viewed here.

DXY (USD) INDEX TECHNICAL ANALYSIS

The DXY Index is testing the upper band of an ascending trend channel today after it recovered from a seven-month low seen last week.

The 55-day simple moving average (SMA) is just above the trend line and may offer resistance.

Further resistance could be at the prior peaks of 105.63, 105.82, 107.20 and 107.99.

On the downside, support may lie at the breakpoint of 101.30 or down at the previous lows of 100.82, 9957 and 99.42.


US Stocks Battered in the Aftermath of NFP’s – S&P 500, Nasdaq Sink

US Stocks Battered in the Aftermath of NFP’s – S&P 500, Nasdaq Sink

S&P 500, Nasdaq 100 Disheartened by Rate Expectations & USD Strength

US stock indices have continued to trade lower after Friday’s NFP (non-farm payroll) report sent shivers through the equity market. As the unemployment rate fell to 3.4% (down from 3.5%), an additional 517k jobs were added to the US economy last month (far above the estimated 187k).

Graphical user interface, text, application, email  Description automatically generated

Although the data reflects a resilient economy, it also presents the opportunity for the Federal Reserve to continue to hike interest rates more aggressively.

This places pressure of stocks which have a negative correlation (move in the opposite direction) to rate expectations which favors higher yielding assets.

S&P 500 Technical Analysis

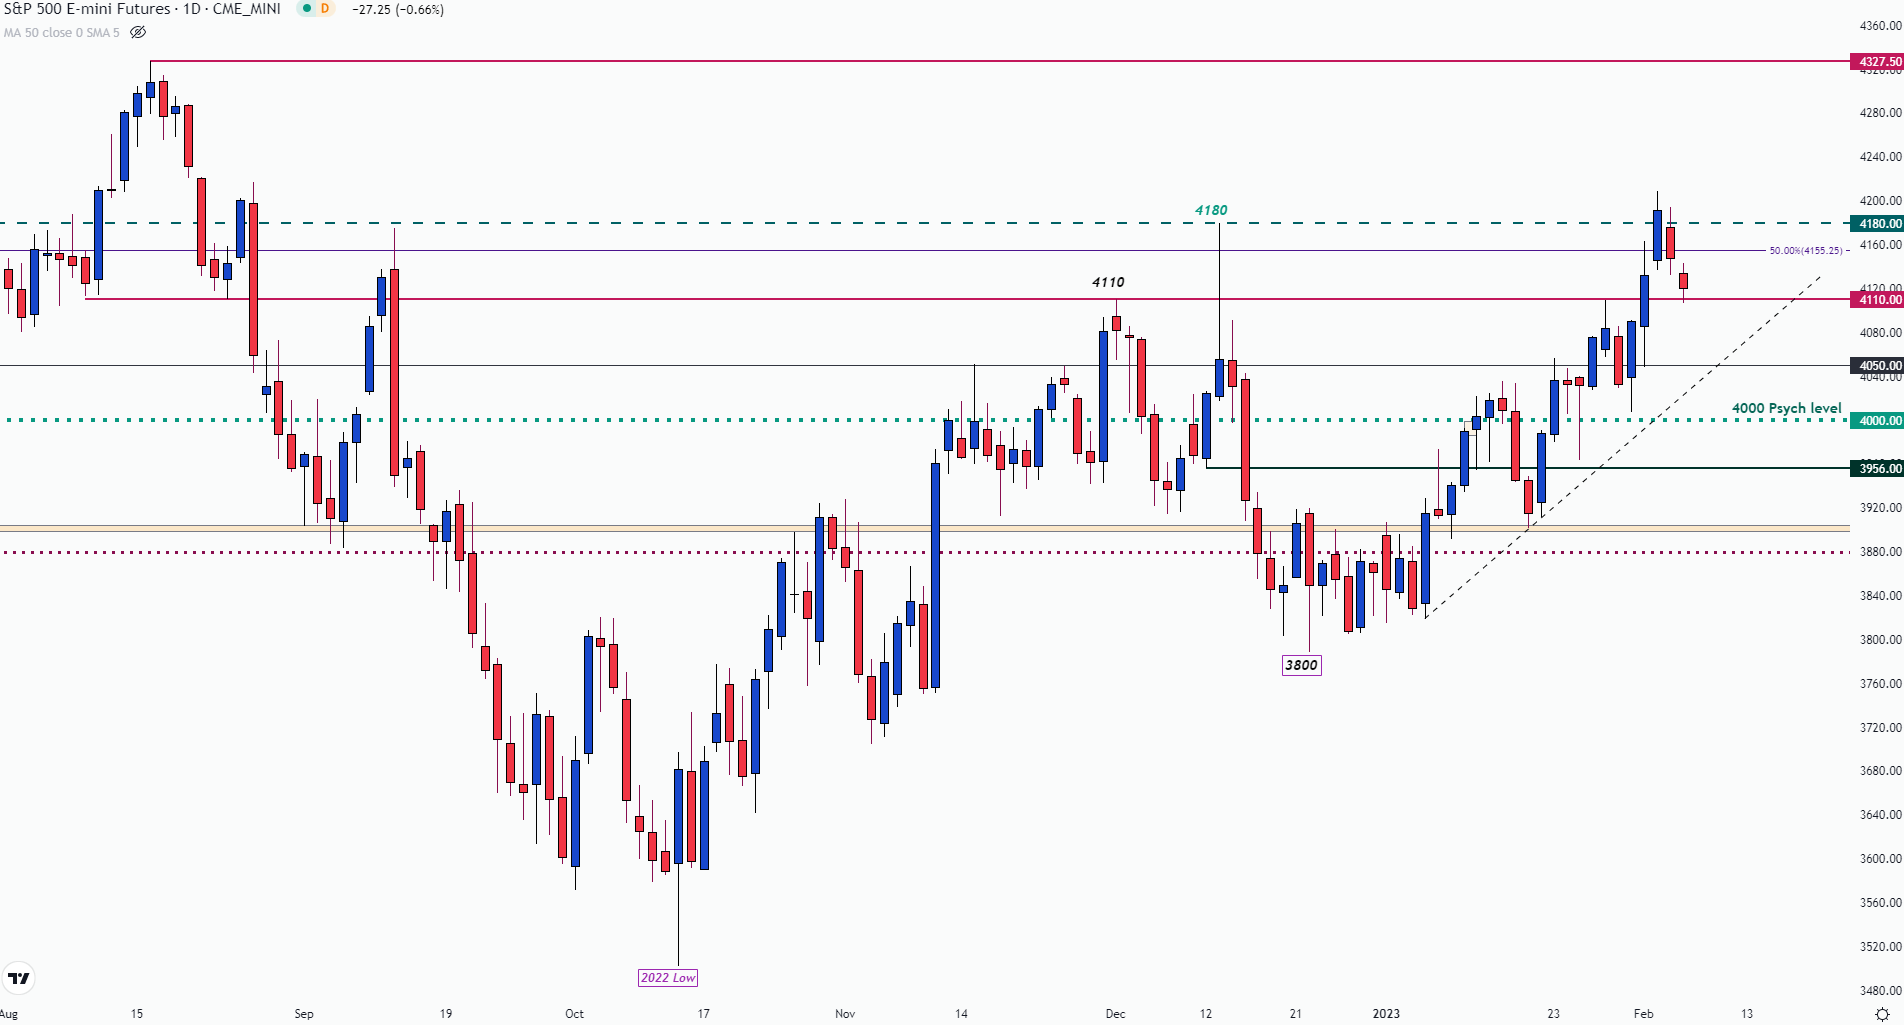
While a softer 0.25% rate hike at last week’s FOMC helped drive S&P futures to a high of 4208.5, the resurgence of USD strength has pushed prices back towards prior resistance at 4110. From the daily chart below, the same level capped the upside move at the beginning of December and held the upper wick of the candlestick on 27 Jan.

S&P (US 500) Futures Daily Chart

A picture containing text, indoor, screenshot  Description automatically generated

With support at prior resistance, a move lower could open the door for the next zone of psychological support at 4000. Meanwhile, the midpoint of the 2022 move has stepped in as immediate resistance around 4155. If bulls break through this barrier, the December 13 high holds at 4180 with a move higher bringing 4200 back into play.

Nasdaq 100 Technical Analysis

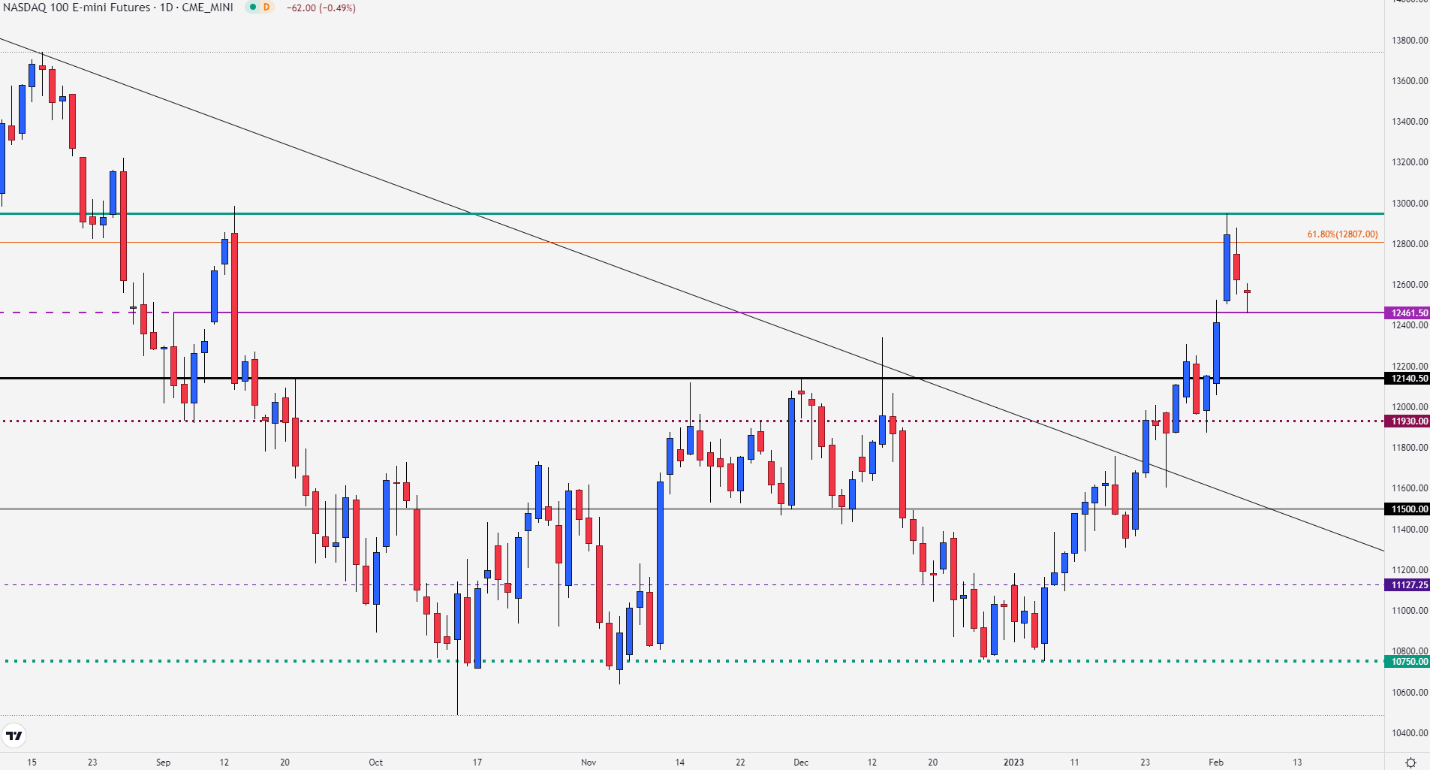
For Nasdaq 100 futures, failure to gain traction above 12950 allowed bears to pressure the uptrend, forcing prices below 12500. With the 12950-handle limiting prior historical moves (last year June and September), this could prove to be a difficult hurdle for bulls.

Nasdaq 100 (US Tech) Daily Chart

Chart, histogram  Description automatically generated


EUR/USD IG Client Sentiment: Our data shows traders are now net-long EUR/USD for the first time since Jan 06, 2023 when EUR/USD traded near 1.06.

EUR/USD IG Client Sentiment: Our data shows traders are now net-long EUR/USD for the first time since Jan 06, 2023 when EUR/USD traded near 1.06.

EUR/USD Client Positioning

Number of traders net-short has decreased by 25.77% from last week.

SYMBOL TRADING BIAS NET-LONG% NET-SHORT% CHANGE IN LONGS CHANGE IN SHORTS CHANGE IN OI
EUR/USD BEARISH 50.00% 50.00% 9.54% Daily

16.69% Weekly

3.71% Daily

-25.77% Weekly

6.54% Daily

-9.26% Weekly

EUR/USD: Retail trader data shows 50.00% of traders are net-long with the ratio of traders long to short at 1.00 to 1. In fact, traders have remained net-long since Jan 06 when EUR/USD traded near 1.06, price has moved 1.40% higher since then. The number of traders net-long is 9.54% higher than yesterday and 16.69% higher from last week, while the number of traders net-short is 3.71% higher than yesterday and 25.77% lower from last week.

We typically take a contrarian view to crowd sentiment, and the fact traders are net-long suggests EUR/USD prices may continue to fall.

Our data shows traders are now net-long EUR/USD for the first time since Jan 06, 2023 when EUR/USD traded near 1.06. Traders are further net-long than yesterday and last week, and the combination of current sentiment and recent changes gives us a stronger EUR/USD-bearish contrarian trading bias.