British Pound Outlook: GBP/USD Yields to US Dollar Strength, Where to Next?

British Pound Outlook: GBP/USD Yields to US Dollar Strength, Where to Next?

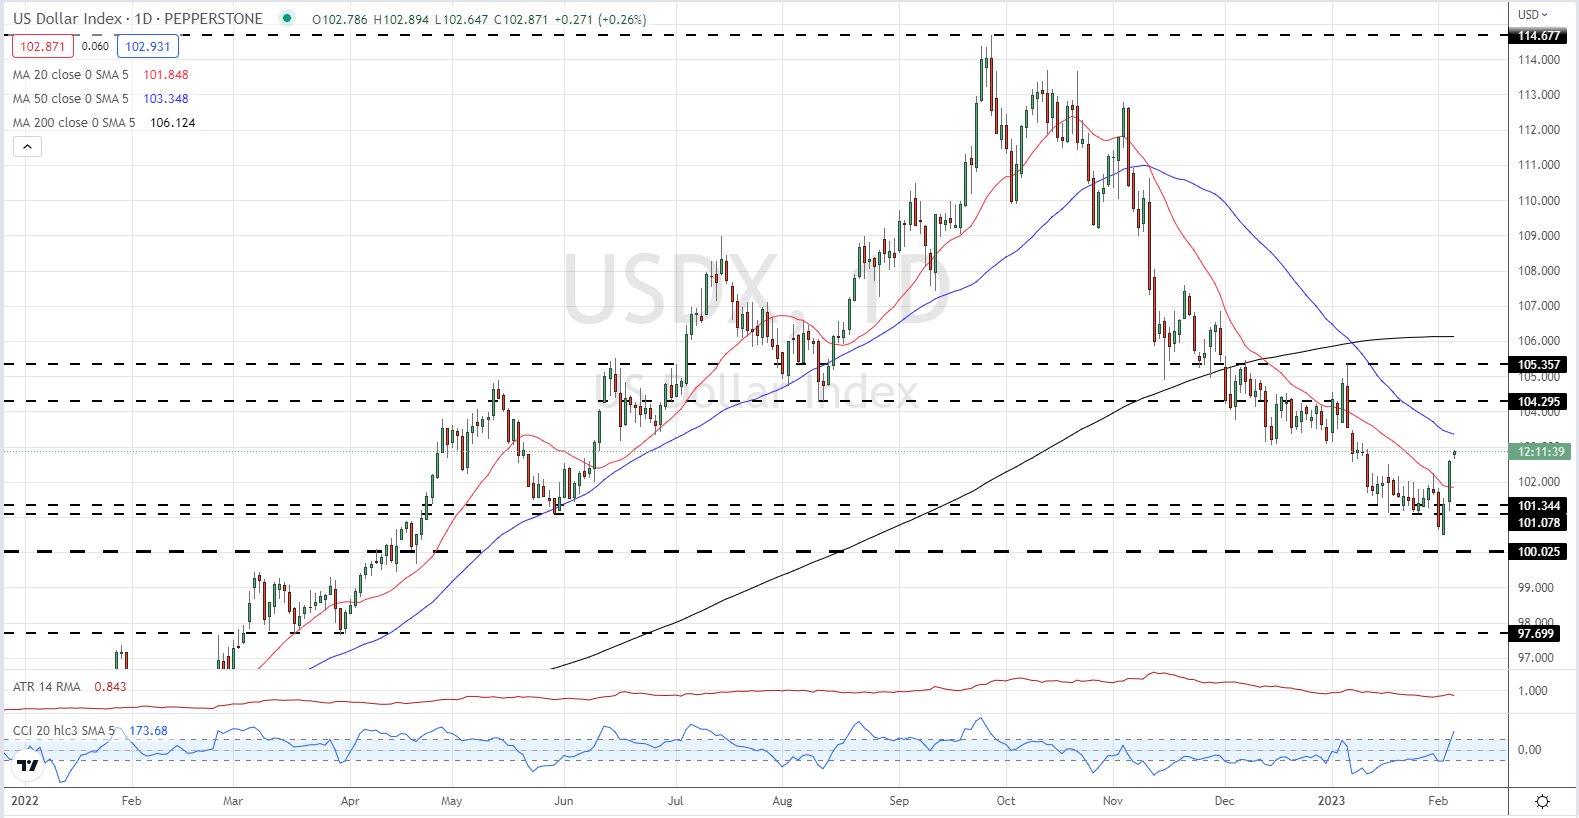
The US dollar is pushing further ahead in early European turnover, buoyed by Friday’s blowout NFP report and US ISM data. The super-sized US Jobs Report – NFPs at 517k, unemployment rate at 3.4% – stunned the market with the magnitude of jobs created despite the beat being influenced by yearly population changes. The ISM non-manufacturing PMI released later on Friday also beat expectations by a wide margin – 55.2 vs 50.4 exp. and 49.2 prior – giving the greenback a further boost. The dollar is now trading at its highest level since mid-January, although the CCI indicator is showing that the greenback is in overbought territory.

US Dollar Index (DXY) – February 6, 2023

image1.png

There is little cheer for the British Pound of late. Economic data has not been strong enough to underpin Sterling against its rivals, while ongoing strikes, and the threat of more in the coming weeks, are hitting sentiment.

On Friday, the Office for National Statistics (ONS) will release Q4 GDP preliminary data. UK growth is seen stalling in Q4 of last year and may have gone into reverse, powering further recessionary fears. The recent International Monetary Fund (IMF) update suggested that the UK economy will contract by 0.6% this year, nearly one full percentage point below their earlier estimate.

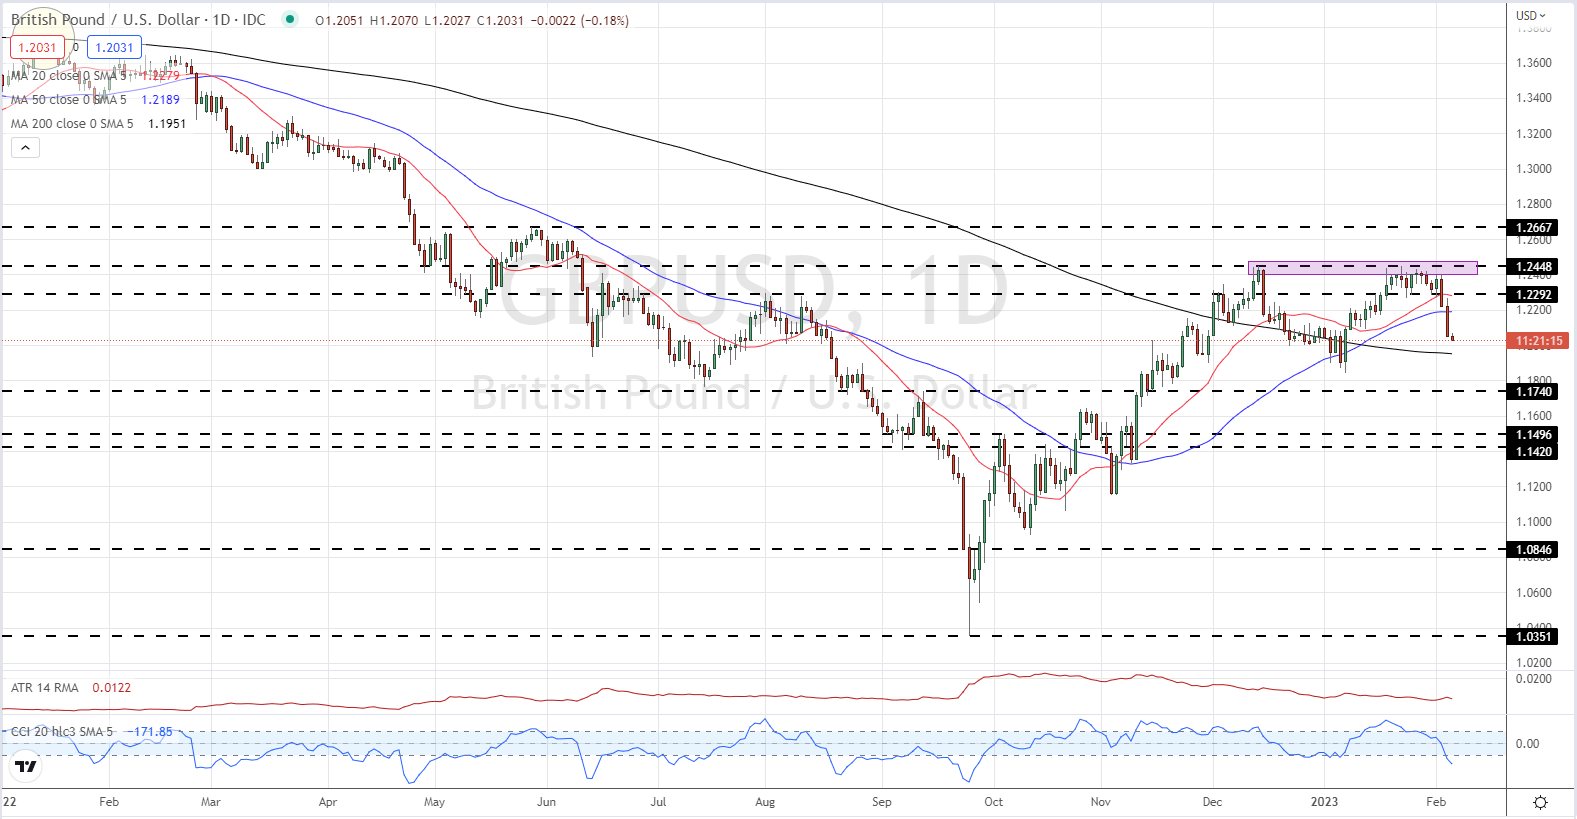
Cable is trying to cling on to the 1.2000 handle today after giving up around four big figures since Thursday’s 1.2402 high print. Recent support around 1.2290 was unable to stem the sell-off and the next level of technical support is seen around 1.1950 from the 200-day moving average. The market does look oversold using the CCI indicator in the short term at least.

GBP/USD Daily Price Chart – February 6, 2023

image2.png


US Dollar Technical Forecast: USD Prints Hammer Candle Following Blockbuster NFP Report

US Dollar Technical Forecast: USD Prints Hammer Candle Following Blockbuster NFP Report

US DOLLAR OUTLOOK

The US Dollar has had an interesting week with the FOMC meeting and host of key data events potentially setting the tone for the rest of the quarter. The FOMC meeting saw a 25bps hike which was followed by dovish comments from Fed Chair Jerome Powell whose use of the word ‘disinflation’ sent the dollar tumbling and risk assets higher.

Friday however brought the NFP report, unemployment rate and of course the average hourly wage growth. The NFP report smashed estimates with a print of 517000 new jobs added, the highest since August 2022. The unemployment rate also came in better than expected falling to 3.4%, a low last seen in 1969. The only silver lining being that average hourly wage growth remained at 0.3% MoM, however with the tightness persisting in the labor market wage growth could soon face renewed pressure. Fed Chair Powell in his press conference mentioned that the resilience of the labor market is encouraging but cautioned that some weakening would be necessary for the Fed to achieve their inflation target of 2%. Friday’s data has seen the probability of a further 25bps hike in March rise to 97% up from 82% before the release of the NFP report with the dollar index finding some much-needed support.

Graphical user interface, table  Description automatically generated

TECHNICAL OUTLOOK

US Dollar Index (DXY) Weekly Chart

Chart  Description automatically generated

From a technical perspective, the weekly chart for the dollar index (DXY) is on course to print a hammer weekly candle close which hints at further upside in the week ahead. The previous two weeks closed as a doji candlestick which did provide a sign that a reversal may be incoming, however following the FOMC meeting the dollar index broke below the 101.00 level and appeared vulnerable. A push higher on the weekly faces’ resistance around the 103.50 with a break bringing the 100-day MA at 105.00 into play.

US Dollar Index Daily Chart

Chart  Description automatically generated

The daily timeframe finally saw a breakout of the 13-day trading range before closing back inside the range on Thursday. False breakout? Looks like it is following Friday’s NFP, which resulted in a test of the top of the range around 103 and looking likely to close above 50-day MA. Should we get a daily candle close above the 50-day MA the 100-day MA line up with the resistance level mentioned above, around the 103.50 level.


Given the data on Friday as well as the price action a break back below the range seems unlikely. However, should we get a candle close back below the range we could be in for a push below the 100.00 mark which we haven’t seen since April 2022.

USD/CAD TECHNICAL OUTLOOK

USD/CAD Daily Chart

image4.png

Australian Dollar Outlook: US Dollar Dominates Ahead of RBA

Australian Dollar Outlook: US Dollar Dominates Ahead of RBA

The Australian Dollar roared to a 10-month high last week as the US Dollar collapsed on hopes that the Federal Reserve might be stepping back from their hawkish stance. The focus now turns to the RBA meeting this Tuesday.

The Federal Open Market Committee (FOMC) lifted rates by 25 basis points (bp), but it was in the post-meeting press conference where the fireworks kicked off.

Fed Chair Jerome Powell mostly stuck to the script, but markets gushed when he said, “We can now say I think for the first time that the disinflationary process has started.”

This created a buying frenzy of equities and bonds and the broad-based selling of US Dollars, pushing AUD/USD to its peak of 0.7158.

Treasury yields collapsed, dragging global government bond yields down with them. Australian Commonwealth Government Bonds (ACGB) yields fell further with the 10-year bond spread returning to around parity.

The contraction in the spread occurred at the same time that AUD/USD dropped.

Australian CPI is running hot at 7.8% year-on-year, but the RBA has previously appeared non-plussed about the massive overshoot from their 2-3% mandated target band. At their last meeting, they stated that they expect it to climb above 8% later this year before easing in 2022.

The domestic economy is on fire. Building approvals for December were up 18% compared to the month prior. The trade surplus keeps washing in billions of dollars each month and the unemployment rate remains near multi-generational lows at 3.5%.

The December trade balance will be released just prior to the RBA meeting on Tuesday and a Bloomberg survey of economists is anticipating an AUD 12.4 billion surplus.

If China transitions out of Covid-19 restrictions smoothly, it’s reasonable to anticipate further stimulus arriving via international trade.

December retail sales is the only blight on the economic scorecard, but this has been mostly attributed to consumers pre-buying ahead of Christmas in November.

So, with the national finances in such great shape, why is the RBA not slamming on the brakes and reining in inflation?

A lot may have to do with the so-called ‘mortgage cliff’. A significant amount of fixed-rate loans that were taken out when the cash rate was 300 bp lower are due to roll off this year.

A degree of controversy surrounds the RBA due to media misreporting Governor Philip Lowe’s comments about how long rates will be kept at the pandemic emergency low setting.

Whatever the reasoning for the RBA not being more aggressive in their inflation fight, they have made it clear that they are in somewhat of a wait-and-see mode for now. A 25 bp lift in rates is widely anticipated this week.

With China re-opening, a blistering domestic economy and if the US Dollar keeps sailing south, the Aussie might be moving north.

AUD/USD AGAINST AU-US GOVERNMENT BOND SPREAD


image1.png

How to Trade After a News Release

How to Trade After a News Release

Post-release trading strategies

1. Trend following strategy

This strategy involves the use of multiple time frames, as well as, well-defined levels of support and resistance that come into play after a news release.

Traders can adopt this strategy when the current market price is approaching a well-defined level of support or resistance but isn’t quite there yet. The volatility after the news release has the potential to push the market toward the trendline. If price respects the trendline, traders can look to trade in the direction of the trend and trade the potential bounce.

The following 4 points are of assistance for this type of trade:

  1. Determine trend direction on a daily chart
  2. Draw support and resistance lines
  3. Select a forex time frame anywhere from 1 – 4 hours
  4. Buy near support in uptrend and sell near resistance in downtrend

Keep in mind that news releases have the potential to break through longstanding levels of support and resistance which underscores the importance of using tight stops when pursuing this strategy.

Post-release trend following strategy

2. Dual spike breakout strategyThis strategy involves waiting for market volatility to reveal a range before trading a break of that range and makes use of a five-minute chart. For illustrative purposes this section incorporates the US Non-Farm Payroll (NFP) release as this often has the greatest potential to move the market.

After the NFP release, wait 15-minutes for three five-minute candles to close. Take note of the highest price and the lowest price of the three closed candles. Next, place an entry order to go long at the highest price and an entry to go short at the lowest price. Once an order is triggered, targets can be set at twice the distance of the high/low channel while stops can be set above resistance for short trades and below support for long trades.

The disadvantage of this strategy is that volatility can push price above or below the short-term range, triggering an entry order, and then immediately reversing to hit a stop loss.

This strategy can be applied in the following way:

  1. Customize the chart settings to show 5- minute charts
  2. Take note of the highs and lows of the first three candles
  3. Set entry orders when price breaks above or below the range
  4. Set stops and limits
  5. Delete the unfilled order

Dual spike forex news trading strategy

<alt image desc> Dual spike forex news trading strategy

3. News Reversal Strategy

The market can trade in one direction immediately after a major news release only to reverse and trade in the opposite direction.

The news reversal strategy looks to trade the news after the release and focuses on a sudden, sustained reversal in direction after a strong initial move in price.

The reversal could be the result of algorithms or, the market as a whole, feeling that there was an overreaction in price – prompting trades in the opposite direction.

The downside of this strategy is that no reversal takes place and the price continues trading in the direction on the initial spike.

How to implement the news reversal strategy:

  1. Initial spike in price: News with great market moving potential generally lead to a spike in price as the news is released.
  2. Look out for a reversal: Traders can wait 10-15 minutes for the reversal to bring price back to where it was before the release.
  3. Entry: Enter as price breaks above/below pre-release levels.
  4. Set multiple target levels: Traders should consider setting multiple target levels. As one is triggered, traders can take profit on half of the position and adjusting the stop on the remaining position to breakeven.

News reversal trading strategy

Trading forex after the release: Conclusion

Trading the news after the release can be a more conservative way to approach news trading. This is due to the emotions from the news release subsiding allowing a trader time to plan a technical set up for their trade. Regardless of your trading approach to news trading, risk management and utilizing small amounts or no leverage is critical to maintaining capital in your account to make the next trade.

US Dollar Technical Forecast: USD Prints Hammer Candle Following Blockbuster NFP Report

US Dollar Technical Forecast: USD Prints Hammer Candle Following Blockbuster NFP Report

US DOLLAR OUTLOOK

The US Dollar has had an interesting week with the FOMC meeting and host of key data events potentially setting the tone for the rest of the quarter. The FOMC meeting saw a 25bps hike which was followed by dovish comments from Fed Chair Jerome Powell whose use of the word ‘disinflation’ sent the dollar tumbling and risk assets higher.

Friday however brought the NFP report, unemployment rate and of course the average hourly wage growth. The NFP report smashed estimates with a print of 517000 new jobs added, the highest since August 2022. The unemployment rate also came in better than expected falling to 3.4%, a low last seen in 1969. The only silver lining being that average hourly wage growth remained at 0.3% MoM, however with the tightness persisting in the labor market wage growth could soon face renewed pressure. Fed Chair Powell in his press conference mentioned that the resilience of the labor market is encouraging but cautioned that some weakening would be necessary for the Fed to achieve their inflation target of 2%. Friday’s data has seen the probability of a further 25bps hike in March rise to 97% up from 82% before the release of the NFP report with the dollar index finding some much-needed support.

Graphical user interface, table  Description automatically generated

TECHNICAL OUTLOOK

Chart  Description automatically generated

Source: TradingView, prepared by Zain Vawda

From a technical perspective, the weekly chart for the dollar index (DXY) is on course to print a hammer weekly candle close which hints at further upside in the week ahead. The previous two weeks closed as a doji candlestick which did provide a sign that a reversal may be incoming, however following the FOMC meeting the dollar index broke below the 101.00 level and appeared vulnerable. A push higher on the weekly faces’ resistance around the 103.50 with a break bringing the 100-day MA at 105.00 into play.

US Dollar Index Daily Chart

Chart  Description automatically generated

The daily timeframe finally saw a breakout of the 13-day trading range before closing back inside the range on Thursday. False breakout? Looks like it is following Friday’s NFP, which resulted in a test of the top of the range around 103 and looking likely to close above 50-day MA. Should we get a daily candle close above the 50-day MA the 100-day MA line up with the resistance level mentioned above, around the 103.50 level.

 Given the data on Friday as well as the price action a break back below the range seems unlikely. However, should we get a candle close back below the range we could be in for a push below the 100.00 mark which we haven’t seen since April 2022.

USD/CAD TECHNICAL OUTLOOK

USD/CAD Daily Chart

image4.pngSource: TradingView, prepared by Zain Vawda

USD/CAD has found support at the November 2022 swing low just above the 200-day MA. A daily candle close outside the falling wedge pattern and the horizontal resistance at 1.3390 should lead to further upside in the week ahead. Resistance may be provided by the 50-day MA which lines up with horizontal resistance around the psychological 1.3500 level with the 100-day MA resting slightly higher.

Given the recent announcement by the Bank of Canada (BoC) of their intention to pause interest rate hikes the fundamentals seem to support further upside for the pair.

RESOURCES FOR TRADERS

Whether you are a new or experienced trader, we have several resources available to help you; indicators for tracking trader sentiment, quarterly trading forecasts, analytical and educational webinars held daily, trading guides to help you improve trading performance, and one specifically for those who are new to forex.

EURUSD Gains As Eurozone Data Show Modest Return To Growth

EURUSD Gains As Eurozone Data Show Modest Return To Growth

The Euro managed modest gains against the US Dollar on Friday, helped in part by news that the Eurozone economy managed some growth last month.

The S&P Global’s Composite Purchasing Managers Index for the currency bloc climbed to a seven-month high of 50.3 in January. That was above both December’s 49.3 and a preliminary reading of 50.2. The figure was also above the key 50 mark which separates expansion from contraction for the first time in seven months.

These figures came after better official figures from Eurostat earlier in the week. They showed that the Eurozone economy expanded by 0.1% in the final quarter of 2022, outperforming expectations for a 0.1% drop.

Objectively these are not exactly stellar numbers, but they do at least raise some hope that outright recession can be avoided across the currency area.

The European Central Bank raised interest rates by a half-percentage-point on Thursday but the single currency slipped in the wake of that decision. Even though the ECB flagged the probability of another, similar increase next month, the meeting and its aftermath were well within market expectations. It takes a major hawkish surprise to support a currency much these days and there was no such thing on offer.

That said EUR/USD remains well supported by interest-rate prospects. It has risen consistently since September last year and is now back at highs not seen since April.

The rest of the day’s momentum is likely to come from the USD side of the pair, with heavyweight economic numbers due Stateside, including the monthly employment report.

EUR/USD Technical Analysis

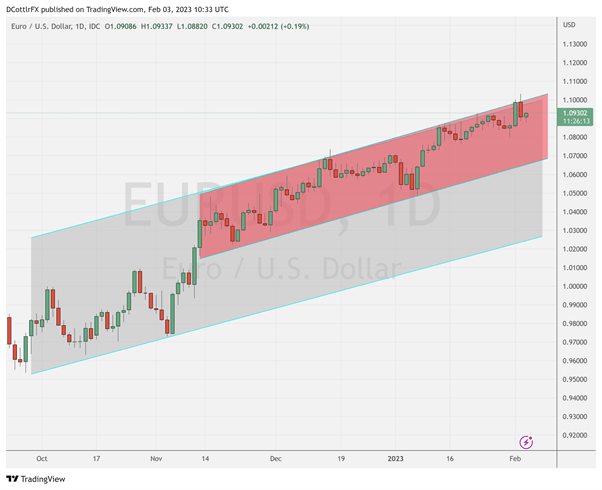
The broad uptrend channel from September 2022 is facing a clear and sustained upside test, with the market having broken above it intraday on both Wednesday and Thursday of this week.

Bullish momentum has been sustained pretty consistently, to the point where the broad channel’s lower bound looks too far below the market to be relevant at this time. Indeed it hasn’t faced any sort of a test since November 3, when the bounce higher was extremely strong.

A narrower channel can be clearly seen, however, its downside was tested much more recently, on January 6. It now provides probable support at 1.0561 should Euro bulls lose the will to keep trying the channel top. If they don’t, important resistance will probably come in at 1.11556, the last significant high above current levels. That was made on march 29.

Sentiment data from IG suggest that there is some debate as to whether the market is in any shape to push on much further from here. 58% of trades are bearish and, while that need not indicate any sustained fall for EUR/USD, it may well mean that the current uptrend isn’t going to see a decisive break higher yet. The week’s close may be very instructive.

WTI Oil Update: Delicately Poised Ahead of NFP Release

WTI Oil Update: Delicately Poised Ahead of NFP Release

WTI FUNDAMENTAL OUTLOOK

Crude Oil has had a difficult week despite broad-based US Dollar weakness for the majority of the week. WTI hit a fresh three-week low yesterday and remains on course for a second week of losses as sanctions on Russian oil products loom.

There have been a host of factors that could be attributed to the decline in oil prices this week. Oil inventories in the US rose to their highest level since June 2021 with the Energy Information Administration also showing an increase in inventories of oil-based products. EIA oil stocks change for the week ended January 28 rose by 4.14M versus 0.376M expected.

As China’s reopening continues the optimism around demand has yet to come to fruition while inventories continue to grow. Data out of China this week was mixed with the NBS Manufacturing PMI coming in above the 50 mark while the Caixin Manufacturing PMI missed estimates coming in at 49.2, remaining in contractionary territory. Overnight we did have some more positive data however, as Caixin composite PMI came in at 51.1 up from 48.3. Looking ahead we still need to see a continuous improvement in Chinese data and actual demand improve which may offer renewed support for oil prices.

image1.png


image2.png


image3.png

For all market-moving economic releases and events, see the DailyFX Calendar

The OPEC+ meeting this week saw the JMMC recommend that production remain steady with Chinese demand yet to materialize. Members of the group agree that keeping the current agreement in place until the end of 2023 should keep markets stable. The current OPEC+ President Gabriel Mbaga Lima said the group had to be careful on any decision while Secretary General Haitham Al-Ghais remains cautiously optimistic in regard to the global economic recovery.

The FOMC meeting this week saw a weaker dollar as the Fed signaled progress with Fed chair Powell using the word ‘disinflation’ which seemed to give risk assets a boost. The positivity in sentiment toward risk assets has likely contributed to the decline in oil prices as market participants flock back into equities, with many stocks and indices trading at discount levels following 2022’s rout.

Later today we have a batch of high impact data out of the US with the NFP release likely to have an impact with average hourly earnings also key as a contributing factor toward the inflation fight.

Graphical user interface, text, application, email  Description automatically generated

TECHNICAL OUTLOOK

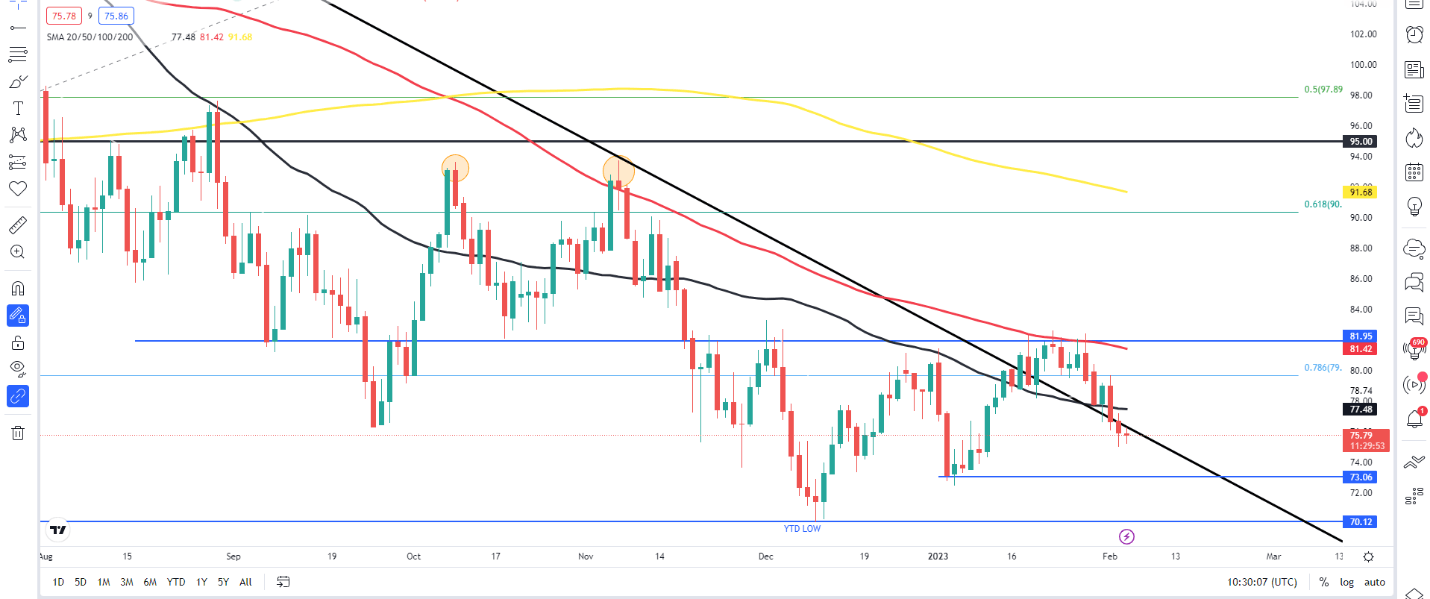
From a technical perspective, WTI is on course for a second week of losses. The daily timeframe has seen price action shift bearish following a daily candle close below the previous lower swing high around the $79 a barrel mark. We have found some support since with price currently sitting above the $75 a barrel handle. Key support area rests around the $73 mark with a close below potentially opening up a retest of the 2022 low around the $70 handle.

Alternatively, a run up for WTI faces resistance in the form of the 50-day MA resting at $77.50 and above that the 100-day MA around the $81.45 handle.

WTI Crude Oil Daily Chart – February 3, 2022

Chart, histogram  Description automatically generated


Brexit Trade Blow Is Happening Sooner Than Feared, BOE Warns

Brexit Trade Blow Is Happening Sooner Than Feared, BOE Warns

The economic damage done by Brexit is happening sooner than feared, the Bank of England warned.

The central bank said the UK economy is being hindered by a sharper slump in trade with the European Union than implied by official statistics and “very subdued” business investment.

A quicker Brexit blow was part of a dismal picture the BOE presented Thursday on the economy’s growth prospects over the coming years.

Analysis by Bank staff found that goods trade has been weaker than official figures have suggested once it is adjusted to account for data issues, such as delayed customs declarations.

Since the UK’s new trading relationship with the EU began in January 2021, official data shows a 7% fall in trade. But the BOE’s adjusted figure points to a 14% slump.

“We have not changed our estimate of the long-run effects but we have brought some of them forward,” said Ben Broadbent, deputy governor at the BOE. “We think probably they are coming in faster than we first expected, even if the long-run effect is no different.”

Brexit has “pulled down potential output in our country,” Broadbent added.

The BOE also sees little prospect of a turnaround in the subdued levels of business investment since Brexit, predicting declines of almost 6% both this year and next.

Nasdaq 100 Futures Drop After Apple Earnings Miss, Amazon and Google Mixed

Nasdaq 100 Futures Drop After Apple Earnings Miss, Amazon and Google Mixed

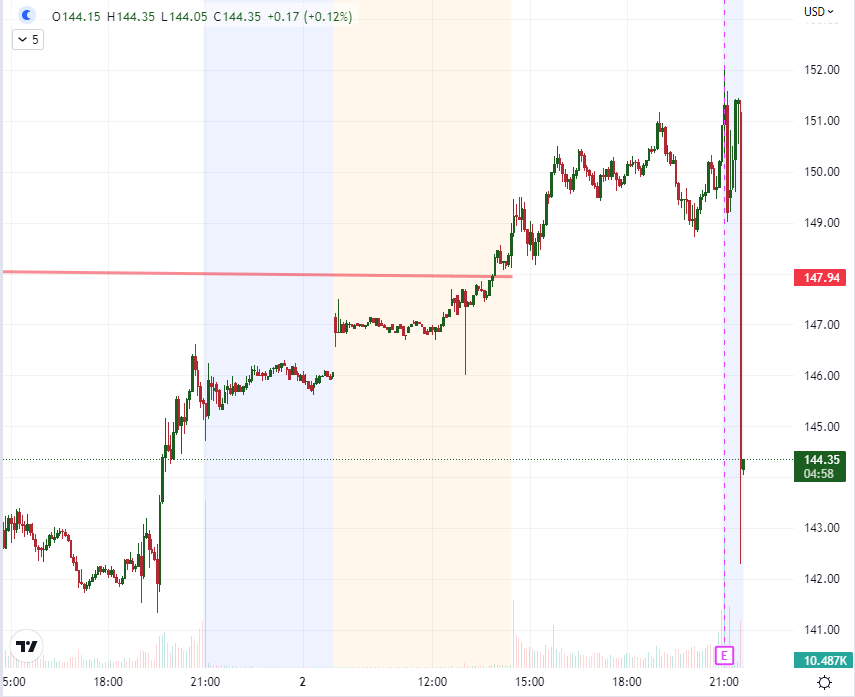
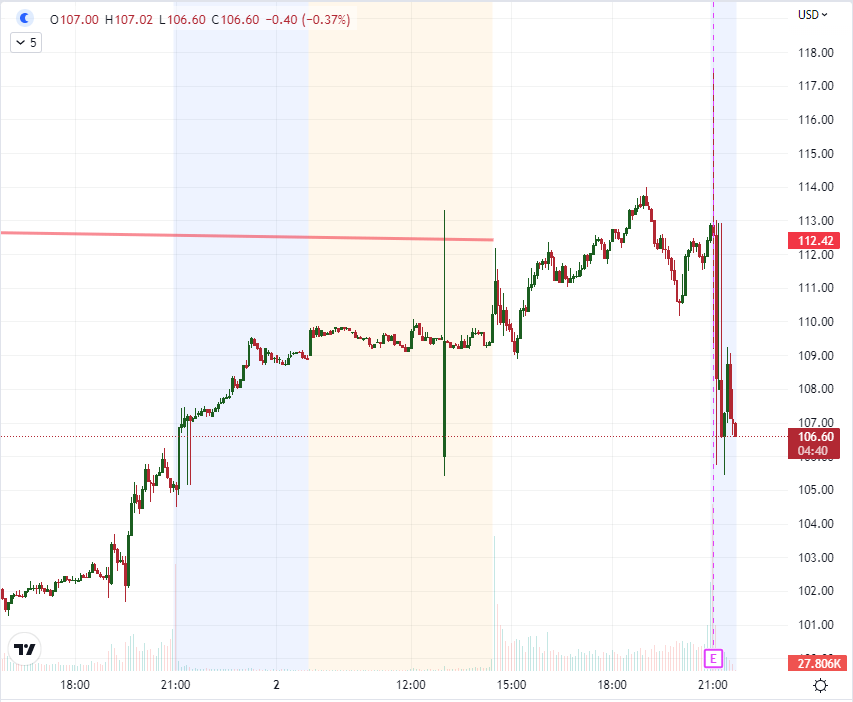
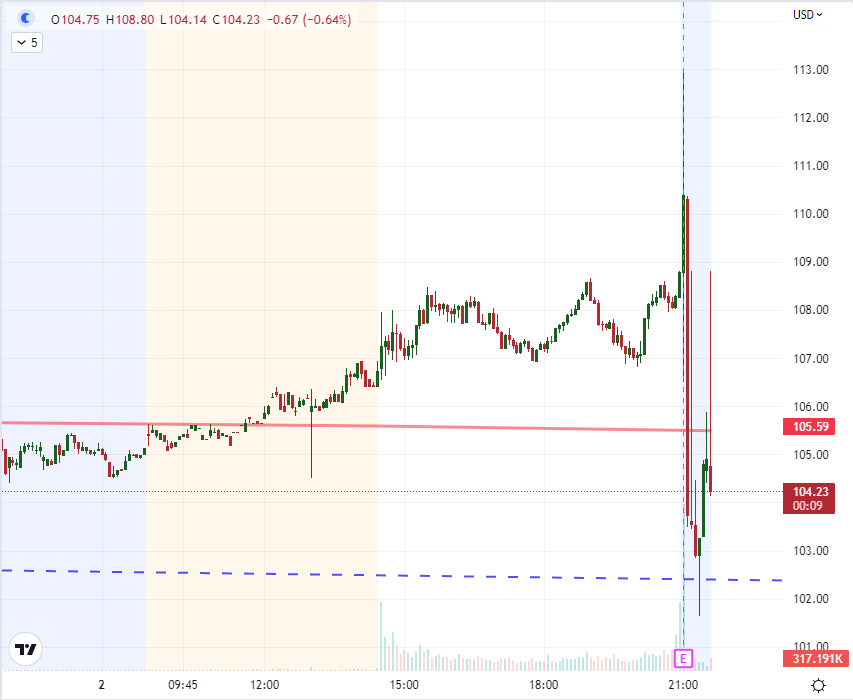
The bulk of the US tech-sectors’ earnings were released after the New York close Thursday. Following the disappointment of Netflix earnings on January 19th and the mixed performance from Meta the previous day, we would navigate into the stalwarts of the so-called FAANG group. Apple’s market cap is $2.26 trillion and represents 11.8 percent of the Nasdaq 100’s weighting. Amazon is $1.04 trillion and is 6.7 percent. Google (Alphabet) is $602 billion and 3.9 percent. Naturally, given the weight of these big players, their corporate performance carries significant weight in the consistency of the bull trend that we have seen take traction these past weeks. Now, with their mixed performance in earnings, questions over the fundamental currents carrying this enthusiasm may gain traction.

image1.png

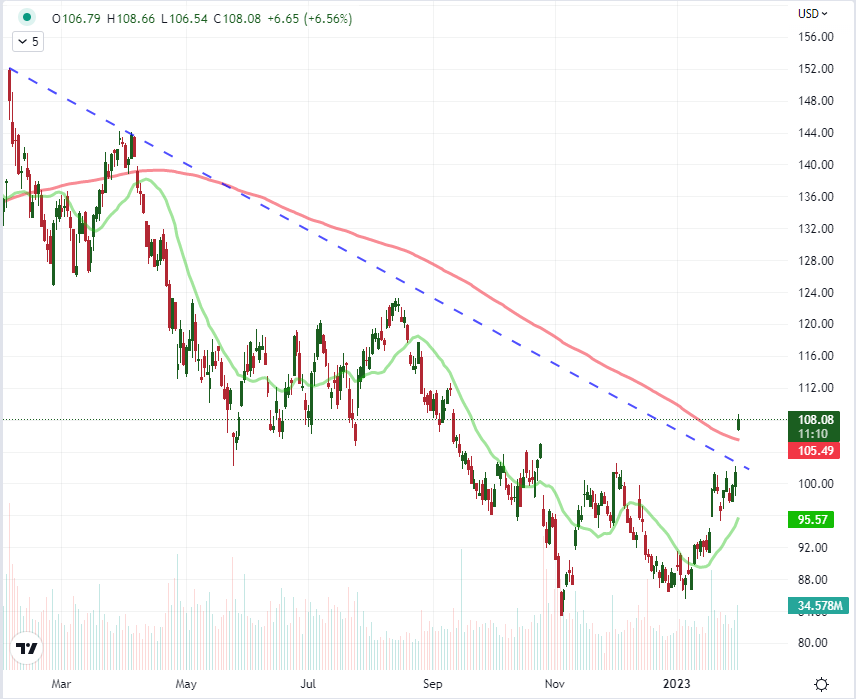
Something remarkable heading into the Thursday afternoon run of earnings releases was the strong bullish performance from Amazon, Google and Apple. The swell seems to have originated from a combination of the aftermath of the FOMC rate decision the previous day that spurred on ‘risk appetite’ as well as a sympathetic move to the Meta (formerly Facebook). The social media company missed on EPS ($1.75 vs $2.26 expected) but it beat on revenues ($32.2 billion vs $31.5 billion) and announced a sizable stock repurchasing approval. The rally for META notched a 23 percent charge which seemed to hearten the beleaguered tech sector. Yet, a technically significant development like Google shares gapping sharply higher and closing above the 200-day moving average was a provocative move which would add a speculative skew to the market’s view.

Chart of Google with Volume and Gaps (Daily)

image2.png

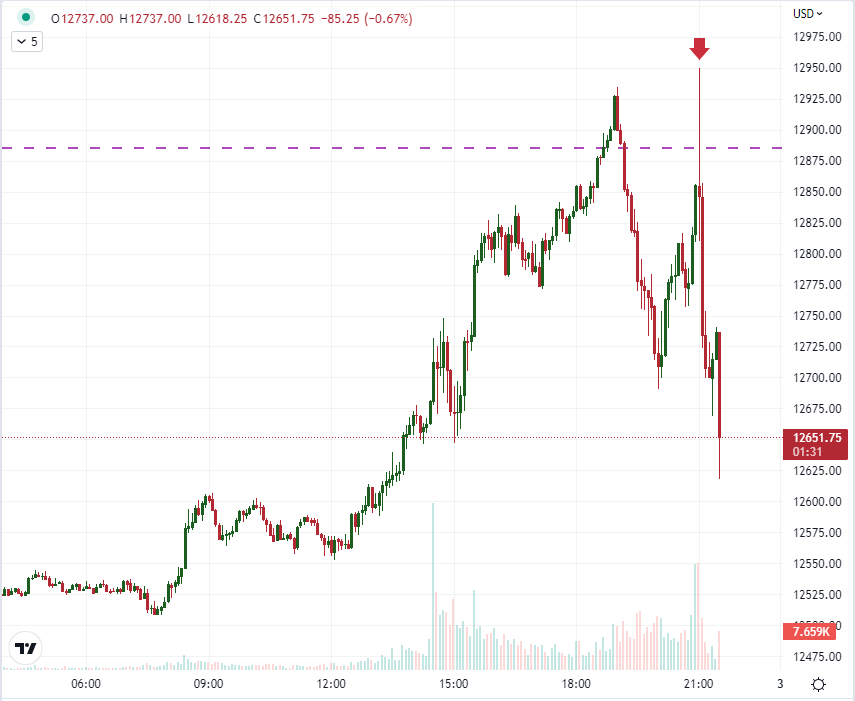
Apple earnings were arguably the worst of the three relative to expectations. Given the weight this particular stock carries in the Nasdaq 100, it should be the one macro observes should watch the most closely before and during the Friday open.

EPS (Earnings Per Share): $1.88 versus $1.94 expected

Revenue: $117.2 Billion versus $121.9 Billion expected

Chart of Apple with Volume (5-Minute)

image3.png

For top e-commerce company Amazon, the mix between top line and bottom line offered a little more room for doubt by both bulls and bears. This company in particular is interesting given its place at crossroads of consumer spending being effected by inflation and soured growth forecasts alongside the ebullience of tech.

EPS: $0.03 versus $0.17 expected

Revenue: $149.2 Billion versus $145.6 Billion expected

Chart of Amazon with Volume (5-Minute)

image4.png

For search titan Google, the take in was actually inline with analysts’ consensus forecast. Yet, that may not have been enough given the strong rally this past session and the miss on earnings per share.

EPS: $1.05 versus $1.18 expected

Revenue: $76.05 Billion versus $76.07 Billion expected

Chart of Google with Volume (5-Minute)

image5.png

Dow Conspicuously Lags S&P 500 and Nasdaq, Dollar Rebounds Ahead of NFPs

Dow Conspicuously Lags S&P 500 and Nasdaq, Dollar Rebounds Ahead of NFPs

Risk appetite seemed to have found serious purchase this past session for benchmarks like the S&P 500, but the charge was noticeably uneven. With a questionable backdrop for the bulls, a stumble in earnings afterhours Thursday night and some key event risk ahead; traders should take stock of the discrepancy. First, let’s indulge the boiled down bullish perspective. With gains already accumulating in certain speculative corners this past month, the Federal Reserve’s decision Wednesday with a smaller 25 basis point rate hike and reference to the ‘disinflation process’ scratched a common itch for the investors that had grown used to central banks catering to their whims over the past decade. The more than 20 percent charge from Meta shares after the company’s earnings seemed to further add fuel to the fire. However, through all of that, the ‘blue chip’ Dow Jones Industrial Average seemed wholly unimpressed. Compared to the S&P 500’s 1.5 percent advance and Nasdaq’s 3.6 percent surge, the Dow closed 0.1 percent lower after a session that was hardly ever green on the day. We could chalk this up to an outlier, but it wasn’t the only risk benchmark I refer to that was struggling. Also, if there is a solid foundation to ‘risk on’, it would be unusual to see one of the world’s preferred sentiment measures not participate.

Chart of Dow Jones Industrial Average Overlaid with the Nasdaq 100 and S&P 500 (Daily)
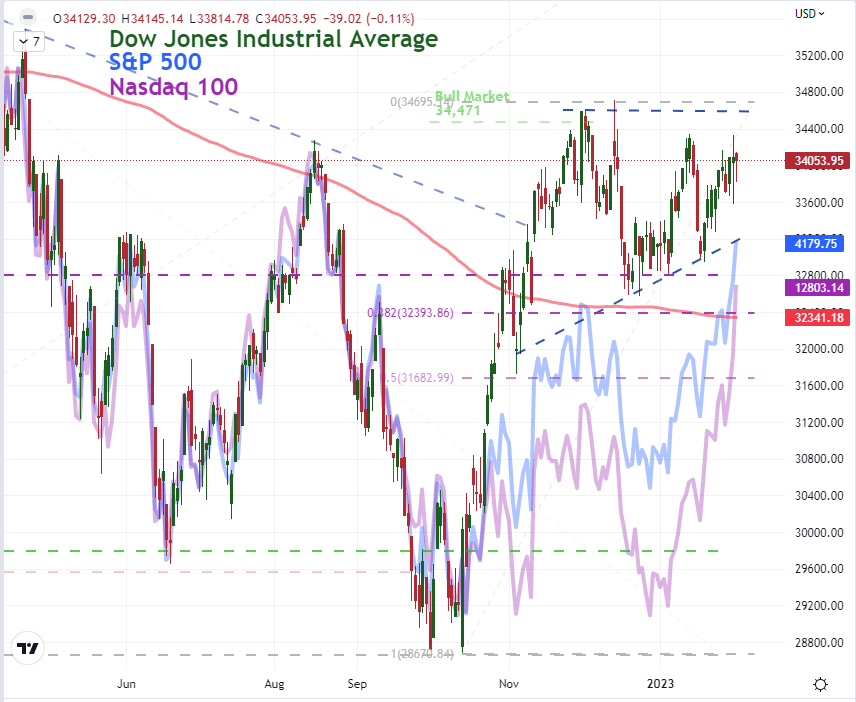
image1.png

Taking a different look at the backdrop on risk trends, I refer to one of my favorite internal measures below: the Nasdaq 100 to Dow ratio. This reduces the implications of equities and US markets, which can be overriding factors difficult to curb from a straight review of any of the individual indices. This pits a preferred ‘growth’ measure (it was the preferred vehicle before the meme and crypto phases) versus a more stoic ‘value’ index. As you’d expect from their divergent performances, the ratio experienced a massive surge this past session. In fact, the 3.7 percent charge was the second largest charge (after Mar 9th, 2021) from this comparison in the past two decades. And, while I don’t pay much attention to technicals on ratios (nor data series), this measure did happen to overtake its 200-day simple moving average (SMA) on the same day Apple, Amazon and Google all overtook their equivalent long-term trends. The earnings that we registered afterhours for the three were mixed at best with the largest (Apple at over $2 trillion market cap) a miss on both top and bottom line. We will see what happens to the tech sector in Friday trade, but this looks more likely a targeted reach for volatile and popular ‘risk’ measures rather than a bid for the overall market. While the bull trend could solidify, it is still an uneven foundation.

Chart of Nasdaq 100 to Dow Ratio with 200-Day SMA and 1-Day Rate of Change (Daily)
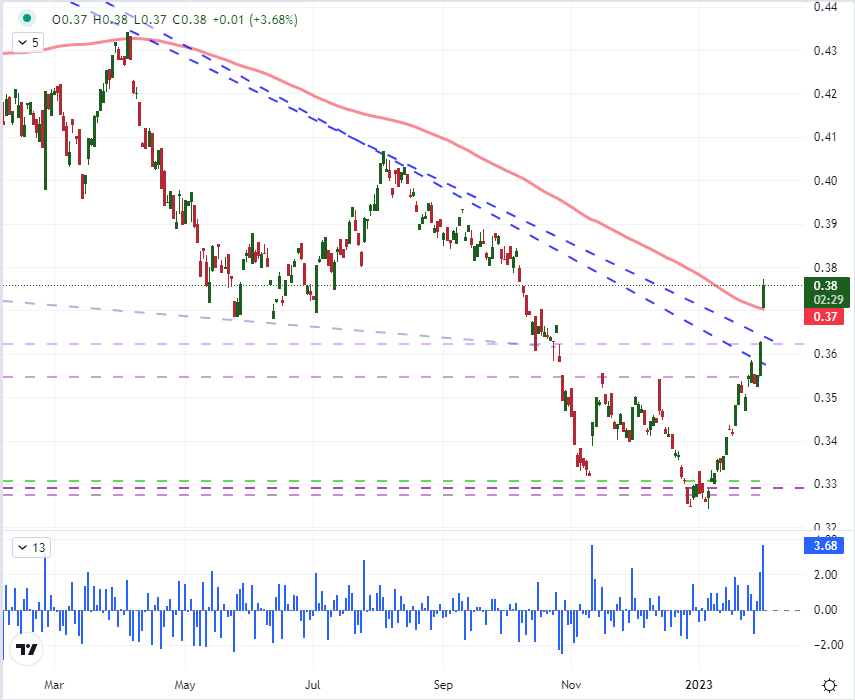
image2.png

Meanwhile, another interesting market discrepancy to the general expectation of risk appetite was the recovery from the US Dollar. The Greenback has a number of fundamental drivers, but its safe haven status seems to have drawn the most reliable correlation with the VIX slide lining up neatly to the currency. The volatility index did edge higher this past session even though the S&P 500 (from which it is derived) advanced. For the DXY Dollar Index, the day was a 0.6 percent gain – the biggest since the January 5th failed breakout – following the biggest gap lower since October 6th. Likely helping the Dollar’s case was the response to both the European Central Bank (ECB) and Bank of England (BOE) rate decisions. For the UK central bank, the 50 basis point hike met expectations, but the real response was to a similarly expected dovish outlook for a nearby cap on rates. The ECB hiked 50 basis points and made clear at least another similar move was ahead, but the Euro still dropped broadly. The US rate outlook through year end hasn’t changed much, so what theme will take up the reins to guide Dollar to its next leg: safe haven or carry benefactor?

Chart of EURUSD with 20-Day SMA and 1-Day Rate of Change (Daily)
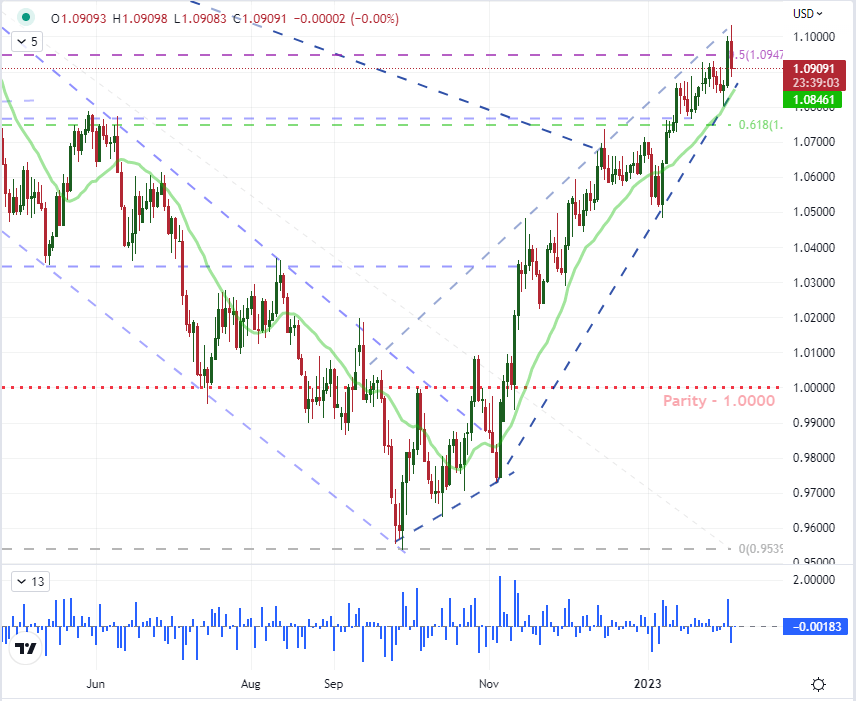
image3.png

As we head into the final trading session of the week, there is a lot of unresolved fundamental backdrop. The interpretation of global monetary policy is still unfolding in real time. The most distinct global macro impact of earnings this season will show through in Friday trade after the nearly $4 trillion worth of market cap from just Apple, Amazon and Google alone. If it can build a head of steam – bullish or bearish – it can exact a significant amount of control. Then there is also the implications of recession uncertainty. The IMF lifted its forecast earlier this week, but that hasn’t exactly absolved the market of its worry. For a top listing, the nonfarm payrolls (NFPs) will once again be dissected as the proxy for every fundamental discussion in the market. It will certainly generate a lot of headline space. However, my focus is on another indicator with better alignment to the state of the world’s largest economy: the ISM service sector report.

Top Global Macro Economic Event Risk for Next Week
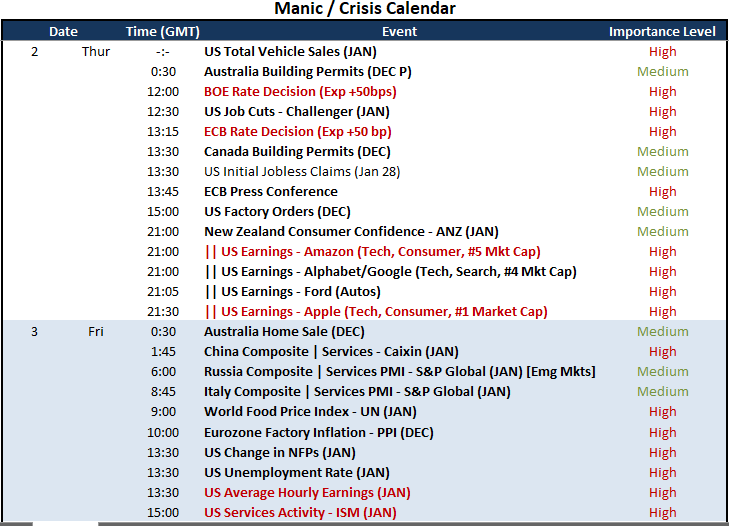
image4.png

The service sector in the United States accounts for approximately three quarter of the country’s output and employment. As such, there are few measures that are more closely aligned to its general economic health. Given that it is updated monthly, it is a more timely proxy of the biggest fundamental question in the market: economic strength. Notably, the service sector measure fell sharply in the last update to contractionary territory (a reading below 50.0) and the manufacturing report earlier this week extended its own slide. Forecasts are for a bump back above the 50.0 market (50.4 consensus), but there is probably more potency for a disappointment here.

Chart of S&P 500 with US Mfg and Service Activity, Overlaid with Official Recessions (Monthly)
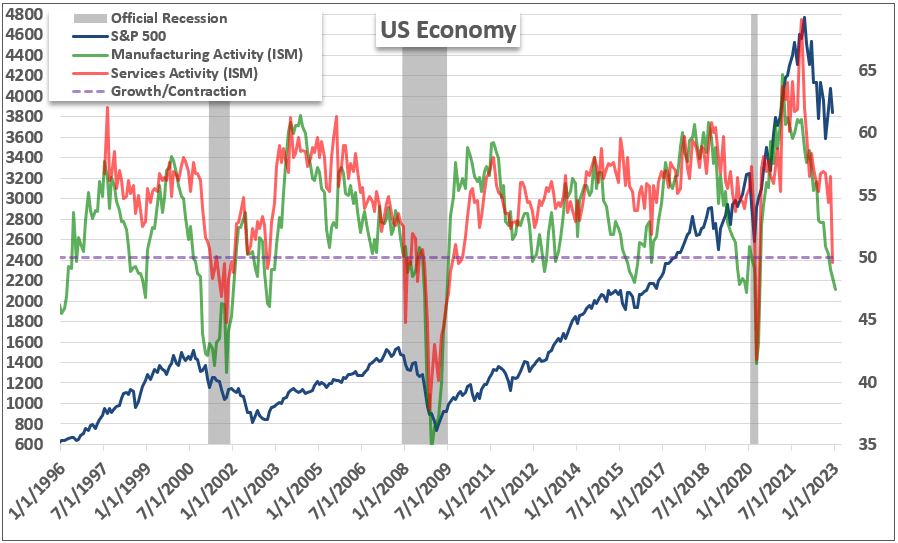
image5.png