GBPUSD Stuck As Both Fed, BoE Interest Rate Calls Loom

GBPUSD Stuck As Both Fed, BoE Interest Rate Calls Loom

GBP/USD traders can look forward to interest rate decisions from both sides of the currency pair this week, with the United States Federal Reserve and the Bank of England due to make their February moves on Wednesday and Thursday, respectively.

Perhaps the biggest question in the global foreign exchange market right now is how close the Fed might be to ending its cycle of rate increases. There’s broad consensus that we’re not there yet, however, and the markets are looking for a quarter-point increase this time around.

Meanwhile, the Bank of England is tipped to raise its own base rates by half a percentage point. That would take them to 4%, their highest point since the financial crisis of 2008, with more increases expected. However, there have been dissenting voices on the rate-setting Monetary Policy Committee and a smaller increase would seem to remain very much in play.

Still, Sterling has garnered some broad support from interest rate differentials since it troughed against the US unit in October of last year. It’s important to stress that this hasn’t necessarily been much of a confidence vote in Sterling’s home economy which continues to under-rev, plagued by inflation and post-Covid fallout. However, there is reportedly some hope that BoE Governor Andrew Bailey and his colleagues may now find the outlook at least a little less gloomy than it was at the end of last year.

Last year they warned of a prolonged recession as energy bills surged. However, official figures since have pointed to ongoing sluggish economic growth and a high degree of labor-market resilience.

GBP/USD remains quite well supported, having risen from the $1.10 mark to the $1.24 handle in the past three months or so. However the latter, psychological resistance level has yet to be conclusively broken through, and it seems probable that it will take delivery of that half-percentage-point rise to do the trick.

GBP/USD Technical Analysis

GBP/USD’s broad uptrend channel remains quite well respected but, for all that, hasn’t seen a convincing upside test since December 22 when the pair topped out at 1.24521.

The first Fibonacci retracement of its rise to that level from last October’s lows remains an important support, with very little appetite evident on the part of sterling bears to push it far below that point.

There’s plenty of room for upside before we get to the top of the current uptrend channel, however. That doesn’t come in until 1.29261 at this point and probably won’t be challenged anytime soon. However, the previous top might be, with this week’s interest rate decisions likely the catalyst. It will be fascinating to see whether the bulls can push matters durably above 1.25, something they’ve notably failed to do so far this year.

If they fail to do so this week, it could well be that the uptrend channel base comes back into play. That can be found at 1.21566. Admittedly that is well below the current market (GBP USD was at 1.23908 0845 GMT Monday). However,r it is much closer than that channel top.

IG’s own sentiment data suggest that progress could be hard won for the Pound in any event. More than 60% of respondents are in the bearish camp at current levels.

US Dollar Poised Ahead of Fed as China Returns. Where to for USD?

US Dollar Poised Ahead of Fed as China Returns. Where to for USD?

The US Dollar continues to tread water to start the week ahead of the Federal Open Market Committee (FOMC) meeting on Wednesday.

The market is anticipating a 25 basis point (bp) lift in the target rate. Friday’s PCE inflation data suggests that a slowing in the pace of hikes might be appropriate.

A crucial aspect will be the post-decision press conference where Fed Chair Jerome Powell will be speaking in a question-and-answer session. US Treasury Secretary Janet Yellen highlighted recession risks last Friday.

It is a big week ahead for central banks with the Bank of England (BoE) and the European Central Bank (ECB) also delivering a verdict for their respective rate paths on Thursday. A Bloomberg survey of economists forecasts a 50 bp hike from both banks.

Mainland Chinese markets re-opened today after a week off to celebrate the Lunar New Year. The CSI 300 equity index opened over 2% higher but then eased lower throughout the day. Hong Kong’s Hang Seng Index (HSI) went deep in the red, down over 1.6% at one stage.

Korea’s Kospi index was also notably lower while Australian and Japanese indices were little changed. Futures markets are pointing to a benign start to the Wall Street cash session later.

Currency markets have had a quiet start to the week while crude oil continues to languish after Friday’s sell-off. OPEC+ will be meeting on Wednesday to discuss production targets where most of the market is not anticipating a change.

Likewise, gold has been subdued so far, trading near US$ 1,930 at the time of going to print.

After the German GDP number today, the US will see the latest read of the Dallas Fed’s manufacturing activity index.

DXY (USD) INDEX TECHNICAL ANALYSIS

The DXY index continues to moulder near the 10-month low. This month’s low of 101.50 and the May 2020 low of 101.30 might provide support. The price has been in the 101.50 – 103.49 range for 3-weeks.

On the topside, resistance could be at the breakpoint of 103.42 or the prior peaks of 103.49, 105.63, 105.82, 107.20 and 108.00.

image1.png


NFP and Forex: What is NFP and How to Trade It?

NFP and Forex: What is NFP and How to Trade It?

What is the NFP?

The non-farm payroll (NFP) figure is a key economic indicator for the United States economy. It represents the number of jobs added, excluding farm employees, government employees, private household employees and employees of nonprofit organizations.

US Non Farm Payroll historical results

NFP releases generally cause large movements in the forex market. The NFP data is normally released on the first Friday of every month at 8:30 AM ET. This article will explain the role NFPs play in economics and how to apply NFP release data to a forex trading strategy.

How does the NFP affect forex?

NFP data is important because it is released monthly, making it a very good indicator of the current state of the economy. The data is released by the Bureau of Labor Statistics and the next release can be found on an economic calendar.

Employment is a very important indicator to the Federal Reserve Bank. When unemployment is high, policy makers tend to have an expansionary monetary policy (stimulatory, with low interest rates). The goal of an expansionary monetary policy is to increase economic output and increase employment.

So, if the unemployment rate is higher than usual, the economy is thought to be running below its potential and policy makers will try to stimulate it. A stimulatory monetary policy entails lower interest rates and reduces demand for the Dollar (money flows out of a low yielding currency). To learn exactly how this works, see our article on how interest rates effect forex.

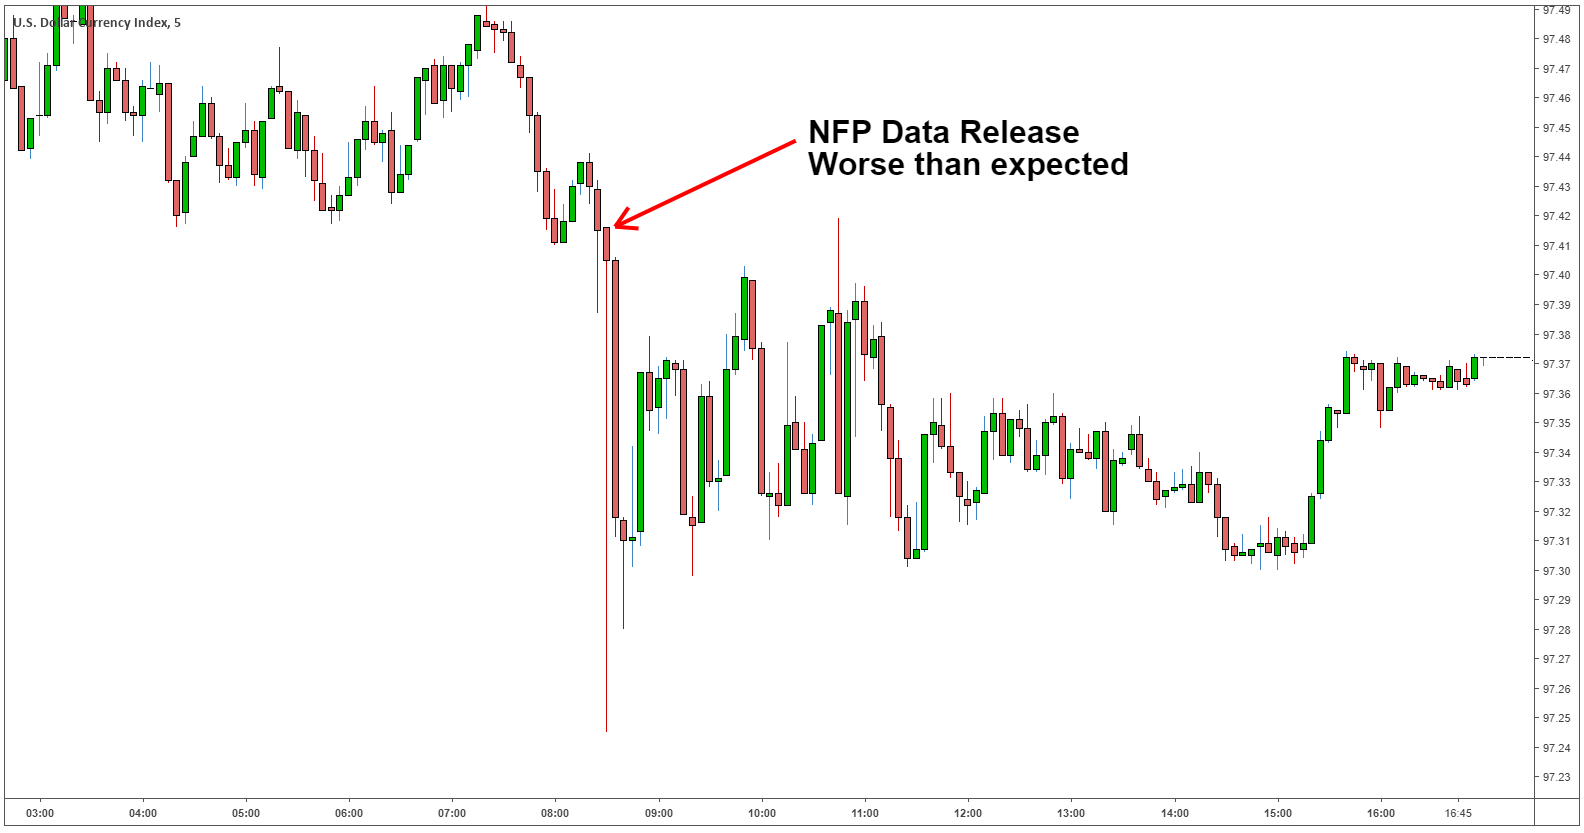
The chart below shows how volatile forex can be after an NFP release. The expected NFP results for March 8, 2019 were 180k (job additions), the actual result disappointed with only 20k jobs being added. As a result, the Dollar Index (DXY) depreciated in value and volatility increased.

NFP forex reaction

Forex traders must be wary of data releases like the NFP. Traders could get stopped-out due to the sudden increase in volatility. When volatility increases, spreads do too, and increased spreads can lead to margin calls.
Which currency pairs are most affected by NFP

The NFP data is an indicator of American employment, so your currency pairs that include the US Dollar (EUR/USD, USD/JPY, GBP/USD, AUD/USD, USD/CHF and others) are most affected by the data release.

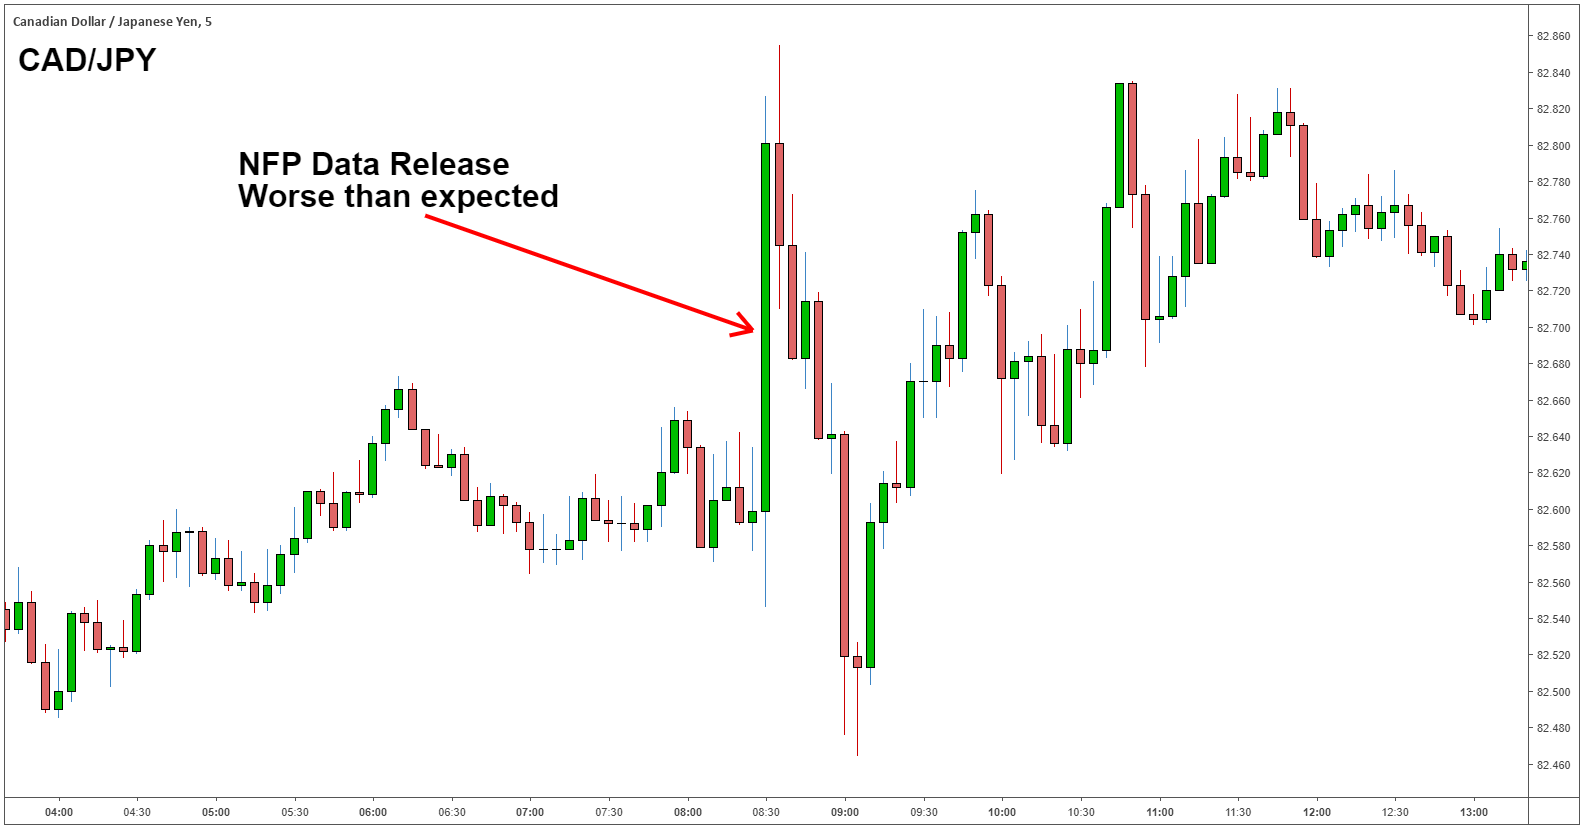
Other currency pairs also display an increase in volatility when the NFP releases, and traders must be aware of this as well, because they may get stopped out. The chart below shows the CAD/JPY during the NFP data release. As you can see, the increase in volatility could stop a trader out of their position even though they are not trading a currency pair linked to the US Dollar.

CAD/JPY NFP reaction

Non-farm payroll release dates

The Bureau of Labor statistics normally releases the NFP data on the first Friday of each month at 8:30 AM ET. The release dates can be found on the Bureau of Labor Statistic’s website.

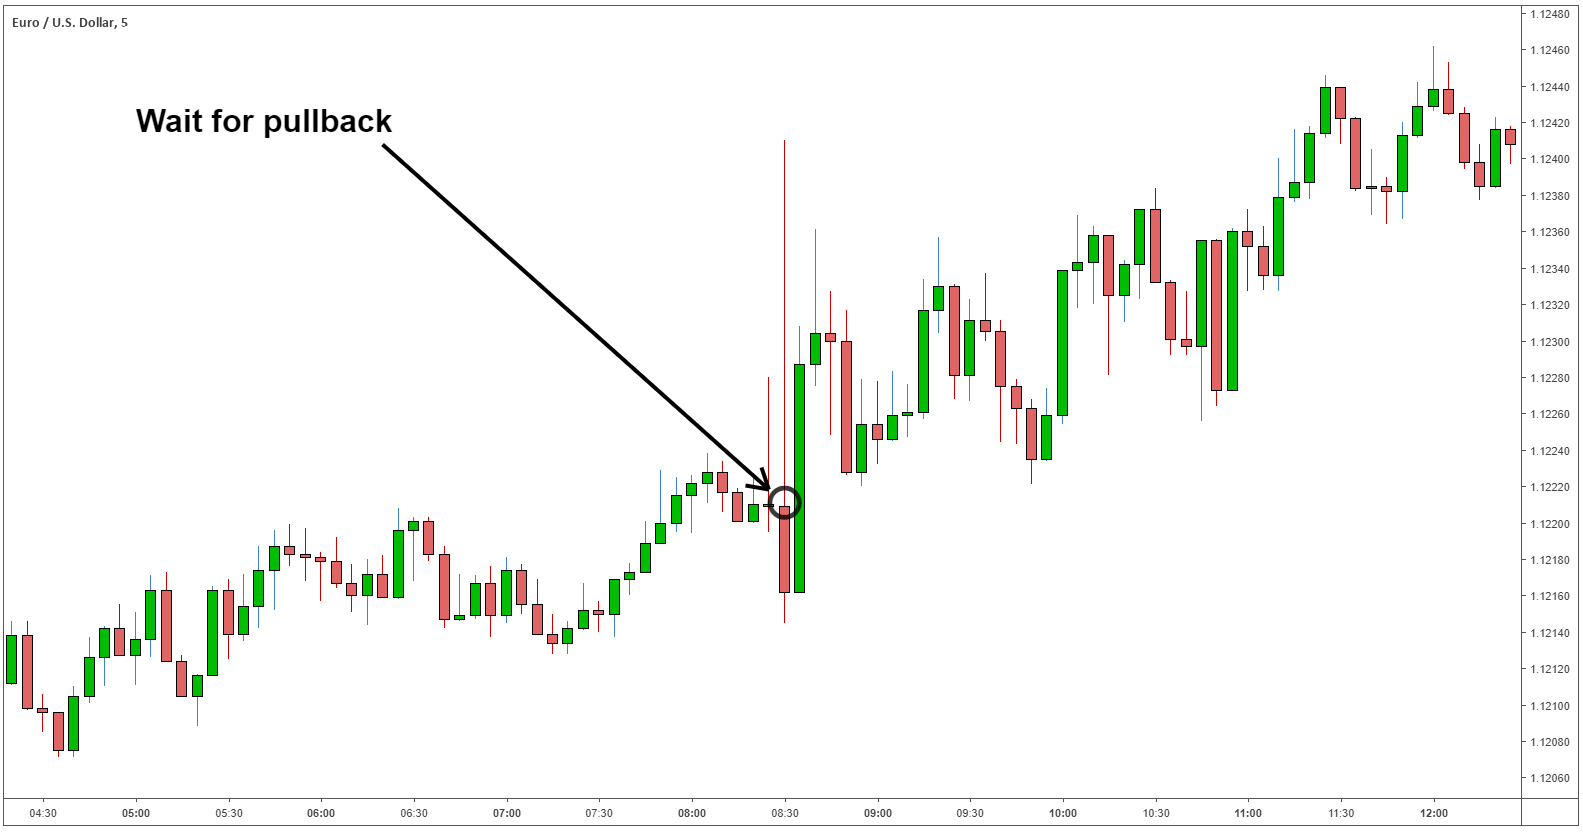
Due to the volatile nature of the NFP release, we recommend using a pull-back strategy rather than a breakout strategy. Using a pullback strategy, traders should wait for the currency pair to retrace before entering a trade.

Using the same example as above (NFP results 20k vs 180k expected) we expect the US Dollar to depreciate. In the example below, we use the EUR/USD. Because the NFP data came out worse than expected, we forecast the EUR/USD to appreciate.

EUR/USD NFP data pullback strategy

What is Leverage in Forex? Forex Leverage Explained

What is Leverage in Forex? Forex Leverage Explained

Many people are attracted to forex trading due to the amount of leverage that brokers provide. Leverage allows traders to gain more exposure in financial markets than what they are required to pay for. Traders of all levels should have a solid grasp of what forex leverage is and how to use it responsibly. This article explains forex leverage in depth, including how it differs to leverage in stocks, and the importance of risk management.

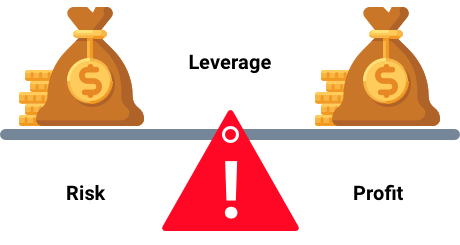
Leverage in forex fulchrum example showing margin and full trade size

What is leverage in forex trading?

Leverage in forex is a useful financial tool that allows traders to increase their market exposure beyond the initial investment (deposit). This means a trader can enter a position for $10,000 worth of currency and only need $1000, in a ten-to-one leverage scenario. However, it is essential to know that gains AND losses are magnified with the use of leverage. In adverse market scenarios, a trader using leverage might even lose more money than they have as deposit.

Leverage of ten-to-one means that traders can gain exposure to a notional value or trade size, ten times more than the deposit/margin that is required to fund the trade. This can be thought of in a similar fashion to putting a 10% deposit down on a house; you gain access to the entire house while only funding 10%of the full value.

Leverage is usually expressed as a ratio:

Leverage expressed in words Leverage expressed as a ratio
Ten-to-one 10:1
Thirty-to-one 30:1
Fifty-to-one 50:1

The amount of forex leverage available to traders is usually made available through your broker and the amount of leverage will vary according to regulatory standards that preside in different regions.
Leverage in forex vs leverage in shares

Forex leverage differs to the amount of leverage that is offered when trading shares. This is due to the fact that the major FX pairs are liquid and typically exhibit less volatility than even the most frequently traded shares. As a result, hedging risk and getting in and out of trades is more manageable in the $5.1 trillion a day FX market.

How is forex leverage calculated?

Traders require the following to calculate leverage:

  • The notional value of the trade (trade size)
  • The margin percentage

Brokers often provide traders with a margin percentage to calculate the minimum equity needed to fund the trade. Margin and deposit can be used interchangeably. Once you have the margin percentage, simply multiply this with the trade size to find the amount of equity needed to place the trade.

Equity = margin percentage x trade size

To calculate leverage, simply divide the trade size by the required equity.

Leverage = trade size/ equity

Forex leverage example

Below is a typical example of how to calculate leverage using the above formulas:

  • Trade size: 10 000 units of currency (one mini contract on USD/JPY with a trade size equal to $10 000)
  • Margin percentage: 10%

Equity = margin percentage x trade size

0.1 x $10 000

=$1 000

Leverage = trade size/ equity

$10 000 / $1 000

= 10 times or 10:1

The example highlights the basics of how forex leverage is used when entering a trade. However, it must be noted that traders should not simply calculate the minimum amount needed to enter a trade and then fund the account with that exact amount. Traders must be mindful of margin calls if the position moves in the opposite direction, bringing the account equity below an acceptable level determined by the broker.

Trading forex with leverage has the potential to produce large losses. We have calculated a typical scenario of how the use of excessive leverage can impact a trading account and tabulated the results.

How to manage forex leverage risk

Leverage can be described as a two-edged sword, providing both positive and negative outcomes for forex traders. This is why it is essential to determine the appropriate effective leverage and incorporate sound risk management.

Top traders make use of stops to limit their downside risk when trading forex.  we recommend risking no more than 1% of the account equity on any single trade and no more than 5% of the account equity for all open trades at any point in time.

Furthermore, successful traders make use of a positive risk-to-reward ratio in an attempt to achieve higher probability trades over time.

It is vital to avoid mistakes with leverage; to understand how to avoid other issues traders might face check our Top Trading Lessons guide.

gold

Gold and Silver Technical Outlook: Settling in a Range?

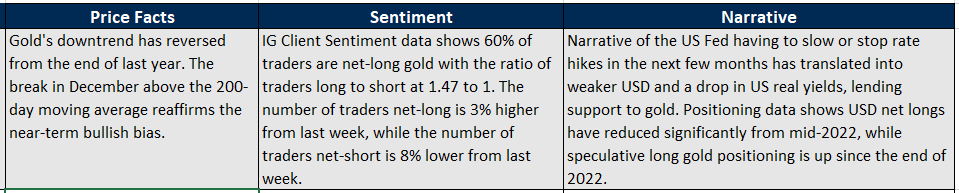
GOLD TECHNICAL OUTLOOK – BULLISH

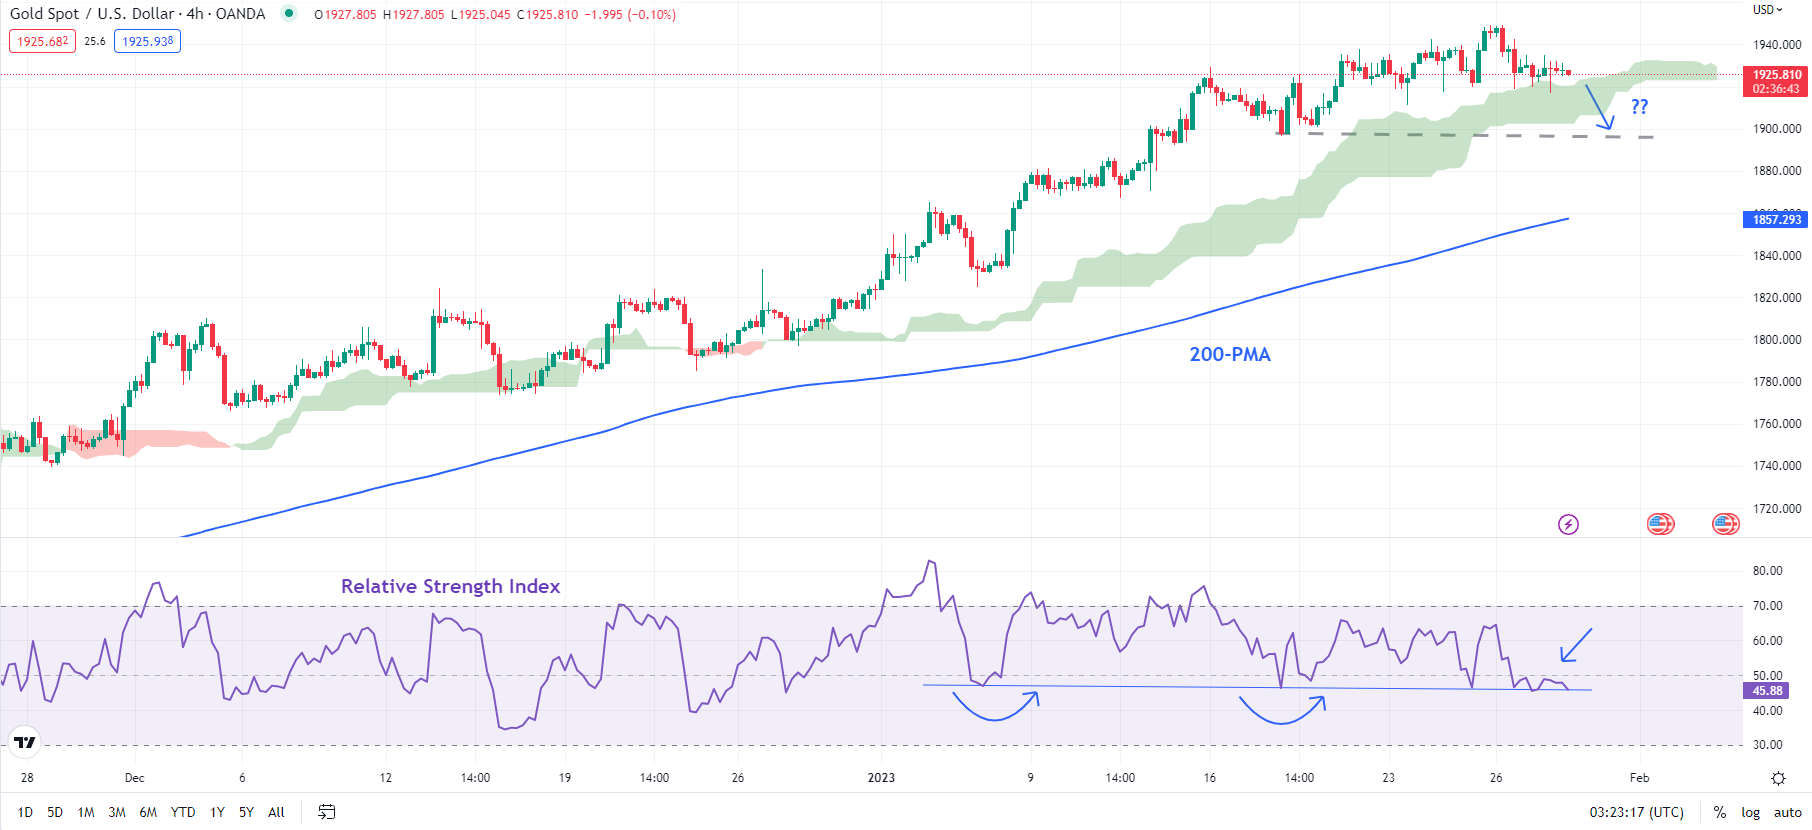
Lower timeframe charts suggest gold’s near three-month rally is beginning to look a bit tired, pointing to the risk of a minor pause in the rally in the near term. However, the broader trend continues to be up.

image1.png

To be sure, there is no sign of reversal of the multi-week uptrend (refer to the previous article for more discussion on the trend). Even on the hourly and the 4-hourly charts, XAU/USD hasn’t broken any meaningful support that could point to an imminent pause/minor retreat. One such support is the mid-January low of 1896. Any break below could open the way toward the 30-day moving average (now at about 1878), with a fairly strong cushion around 1855 (including the 200-period moving average on the 4-hourly chart).

XAU/USD 4-Hour Chart

image2.png

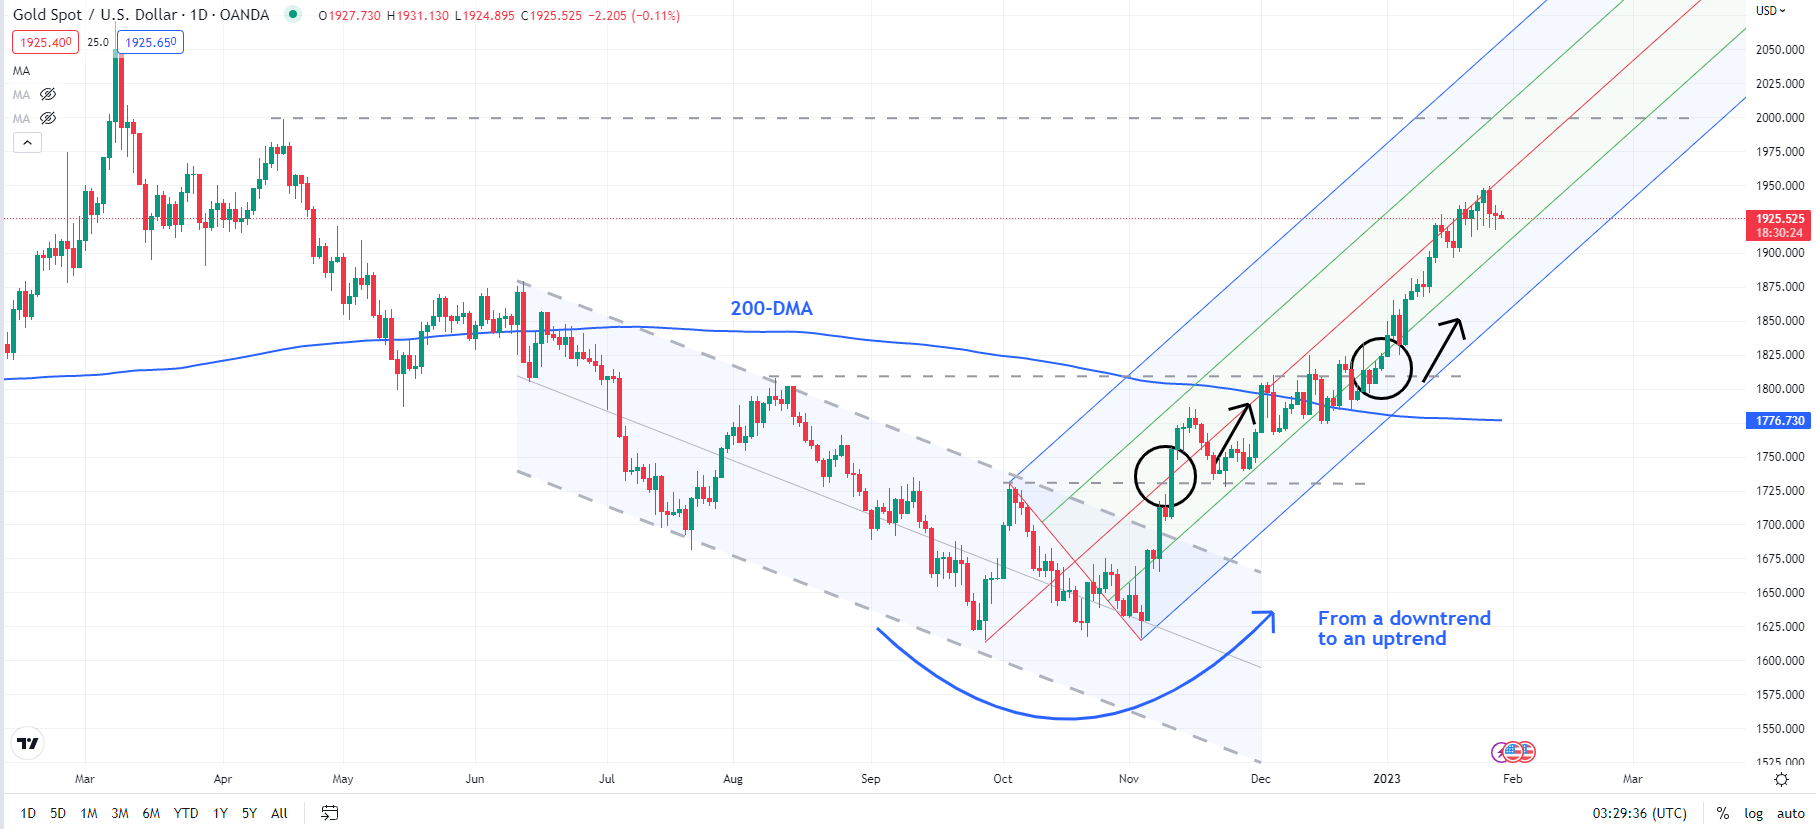
Beyond a few days, the yellow metal’s trend remains bullish after the grand reversal at the end of last year – from a downtrend channel to a rising channel (see the daily chart). The repeated breaks above key barriers, including the 200-day moving average, have confirmed that the interim trend remains up. Stiff resistance is at the April high of 1998, near the psychological 2000 mark.

XAU/USD Weekly Chart

image3.png

Zooming out, from a multi-month perspective, XAU/USD remains in a broad sideway range of around 1650-2050. In this regard, the rebound last year from a vital floor on the 200-week moving average was an encouraging sign for bulls, keeping hopes alive that the uptrend from 2015 remains in force.

image4.png

SILVER TECHNICAL OUTLOOK – NEUTRAL

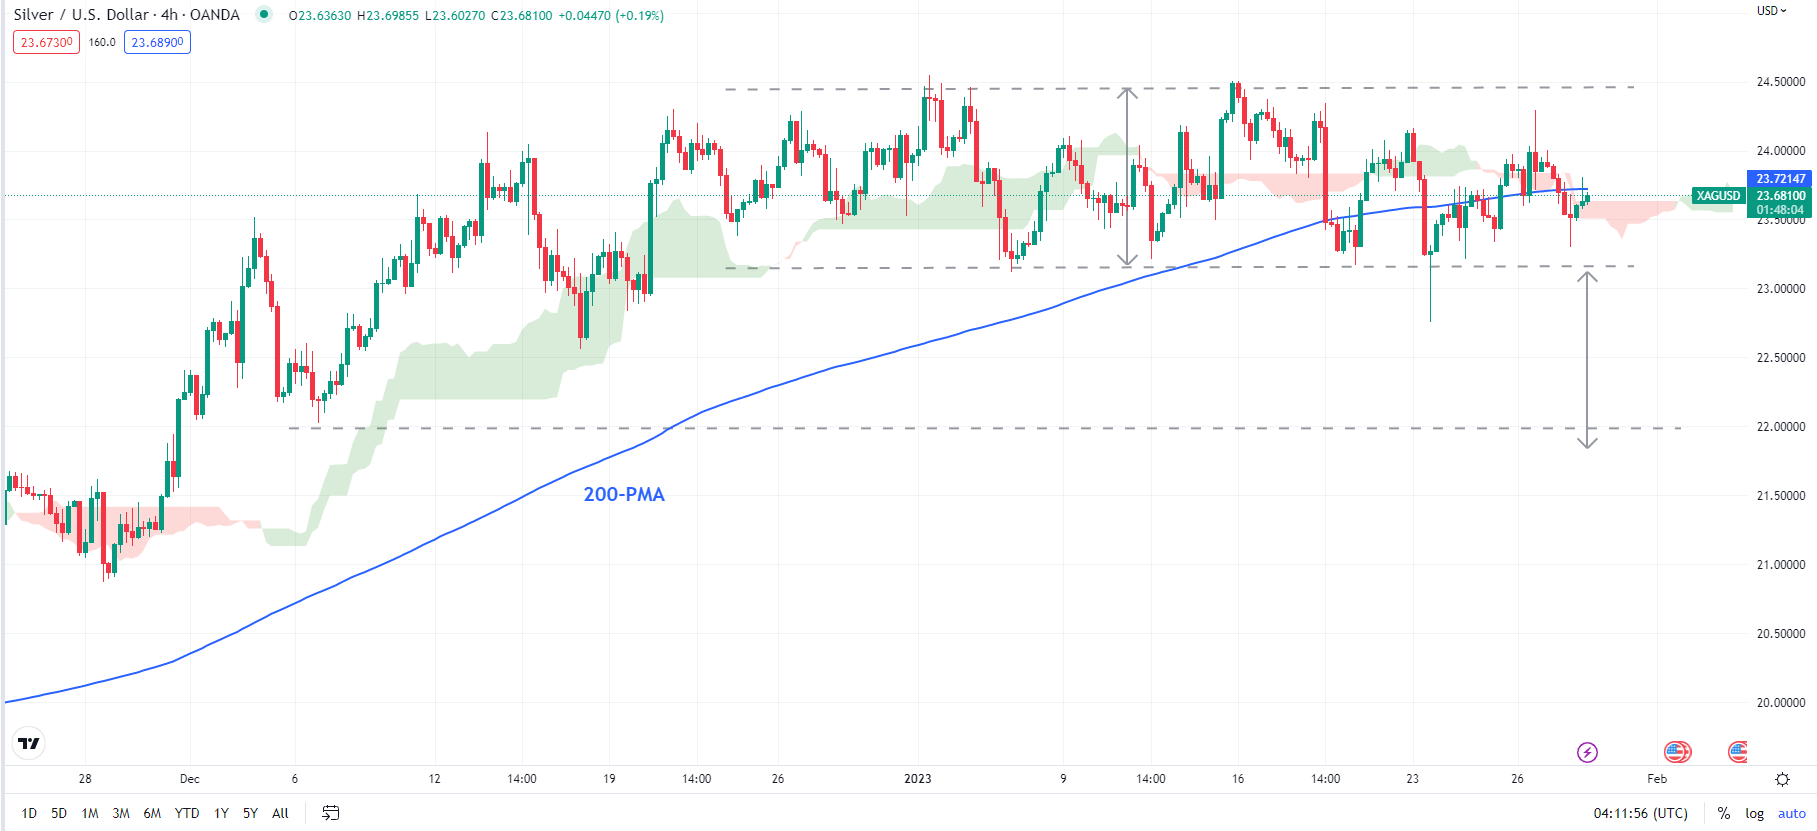
Silver’s outlook remains unchanged from last week, that is, continuity of a range, with a possible minor downward bias over the next few days.

XAG/USD 4-Hour Chart

image5.png

Chart Created Using TradingView

Ashighlighted last week, XAG/USD is weighed by a tough ceiling on a downtrend line from 2021. Despite the sharp rally since the end of 2022, the 14-week Relative Strength Index remains capped at around 60 – similar to the previous two rallies in Silver in 2021 and 2022.

image6.png

There is the immediate support on a horizontal trendline from last week at about 23.10. A break below could pave the way toward quite a solid floor at the mid-December low of 22.50, roughly the price objective of the sideways topping pattern (see 4-hour chart).

Markets Week Ahead: US Dollar, Euro, British Pound, Gold, Dow Jones, Fed, ECB, BoE

Markets Week Ahead: US Dollar, Euro, British Pound, Gold, Dow Jones, Fed, ECB, BoE

Global market sentiment continued improving this past week. On Wall Street, the Nasdaq 100, S&P 500 and Dow Jones gained 4.32%, 2.47%, and 1.81%, respectively. Across the Atlantic Ocean, the German DAX 40 gained 0.77%. Meanwhile, in the Asia-Pacific region, the Nikkei 225 and Hang Seng Index rose 3.12% and 5.15%, respectively.

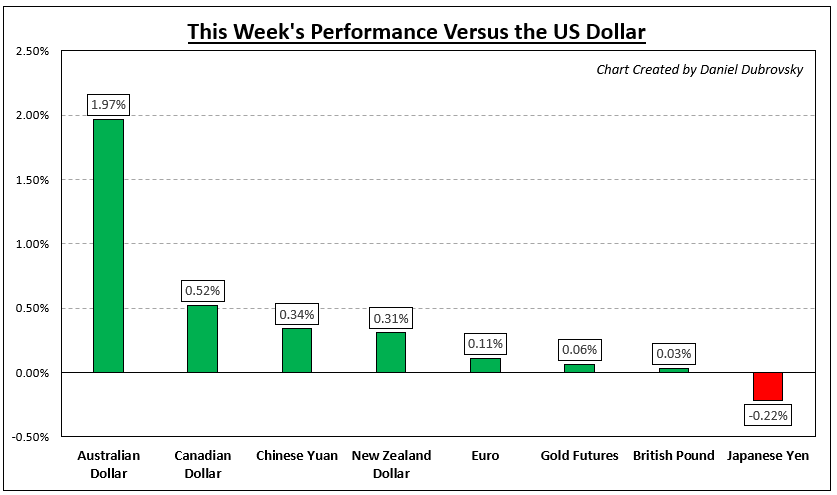
Global financial conditions continue easing, helping restore liquidity in the market even though the Federal Reserve is still hiking rates and unwinding its balance sheet. As such, the US Dollar is feeling the pain and had another lackluster week – see the chart below. Gold prices have also been gaining, albeit momentum has faded over the past couple of weeks.

A notable standout last week was the Australian Dollar. Higher-than-expected fourth-quarter inflation boosted hawkish RBA policy expectations, pushing AUD/USD higher. The sentiment-linked currency is also benefiting from the improvement in risk appetite. The similarly behaving New Zealand Dollar also rose this past week.

Ahead, all eyes turn to the FOMC rate decision on Wednesday. The pace of tightening is expected to slow to 25 basis points. But, what traders will be caring about is how the central bank’s outlook evolves relative to market pricing. The market appears more dovish than the Fed, setting the stage for disappointment.

Other notable event risks in the week ahead include January’s US non-farm payrolls report as markets continue gauging the health of the economy. The BoE and ECB rate decisions are also due for the British Pound and Euro, respectively. China releases manufacturing PMI for AUD/USD. What else is in store for markets in the week ahead?

How Markets Performed – Week of 1/23

How Markets Performed – Week of 1/23

S&P 500 and NASDAQ 100 INDEX Technical Outlook: Turning Bullish

S&P 500 and NASDAQ 100 INDEX Technical Outlook: Turning Bullish

Developments on the charts suggest US equity indices could be preparing for a break higher, raising the prospect that the worst could be over for now.

image1.png

S&P 500 INDEX TECHNICAL OUTLOOK – BULLISH

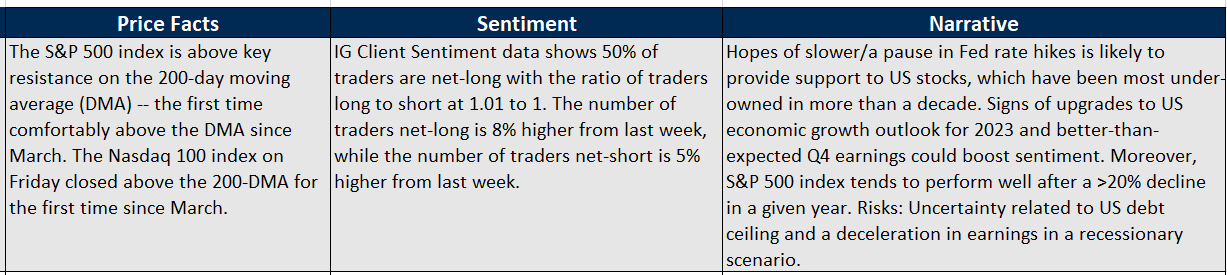
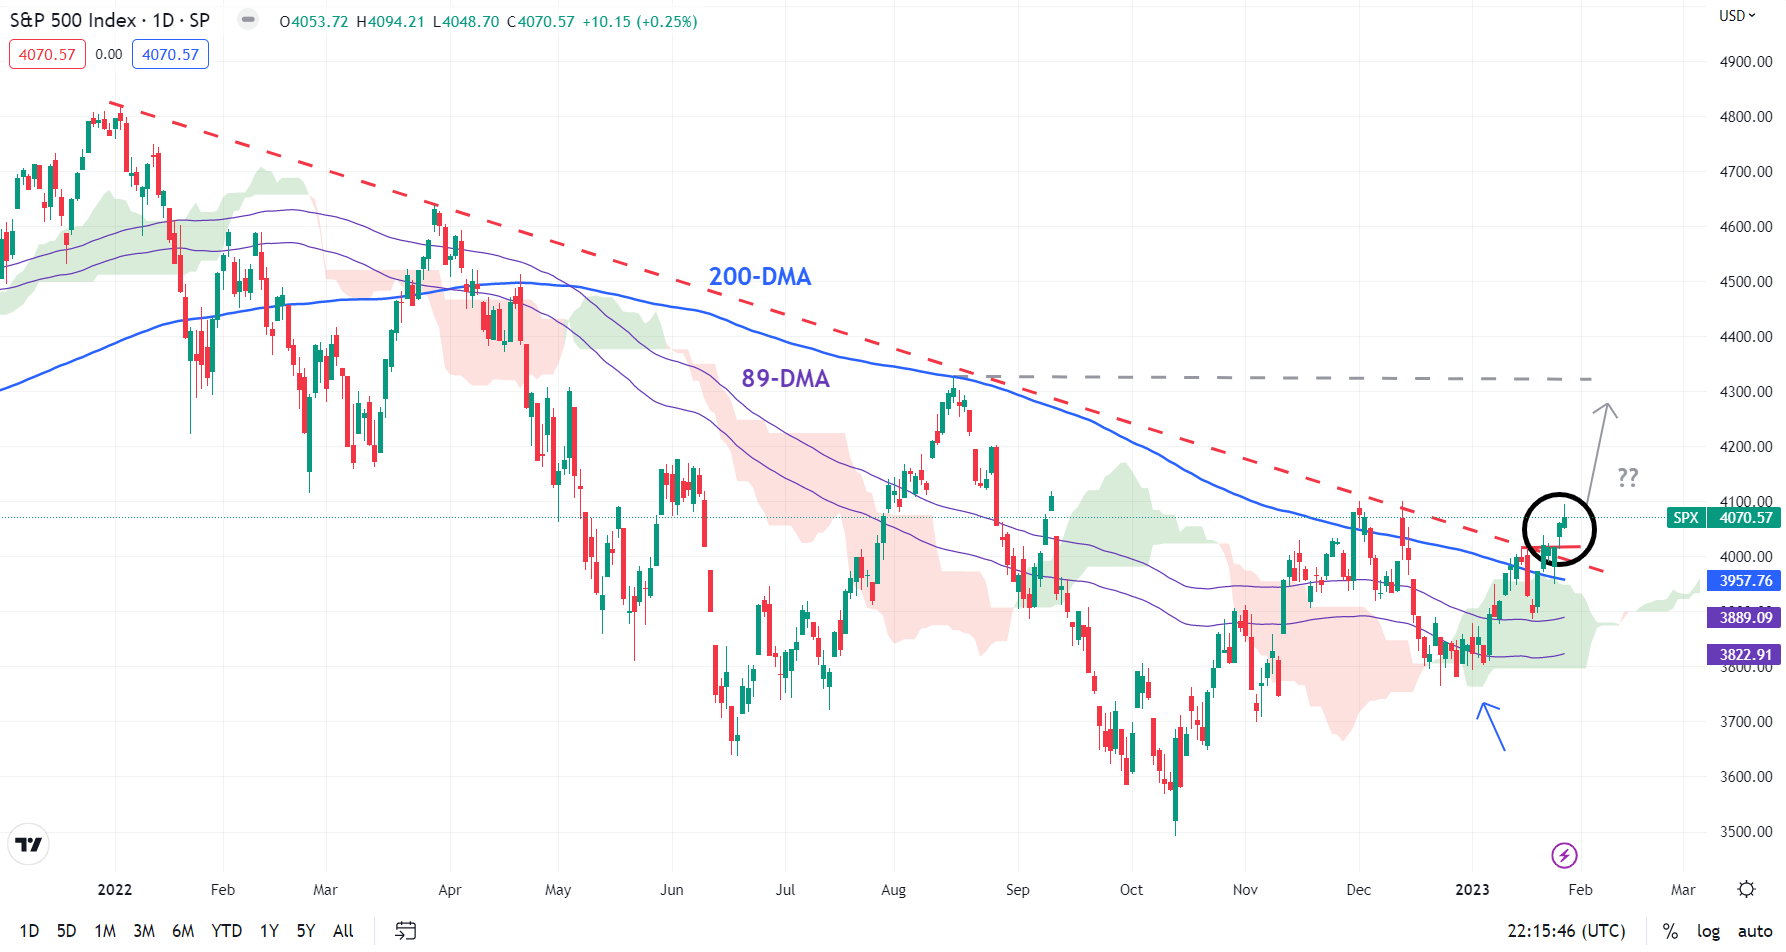
The S&P 500 index is attempting to break above a crucial converged barrier: the 200-day moving average, coinciding with the early-December high of 4100. As noted in the previous update, a decisive break above the 200-day moving average barrier would be significant as it would be the first such break since the downtrend began a year ago and would support the case that US equities are attempting to form an important base.

S&P 500 Daily Chart

image2.png

Improving momentum on lower timeframe charts and the rise above a key downtrend line from early 2022 suggest that the tide could be turning up for the index. This follows a hold last month above the key Ichimoku cloud support on the daily chart, creating a higher low in the process. If the index manages to break above 4100, it would be the first sequence of higher-highs-higher-lows on the weekly charts since the downtrend began a year ago. Importantly, such a break could open the door toward the August high of 4325.

NASDAQ 100 INDEX TECHNICAL OUTLOOK – BULLISH

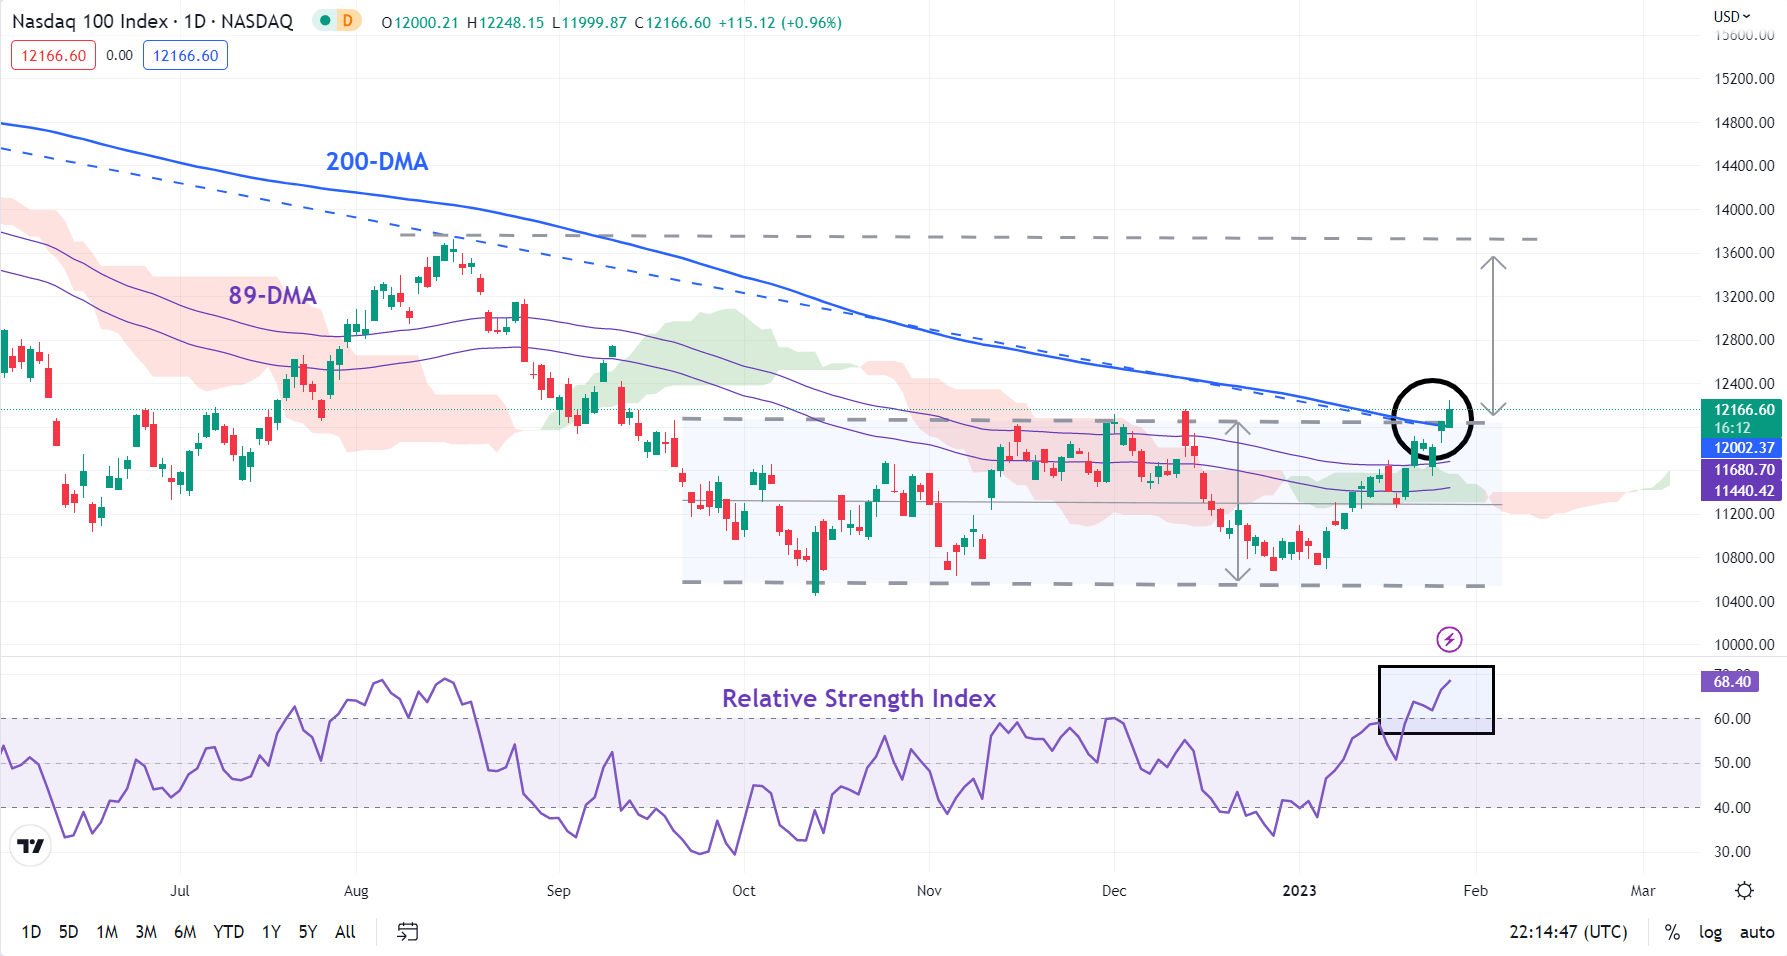
Two important developments on technical charts in recent days indicate the Nasdaq 100 index could be getting ripe for an uptrend. The rise above the Ichimoku cloud and the 89-day moving average on higher momentum (the 14-day Relative Strength Index rise to 68 – a rise above 60-65 tends to imply that an uptrend is gaining steam).

NASDAQ 100 Daily Chart

image3.png

Moreover, the close on Friday above a stiff converged hurdle, including the December high of 12166 and the 200-day moving average, is a sign that the trend could be turning up. A decisive close (two daily closes) could pave the way toward the August high of 13720, roughly the price objective of the sideway channel since the end of last year (see the daily chart).

On the downside, immediate support is at the mid-January low of 11252. Stronger support is on a horizontal trendline from the end of 2022 (at about 10600).

Dollar is Volatility Bound with FOMC, NFPs and Earnings…But Is There a Trend?

Dollar is Volatility Bound with FOMC, NFPs and Earnings…But Is There a Trend?

Fundamental Forecast for the US Dollar: Bullish

If there were a market that were better primed for a technical break over the coming week than the US Dollar, I am not aware of it. The activity levels for the Greenback these past two weeks has been extremely restricted, which is an extraordinary contrast to the dramatic slide the currency suffered through in its slide from multi-decade highs starting approximately four months ago. An accelerated reversal on a drawn-out bull run highlights the impact that speculation can have in amplifying price action when conviction hits its saturation point. While there is still plenty of potential for sentiment to swell behind a bullish or bearish view; from our present standing, it would likely need to come from a more concrete fundamental backdrop. From purely a statistical perspective, the likelihood of a technical break from the past two weeks’ range looks highly probable. Over the span of 11 trading days through Friday, the DYX Dollar Index has carved out its smallest range (1.37 percent) since February of last year – surpassing the quiet of the December holiday period. However, forging a breakdown doesn’t inherently mean a trend will follow. With a dense economic docket of top fundamental, market-moving indicators; volatility risk is high. Yet, a sequential release of this trend-capable data can also disrupt the market’s ability to formulate a clear path.

Chart of DXY Dollar Index with 50 and 100-Day SMAs, 11-Day Historical Range(Daily)

In the global economic calendar, there is plenty of event risk that carries the capacity to influence worldwide financial health – much less the US markets. However, it is likely that the US docket guides the global course. Filtering for just the major US event risk (and a couple global matters with heavy implications for the Dollar) below, it is easy to see the weight in the fundamental potential. Starting at the beginning of the week, we have the update from the IMF on the World Economic Outlook. This is an interim update on a report that is more ‘miss’ than ‘hit’ for satisfying the market’s view on growth forecasts and generating volatility. Nevertheless, this is a theme that we should keep a clear bead on given its profound implications for the global economy. There are a few more high-profile indicators with significant influence on the fundamental evaluation between the IMF and Wednesday afternoon’s FOMC rate decision (US consumer confidence and ISM manufacturing), but the pull of anticipation will likely prove difficult to override the curb on activity.

There is a lot of interpretation and competing expectations around the central bank’s rate decision, but the Dollar response that follows will tell us what way the markets are taking assessing. Depending on that assessment, Thursday afternoon’s FAANG earnings (Apple, Google and Amazon) could fuel speculation or growth theme. Friday’s NFPs release will also be of great interest for more than just its capacity for volatility. How we respond to the outcome – as a spark for rate speculation or the backdrop for economic health implications – will tell us a lot about our trajectory going forward.

Top US and Global Macro Event Risk Next Week

At the end of such a packed week, it is not clear to me what the guiding light will be for the markets fundamentally. Though we have seen the speculation around the Fed’s terminal rate and possibility for cuts in the second half of 2023 fuel bullish fever dreams up through recent weeks, the well of bullish enthusiasm that it seems to generate for risk assets seems to be flagging. Given the central bank’s stated stance, they are not in the form of responding to every ebb and flow behind market measures in a bid to feed marginal growth through tickle down economics as they once were. A relent on the inflation fight would either need to come from a sudden collapse in price pressures to suggest deflation is a risk – or the country would need to face a significant economic crisis. Neither would be particularly favorable for US health, but it could restore the Dollar’s safe haven status. Bullish or bearish, the relationship of the Greenback to implied rate forecasts (through Fed Fund futures) and risk trends (via the VIX) suggests that there is a slight advantage to the latter theme. And, as we know from volatility, fear is the stronger emotion.

Chart of DXY Dollar Index Overlaid with the VIX Volatility Index (Daily)

For most of the Dollar-based majors, the fundamental considerations tend to align to a fairly uniform perspective. EURUSD, GBPUSD and AUDUSD for example all seem to align to the same circumstances regardless of whether we are discussing growth forecast, risk trends or carry appetite. That said, I believe that there is some distinct refinement to USDJPY. From the carry trade perspective, the Bank of Japan does not seem as if it will be closing the gap with the Fed’s benchmark rate anytime soon. Therefore, a plateau in the US benchmark will generate less response here compared to a pair where the counter-currency contributes a perspective (such as the ECB with EURUSD). As for the ‘risk’ perspective, there is the carry trade consideration behind the Yen crosses and the epic rise in interest rates this past year. That said, how much over-extended premium is there to this pair after retracing half of its nearly two-year climb in the span of just a few short months? In this case, the more severe interpretation of a safety that usually conforms to the Greenback seems the more noteworthy sway.

Chart of USDJPY with 50 and 100-Day SMAs, Spot to 20-Day Differential Index (Weekly)

WTI Oil Fundamental Forecast: Short-Term Outlook Promising with Key Risk Events in the Week Ahead

WTI Oil Fundamental Forecast: Short-Term Outlook Promising with Key Risk Events in the Week Ahead

WTI WEEK IN REVIEW

Crude Oil looks on course to end the week in loss following mixed price action and the absence of Chinese traders. Chinese markets were celebrating the Lunar New Year with early data set to provide a boost to demand optimism heading into next week.

Early data released from China showed an increase in tourism and box office spending with a 120% jump in trips out of the country in the first 6 days of the Lunar New Year compared to the same time last year. This will serve to reinforce the markets confidence in the world’s biggest oil importer moving forward.

Most Read: S&P 500 and Nasdaq 100: Get Ready for an Event Packed Week Ahead

The dollar index has now been rangebound for the past 10 days without any clear direction which no doubt helped oil prices this week. Next week’s risk events which include the FOMC meeting will no doubt be eyed as a catalyst for the dollar index as it searches for a clearer direction moving forward.

OPEC+ MEETING

OPEC+ are expected to meet online next week in order to review oil policy. Delegates expect the advisory committee of ministers to recommend keeping production levels unchanged as global demand shows signs of a potential recovery.

The biggest sticking point at present remains the level of recovery out of China with tourism figures hinting at the potential for a strong recovery. A further point of contention for OPEC+ is the effect of sanctions on Russian supply which have yet to be fully felt. The path to a demand recovery for China as well as the effect of sanctions on Russian supply create a host of uncertainties moving forward which is likely to see OPEC+ remain conservative at its upcoming meeting. This would be in line with the recent rhetoric of top OPEC+ officials with Secretary-General Haitham Al-Ghais recently stating that he is cautiously optimistic on the global economy while Saudi Energy Minister Prince Abdulaziz bin Salman said that OPEC+ will remain proactive and preemptive when it comes to keeping markets in equilibrium.

Given the current conditions of firmer prices, tight supply and economic uncertainty the course looks set to be one of little to no change until more clarity is evident on the demand recovery front.

FOMC MEETING

The first Fed meeting of the year takes place next week and promises some volatility even if clarity may not be forthcoming. There seems to be a growing disconnect between the Fed rhetoric and markets at present. It would seem market participants are taking the recent Fed rhetoric of higher rates with a pinch of salt. US data remains strong which supports the Fed narrative, however this week’s move by the Bank of Canada has given market participants fresh impetus in their belief that the Fed will pause the rate hiking cycle sooner rather than later.

Markets have already priced in the majority of a potential 25bps hike for next week meaning without further bullish commentary from the Fed the dollar may remain susceptible to further losses. There are no new economic projections scheduled for release at next week’s meeting, which places further emphasis on the press conference for cues on the path moving forward. Interesting times ahead for the Fed and markets as a whole.

ECONOMIC CALENDAR FOR THE WEEK AHEAD

Next week brings a host of Central Bank meetings with the economic calendar set to enjoy a busy week. Over the course of the week, we have manufacturing PMI data out of China which could give a further indication of a potential demand recovery. This will be followed by 5 high rated data releases from the US which include the FOMC meeting and NFP data release and of course the OPEC+ meeting which is scheduled for February 1.

image1.png

TECHNICAL OUTLOOK AND FINAL THOUGHTS

The daily chart below sees us trade between the 50 and 100-day MAs right now with the pair enjoying a relatively indecisive week. A pullback to retest the 50-day MA looks likely before continuing higher. A daily candle close above the 100-day MA could see a test of the 61.8% fib level of the 2022 down move. However, given the recent rangebound nature this seems a bit of a stretch at the minute with too many uncertainties ahead.

The reason I am neutral on oil for the week ahead lies in the event risk next week coupled with some indecisive price action. There remains a strong possibility even with the major event risk that we remain confined to a range for a while longer.

WTI Crude Oil Daily Chart – January 27, 2022

Chart, histogram  Description automatically generated


Weekly Euro Forecast: ECB Hike Priced in and Has Core Inflation Peaked?

Weekly Euro Forecast: ECB Hike Priced in and Has Core Inflation Peaked?

Rate hikes from all three major central banks next week, apart from the Bank of England potentially, have been priced in ahead of next week’s meetings (Fed 25 bps, ECB 50 bps and BoE closer to 50bps than 25 bps). Therefore, markets will be more focused on clues regarding terminal rates and the path of future policy in the midst of lower inflation prints. With so many high-profile events on the docket next week, price action poses the threat of erratic moves however, the sheer volume of market moving information could provide the very catalyst markets have been searching for. The Neutral tag of the forecast has been put forward as shifts in sentiment next week have the potential to be drowned out by any number of other high impact data prints.

EU Economic Sentiment Improves (GDP Forecasts, PMI)

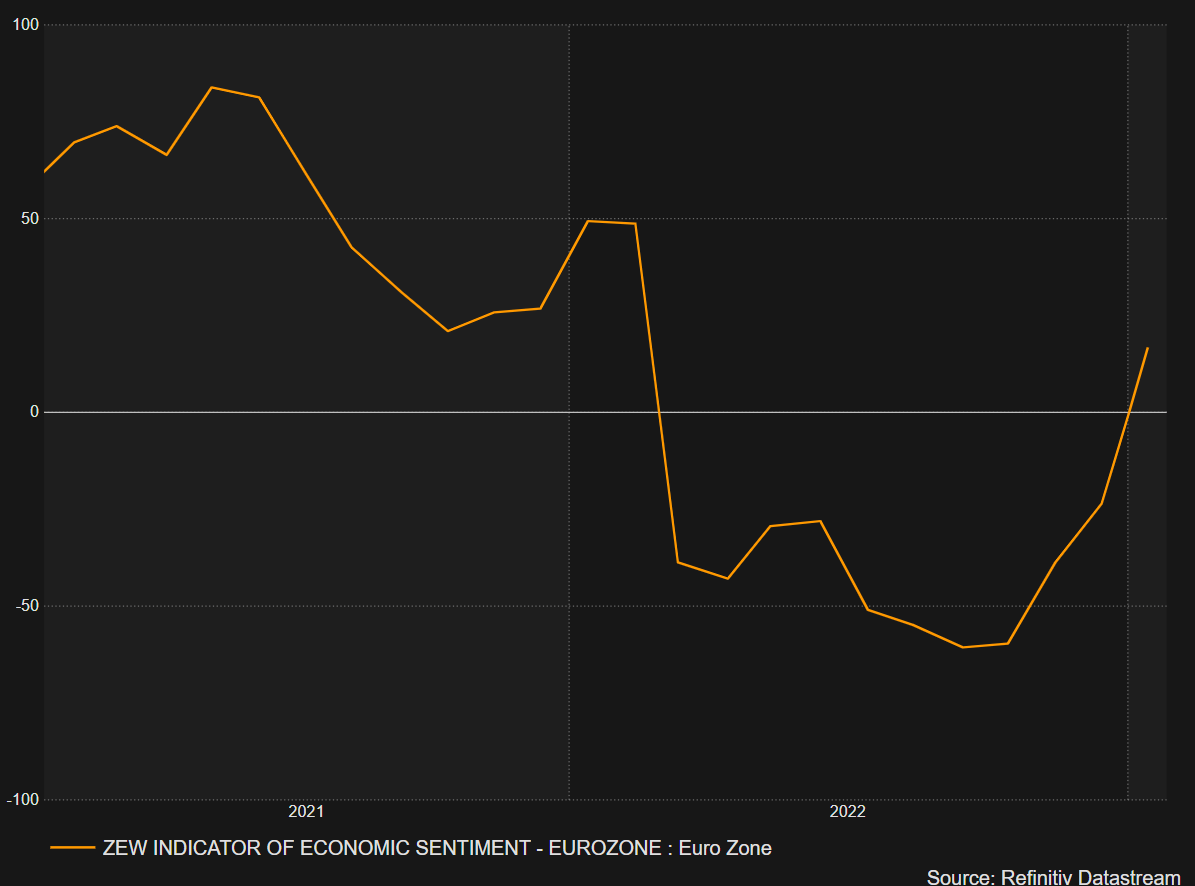
The milder winter weather in Europe appears to have kept a gas shortage crisis at bay which has helped motivate a slight upward revision in GDP growth from the German Economic Minister Robert Habeck. In fact, the German government now sees 2022 GDP growth at 0.2% for 2023, up from a prior contraction of 0.4%. Further good news appeared for the wider continent in the form of improved January (flash) PMI numbers released this week. Both manufacturing and services data beat estimates with the EU services statistic re-entering ‘expansionary’ territory (prints of 50 and above).


EU ZEW Economic Sentiment Showing a Massive Turnaround


image1.png

Source: Refinitiv, prepared by Richard Snow


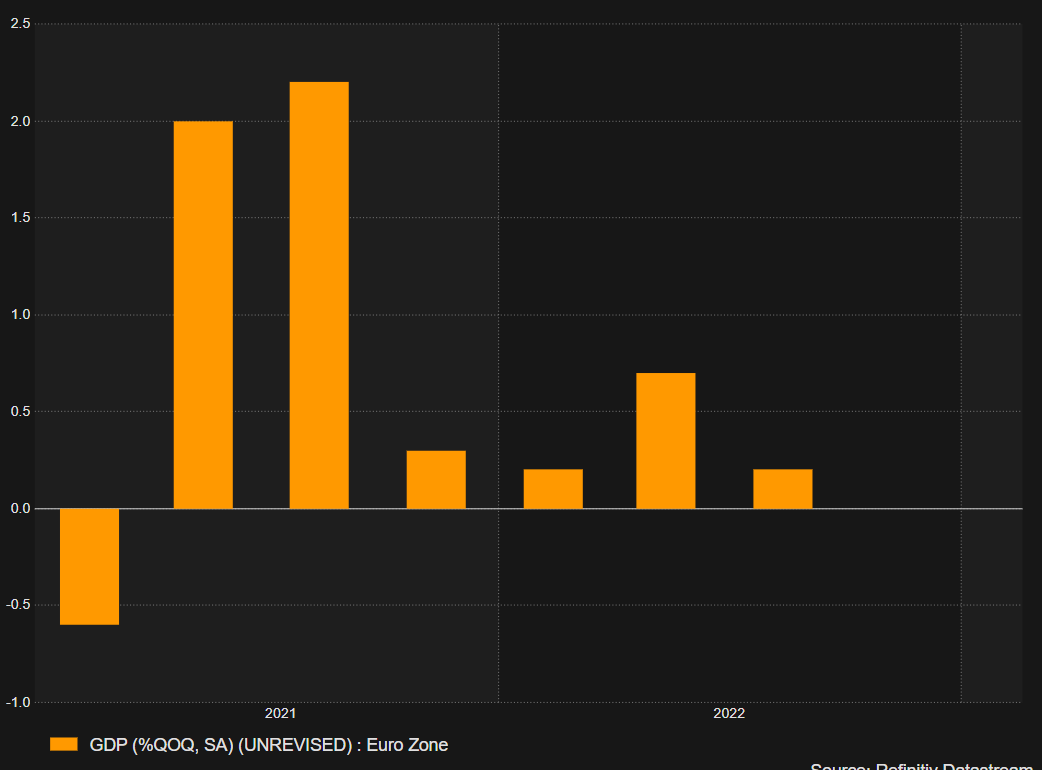
Will Q4 Avoid a Contraction?

Euro GDP data is due next week and the forecast suggests that we’ll see a quarter on quarter contraction and a 1.7% rise compared to Q4 of 2021.


image2.png

While green shoots of optimism have emerged around growth, the EU still has to contend with the likely scenario of a recession this year, although the ECB’s more hawkish member Klaas Knot believes a downturn could be avoided while the ‘neutral’ Villeroy commented before the media blackout period that he sees the EU avoiding a recession entirely on the back of improved activity.


EU GDP Languishes Ahead of the Anticipated Negative Q4 Print Next Week


image3.png

Source: TradingView, prepared by Richard Snow

Trading Forex News: The Strategy

Trading Forex News: The Strategy
Recommended by Richard Snow
Trading Forex News: The Strategy
Get My Guide

The ECB and the two-sided story of inflation

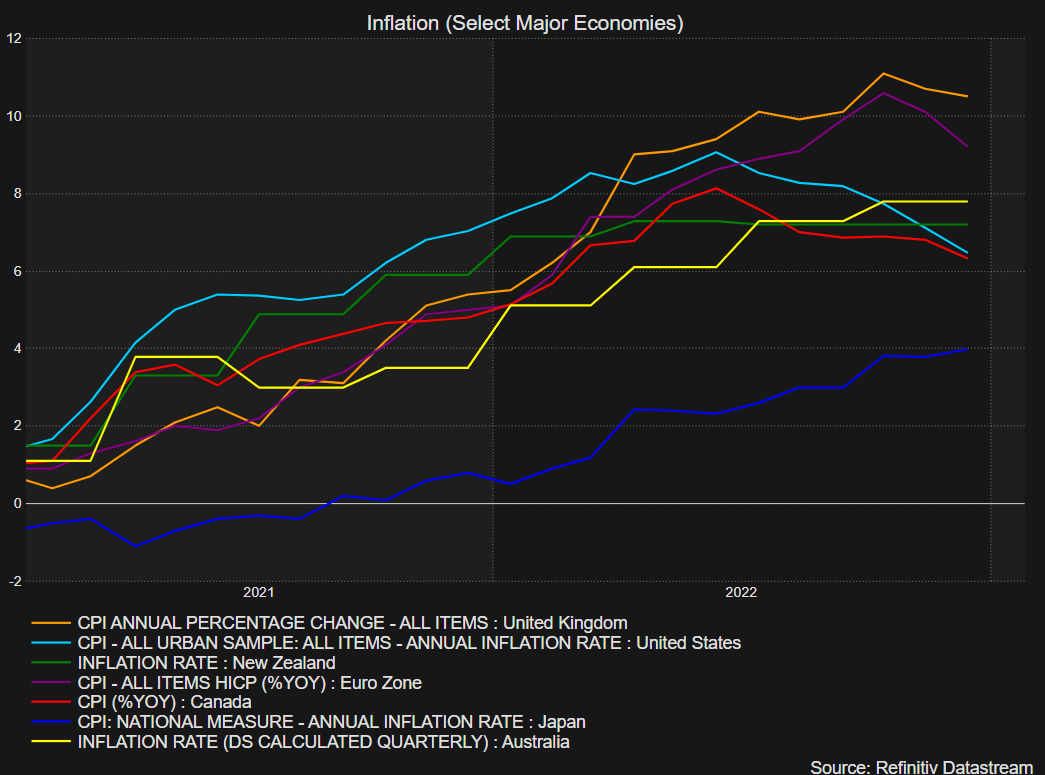
The chart below shows a trend of disinflation throughout most of the major economies (EU in purple). Headline inflation in Europe appears to have peaked, but their focus remains on core inflation now that energy prices have subsided drastically.

Global Headline CPI Trends


image4.png

Source: Refinitiv, prepared by Richard Snow


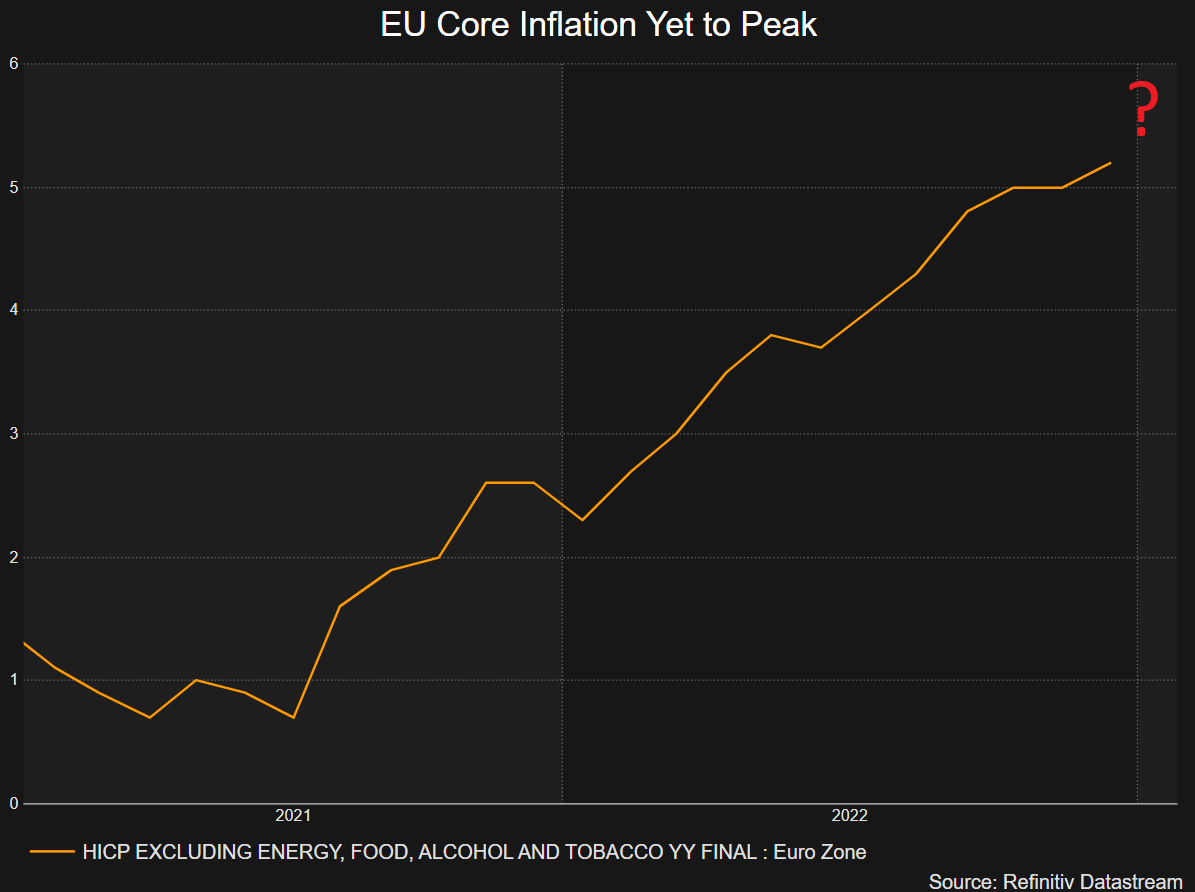
The governing council appears more united than ever judging by recent comments opting for a 50 bps hike without a single dissenter. Hotter core inflation is symptomatic of widespread inflation throughout the economy which tends to be a lot stickier. It is with this in mind that the ECB has communicated its commitment to “stay the course”, as Christine Lagarde would put it, in regard to multiple 50 bps hikes still to come.


image5.png

Source: Refinitiv, prepared by Richard Snow