Japanese Yen Gains After Strong Demand at 2-Year Treasury Auction, Where to?

Japanese Yen Gains After Strong Demand at 2-Year Treasury Auction, Where to?

Asia-Pacific Market Briefing – Japanese Yen Gains as Treasury Yields Fall

The Japanese Yen gained against the US Dollar on Wednesday, capitalizing on broad weakness in the Greenback. Notwithstanding small recent changes from the Bank of Japan towards policy normalization, the BoJ remains the most dovish developed central bank. As such, the Yen often finds itself being sensitive to external developments, particularly from the United States.

USD/JPY’s drop coincided with the 2-year Treasury yield falling about 2 percent on Wednesday. The latest 2-year Treasury auction revealed that the bid-to-cover ratio jumped to 2.94 from 2.71. This is a gauge of demand. It was the highest since April 2020. It seems participants might be eager to lock in a high rate in anticipation of a future decline in yields. Such an outcome could be caused by a recession.

The auction also occurred before key US economic data comes out later today. At 13:30 GMT, the first estimate of fourth-quarter GDP will cross the wires. The US economy is seen growing 2.6% q/q, slower from 3.2% in Q3. A softer outcome could further boost beds of Federal Reserve rate cuts later this year. A subsequent drop in US bond yields would thus likely push USD/JPY lower.

Focusing on Thursday’s Asia-Pacific trading session, the economic docket is fairly quiet. As such, the focus for traders will likely be on risk appetite. Wednesday’s Wall Street trading session saw the Dow Jones, S&P 500 and Nasdaq 100 finish mostly flat. As such, this may leave markets consolidating until key US GDP data comes out later.

Japanese Yen Technical Analysis

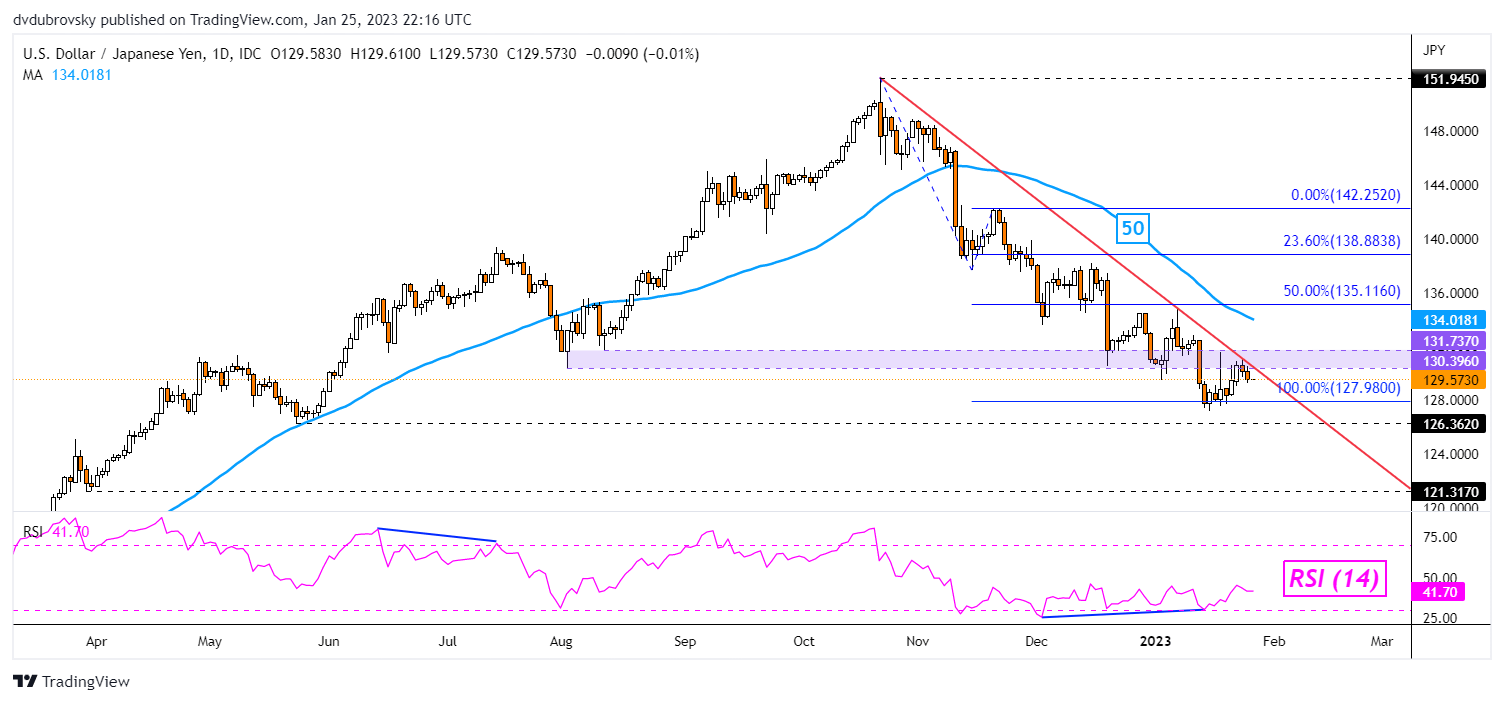
On the daily chart, USD/JPY appears to be turning lower after prices once again tested the key falling trendline from October. Further losses would place the focus on the 100% Fibonacci extension level at 127.98. Keep a close eye on RSI. Positive divergence may emerge, continuing to show that downside momentum is fading. The latter can at times carry bearish underpinnings.

USD/JPY Daily Chart

USD/JPY Daily Chart


Crude Oil Update: Steady Brent Looks to U.S. Data for Guidance

Crude Oil Update: Steady Brent Looks to U.S. Data for Guidance

Brent crude oil has been rather stagnant yesterday and today with crude oil inventories showing increases via both API and EIA reports. The more recent EIA data saw a 533Mbbls rise from the prior week keeping Brent crude prices limited. After news around OPEC+ officials expectation to keep oil production the same, upside for Brent crude seems to be hesitant ahead of next week’s meeting. Caution has stemmed from doubt centering around the Chinese re-open as well as the Russia/Ukraine conflict.

With no oil specific data scheduled today, the focal point shifts to the USD via durable goods orders and GDP for Q4. Durable goods is projected higher largely due to an influx of orders for Boeing while the less marketed initial jobless claims will be closely watched as well. The labor market in the U.S. is slowly becoming more and more important showing know signs of easing just yet therefore keeping the Fed on its toes in terms of navigating a soft landing. Should the below data come in as expected, the dollar may gain some traction leaving crude oil prices under pressure (traditionally inverse relationship).

ECONOMIC CALENDAR


image1.png

Source: DailyFX economic calendar


TECHNICAL ANALYSIS

BRENT CRUDE (LCOc1) DAILY CHART


image2.png

Chart prepared by Warren Venketas, IG

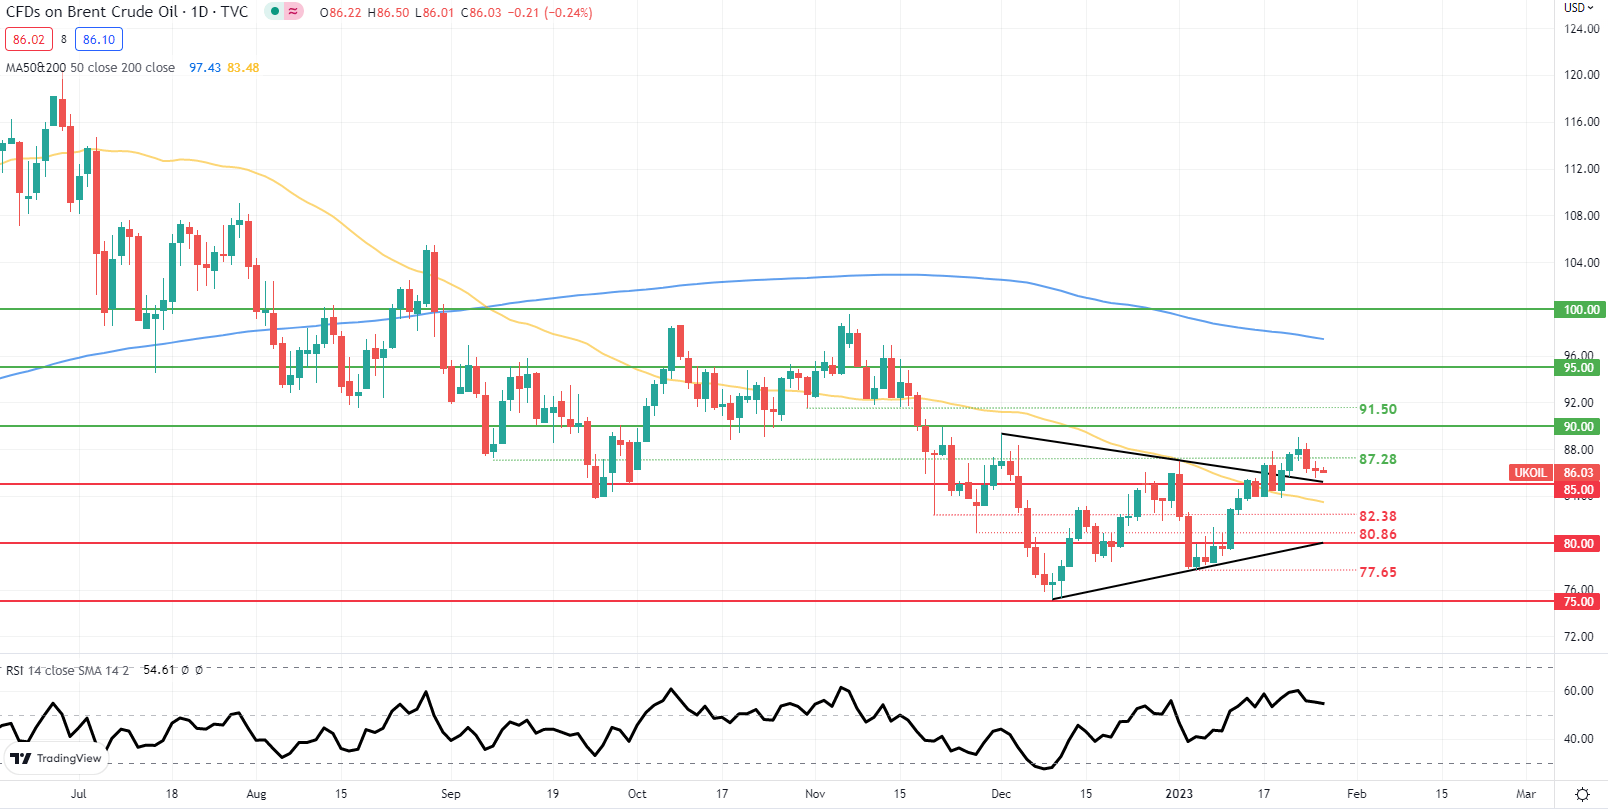
Price action on the daily Brent crude chart has not rallied post triangle breakout (black) but is taking its cues from the greenback of late. No real conviction is being exhibited by market participants and today’s economic data could provide some short-term volatility.

Key resistance levels:

  • $90.00
  • $87.28

Key support levels:

  • 50-day MA (yellow)
  • $82.38
  • $80.86
Nikkei 225 Technical Outlook: An Extended Pause

Nikkei 225 Technical Outlook: An Extended Pause

NIKKEI 225 INDEX TECHNICAL OUTLOOK – NEUTRAL

The price pattern developed in the Japan Nikkei 225 index over the past two years appears to be a pause, rather than a reversal of the multi-year uptrend.

Despite the weakness across its peers last year, the Nikkei 225 index has been resilient, which is partly a reflection of the trend developed in recent years (see monthly chart). The major double bottom (the 2003 and 2008/2009 lows) triggered in 2015 set the stage for the reversal of a multi-year bear market. The subsequent higher-tops-higher-bottom pattern on longer-term charts is a reflection of the uptrend.

Nikkei 225 Monthly Chart

image1.png


Having said that, the uptrend has been choppy, which is a reflection of an unwinding of a two-decade-long bear market. Still, the index held key support levels during the period of elevated volatility across financial markets, including the Covid selloff and the 2022 broad market weakness.

Zooming in on the weekly charts, the index has been holding above quite a strong converged cushion: the 200-week moving average and the 2018 high. There are tentative signs of some improvement in upward momentum on lower timeframe charts. In this regard, any break above the immediate hurdle on a horizontal line from early 2022 (at about 28500), slightly below the August high of 29200, could set the stage for a resumption of the long-term uptrend, initially opening the way toward the 2021 high of 30795. Any break above could pave the way toward 32000-33350, including the 78.6% retracement of the 1990-2008/2009 decline and the mid-1990 high.

Nikkei 225 Weekly Chart

image2.png

From a fundamental perspective, Japanese equities have been resilient in recent months, thanks to the ultra-easy Bank of Japan’s (BOJ) monetary policy and the weakness in the yen. Furthermore, the Japanese economy continues to recover on consumer spending. However, if the BOJ decides to hike aggressively to tackle accelerating inflation, it could hurt equities.

Australian Dollar Technical Outlook: AUD/USD Rally Gains Steam

Australian Dollar Technical Outlook: AUD/USD Rally Gains Steam

AUD/USD TECHNICAL FORECAST – BULLISH

The Australian dollar’s rally against the US dollar is gaining momentum on growing optimism over China’s reopening and rising commodity prices.

AUD/USD has been nicely guided within a rising channel since October. Earlier this month, the pair rose above key resistance on the 200-day moving average, confirming that the short-term trend remains up. This follows a hold last month above key support at the mid-November low of 0.6585 – a key support for cementing the higher-top-higher-bottom pattern,as pointed out in the previous update.

Price, Sentiment, Fundamental Snapshot


image1.png

From a big-picture perspective, AUD/USD has retraced 100% of its August-October loss – the last ‘supply’ point. In general, when a market can fully retrace the last supply point, it tends to indicate exhaustion in selling pressure or capitulation. In such instances, the path of least resistance tends to be sideways to up. In this regard, AUD/USD is now testing a significant resistance that would be vital in shaping the medium-term trajectory.

AUD/USD Weekly Chart


image2.png


As the weekly chart shows, the pair is now running into a tough resistance area: the 200-week moving average, coinciding with the 89-week moving average and the August high of 0.7135. Any break above the barrier could pave the way toward the April high of 0.7660. Importantly, it would be a building block for medium-term AUD strength.

AUD/USD Daily Chart

image3.png


Having said that, the ceiling around 0.7135 is strong, and a pause/minor retreat can’t be ruled out in the short term, especially given the US Federal Reserve interest rate decision next week. Futures are pricing in a 25 bps hike when the Fed policymakers end their two-day meeting on 1 February. Whether the Fed tones down its hawkishness is key given expectations that the US central bank will back off from its tightening. Any disappointment in this regard could lead to a brief setback in AUD/USD’s rally.

Gold and Silver Outlook: XAU/USD, XAG/USD May Rise as Retail Traders Sell

Gold and Silver Outlook: XAU/USD, XAG/USD May Rise as Retail Traders Sell

Taking a look at IG Client Sentiment (IGCS), retail traders have slightly increased their short exposure in gold and silver. IGCS tends to function as a contrarian indicator. As such, if the trend in positioning continues, there might be room for XAU/USD and XAG/USD to push higher ahead. What are key technical levels to watch?

Gold Sentiment Outlook – Bullish

The IGCS gauge shows that about 55.44% of retail traders are net-long gold. Since most traders are biased to the upside, this hints that prices may fall. But, downside exposure has increased by 2.77% and 9.63% compared to yesterday and last week, respectively. With that in mind, recent changes in positioning warn that prices may climb despite overall positioning.

Gold Sentiment Outlook - Bullish

XAU/USD Daily Chart

Gold prices are heading for a sixth consecutive week of gains. If confirmed, that would be the longest winning streak since July 2020. Prices closed above the 123.6% Fibonacci extension at 1937.82, bringing prices closer to the 1978 – 1998 resistance zone. This range was established in April 2022. Negative RSI divergence is present, showing that upside momentum is fading. That can at times precede a turn lower, exposing the 20-day Simple Moving Average (SMA).

image2.png

Silver Sentiment Outlook – Bullish

The IGCS gauge shows that about 79% of retail traders are net-long silver. Since most traders are biased to the upside, this hints that prices may fall. This is as net-short positioning increased by 1.08% and 0.27% compared to yesterday and last week, respectively. With that in mind, despite overall positioning, IGCS hints that silver may rise ahead.

 Silver Sentiment Outlook - Bullish

XAG/USD Daily Chart

Silver prices have been in a consolidative state since December. Since then, prices have failed to break above the 78.6% Fibonacci extension at 24.272 consistently. Earlier this month, a bearish Evening Star emerged – see chart below. Downside follow-through has been lackluster, undermining its presence. Key support is the 50-day SMA. A breakout under the latter could open the door to a reversal, placing the focus on the 21.968 – 22.512 inflection zone.

XAG/USD Daily Chart

What Does a Forex Spread Tell Traders?

What Does a Forex Spread Tell Traders?

What is a spread in forex trading?

Every market has a spread and so does forex. A spread is simply defined as the price difference between where a trader may purchase or sell an underlying asset. Traders that are familiar with equities will synonymously call this the Bid: Ask spread.

Below we can see an example of the forex spread being calculated for the EUR/USD. First, we will find the buy price at 1.13398 and then subtract the sell price of 1.3404. What we are left with after this process is a reading of .00006. Traders should remember that the pip value is then identified on the EUR/USD as the 4th digit after the decimal, making the final spread calculated as 0.6 pips.
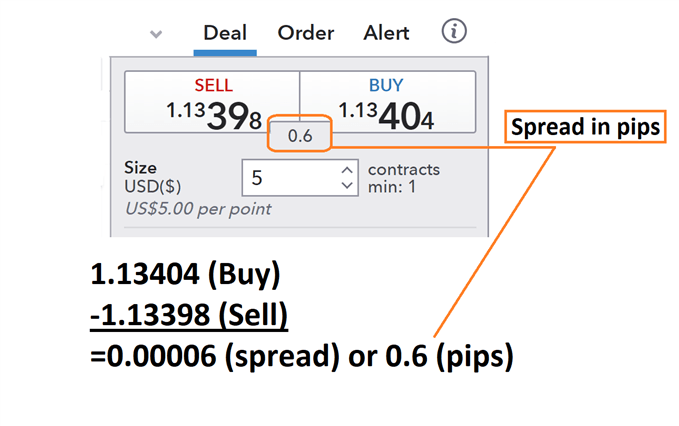
What a spread tells traders. EUR/USD spread

Now we know how to calculate the spread in pips, let’s look at the actual cost incurred by traders.

How to calculate the forex spread and costs

Before we calculate the cost of a spread, remember that the spread is just the ask price less (minus) the bid price of a currency pair. So, in our example above, 1.13404-1.13398 = 0.00006 or 0.6 pips.

Using the quotes above, we know we can currently buy the EUR/USD at 1.13404 and close the transaction at a sell price of 1.13398. That means as soon as our trade is open, a trader would incur 0.6 pips of spread.

To find the total spread cost, we will now need to multiply this value by pip cost while considering the total amount of lots traded. When trading a 10k EUR/USD lot, you would incur a total cost of 0.00006 (0.6pips) X 10,000 (10k lot) = $0.6. If you were trading a standard lot (100,000 units of currency) your spread cost would be 0.00006pips (0.6pips) X 100,000 (1 standard lot) = $6.

If your account is denominated in another currency, like GBP, you would have to convert it to US Dollars.
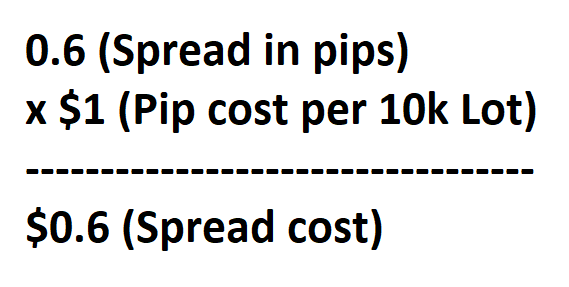
How to calculate forex spread cost

Understanding a high spread and a low spread

It’s important to note that the FX spread can vary over the course of the day, ranging between a ‘high spread’ and a ‘low spread’.

This is because the spread can be influenced by multiple factors like volatility or liquidity. You will notice that some currency pairs, like emerging market currency pairs, have a greater spread than major currency pairs. Your major currency pairs trade in higher volumes compared to emerging market currencies, and higher trade volumes tend to lead to lower spreads under normal conditions.

Additionally, it’s well known that liquidity can dry up and spreads can widen in the lead up to major news events and in between trading sessions.

High spread

A high spread means there is a large difference between the bid and the ask price. Emerging market currency pairs generally have a high spread compared to major currency pairs.

A higher than normal spread generally indicates one of two things, high volatility in the market or low liquidity due to out-of-hours trading. Before news events, or during big shock (Brexit, US Elections), spreads can widen greatly.

Low spread

A low spread means there is a small difference between the bid and the ask price. It is preferable to trade when spreads are low like during the major forex sessions. A low spread generally indicates that volatility is low and liquidity is high.

Keeping an eye on changes in the spread

News is a notorious time of market uncertainty. Releases on the economic calendar happen sporadically and depending if expectations are met or not, can cause prices to fluctuate rapidly. Just like retail traders, large liquidity providers do not know the outcome of news events prior to their release! Because of this, they look to offset some of their risk by widening spreads.

Spreads can cause margin calls

If you are currently holding a position and the spread widens dramatically, you may be stopped out of your position or receive a margin call. The only way to protect yourself during times of widening spreads is to limit the amount of leverage used in your account. It is also sometimes beneficial to hold onto a trade during times of spread-widening until the spread has narrowed.

For more tips on how to successfully navigate the forex spread, take a look at our recommended forex spread trading strategies.

 

Producer price inflation, UK: December 2022 including services, October to December 2022

Producer price inflation, UK: December 2022 including services, October to December 2022

1. Main points

  • Producer Price Index (PPI) weights for 2021 and 2022 have been corrected, which has resulted in a small number of revisions within the previously published data back to January 2021; there has been no change applied to SPPI weights, see Section 2 for more information.
  • Producer input prices rose by 16.5% in the year to December 2022, down from 18.0% in the year to November 2022, and down from 20.2% in the year to October 2022.
  • Producer output (factory gate) prices rose by 14.7% in the year to December 2022, down from 16.2% in the year to November 2022 and down from 17.5% in the year to October 2022.
  • Inputs of other parts and equipment, and petroleum products provided the largest downward contributions to the change in the annual rates of input and output inflation, respectively.
  • On a monthly basis, input prices decreased by 1.1% and output prices decreased by 0.8% in December 2022.
  • Services producer prices rose by 5.2% in the year to Quarter 4 (Oct to Dec) 2022, down from a record high of 6.2% in the year to Quarter 3 (July to Sept) 2022.

Back to table of contents

2. Correction to producer price inflation (PPI) weights

As a result of the quality assurance preparing the PPI weights data for 2023, an error was identified in the 2022 weights whereby the price index for diesel fuel had not been correctly weighted within PPI for the whole of 2022. A Producer Price Index correction notice was published after the October release detailing the revisions made to PPI data for January to October 2022.

A further review was conducted of the data mapping systems used to align all data sources to the PPI. This identified additional, smaller errors in the PPI weights for both 2021 and 2022. As a result, the PPI was suspended to allow for a full investigation and quality assurance of the production process to take place. This quality assurance has now been completed and data source checks have been extended to ensure that all data is aligned correctly and fully audited at the time of use in calculating PPI weights. These additional steps to the production process will ensure that these errors are not repeated in other areas.

The errors identified in aligning the data sources to PPI for the purpose of calculating index weights affected five product groups within input and output PPI. These are listed below:

  • products of agriculture
  • printing and reproduction services
  • fabricated metal products
  • repair and installation services of machinery and equipment
  • other transport equipment

The change in weights resulting from these corrections has been minor and this is reflected in the scale of revisions to headline input and output PPI indices (Table 1). The scale of revisions is greater within input PPI because one affected category – products of agriculture – is not included in the output PPI. While revisions affected weights back to January 2021, the revisions to annual growth rates are less than 0.1 percentage point in many periods.

Will markets return to normal in 2023?

Will markets return to normal in 2023?

Looking back to early 2022, after two extraordinary years market forecasts called for an ‘average’ year. Instead, we had a year marked by extremes, almost all bad: U.S. equities were down roughly 20%, the weakest performance since 2008, while bonds posted their worst performance in decades.

Following last year’s trauma, many investors are once again expecting a return to normal. A cursory look at how stocks perform following down years would confirm this view. However, when you look under the surface history suggests 2023 is more likely to be another year of extremes.

As most investors realize, even modest down years are relatively rare. Beginning in 1945, the S&P 500 has posted positive annual price returns more than 70% of the time. And when down years do occur, the average return the next year does trend towards average, roughly 9.5%.

A wider range of outcomes

However, on closer inspection years following down years are more interesting and less normal. While the average return following down years is in line with the long-term average, this measure conceals a good deal of variation. If anything, the years following down years tend to be either very good or very bad but rarely average.

We see this in a few ways. In a typical year, market volatility, measured by the standard deviation of returns, is around 15%. In years following negative returns, the standard deviation is closer to 25%. The difference is a function of a tendency towards a wider range of outcomes following years with negative returns.

For example, generally any negative return qualifies as a bottom quartile outcome. In contrast, in years following down years we see the cutoff for the bottom quartile at -10%. Same story for what qualifies as an exceptionally good year. The cutoff for the top quartile rises from 20% to 26%. In other words, in these years there is more of a tendency to post either particularly bad or very good returns.

Multi-year problems

While it’s easy to get into trouble confusing statistical quirks with tradeable patterns, looking through the data does suggest these return cycles are grounded in fundamentals. To the extent down years are a function of an economic soft-patch or a mild tightening cycle, markets typically stage quick and powerful reversals, as was the case in 2019.

Conversely, back-to-back negative years tend to cluster around two conditions: extreme valuation, as was the case in 2000-2002, or structurally high inflation, as was the case in the early ’70s.

It comes back to inflation

While U.S. valuations were elevated a year ago, they were nowhere near the tech-bubble peak. And following a year of brutal multiple compression, multiples are now back around the post-GFC average. This suggests that inflation will once again be the key swing factor. To the extent history is a guide, if the Federal Reserve can bring inflation down in short order, this would suggest stocks not only advance but post a particularly strong year. If the fight against inflation drags on, investors may need to brace for another year of material losses.

Hang Seng Index Technical Outlook: Strong Upward Momentum

Hang Seng Index Technical Outlook: Strong Upward Momentum

HANG SENG INDEX TECHNICAL OUTLOOK – BULLISH

Higher highs registered on the weekly charts suggests that the Hang Seng Index’s trend remains up on optimism related to China’s economic reopening.

image1.png

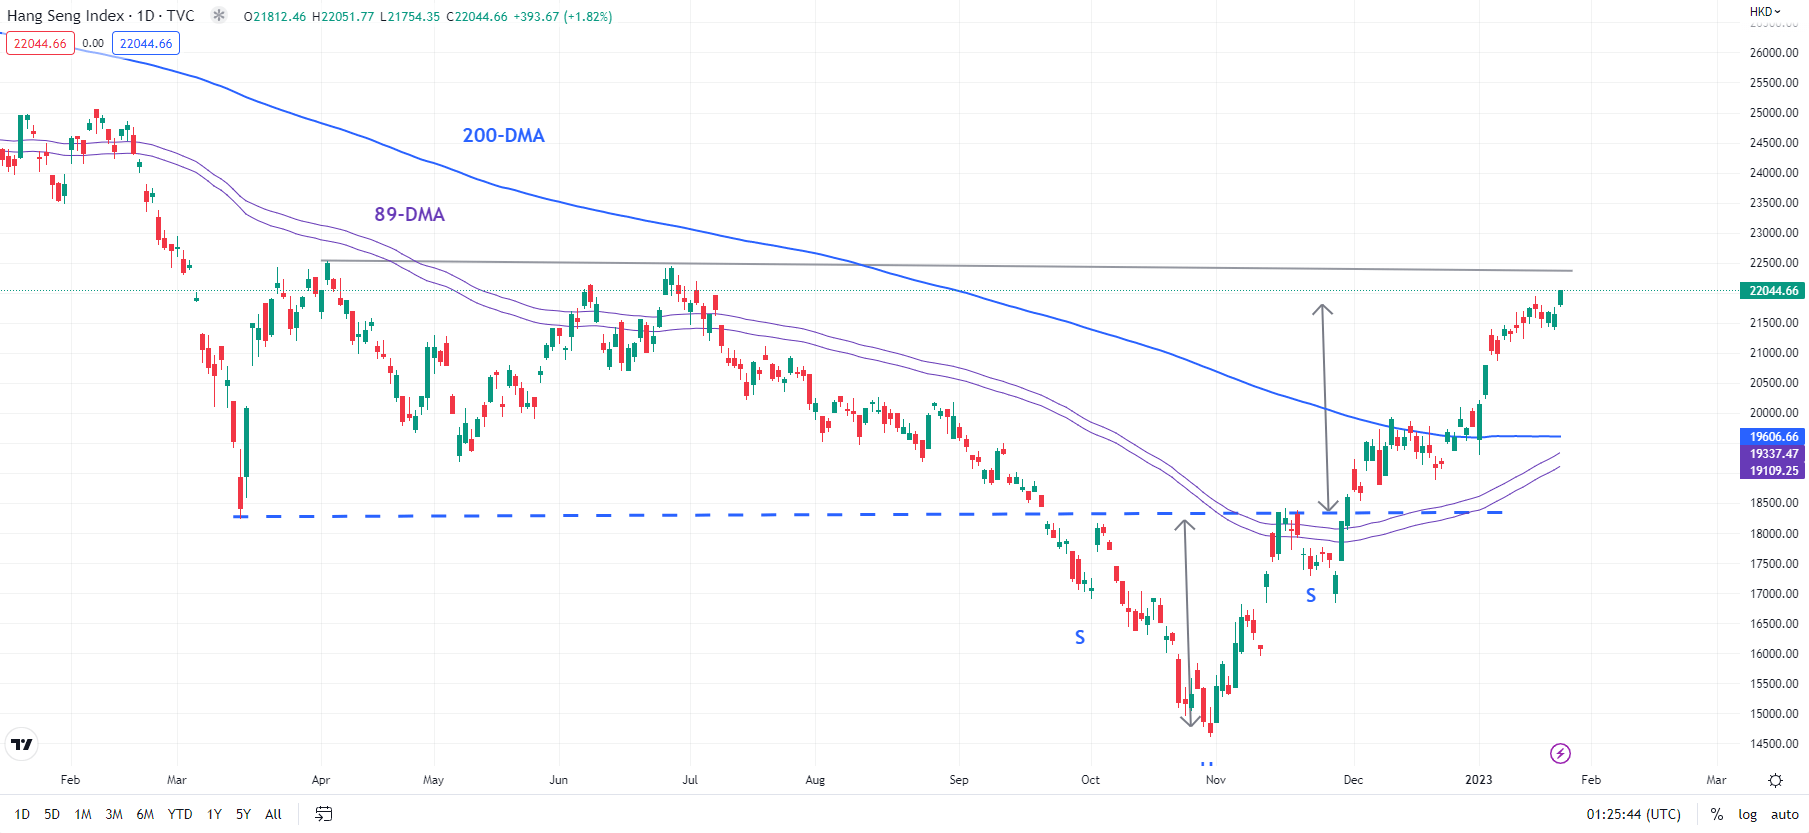
The Hang Seng Index (HSI) rose to a new six-month high last week (Hong Kong markets reopen on Thursday after the Lunar New Year holidays). This coupled with still-strong upward momentum on the daily charts (the 14-day Relative Strength Index is above 75) confirms that the short-term trend is bullish.

Hang Seng Index Daily Chart

image2.png

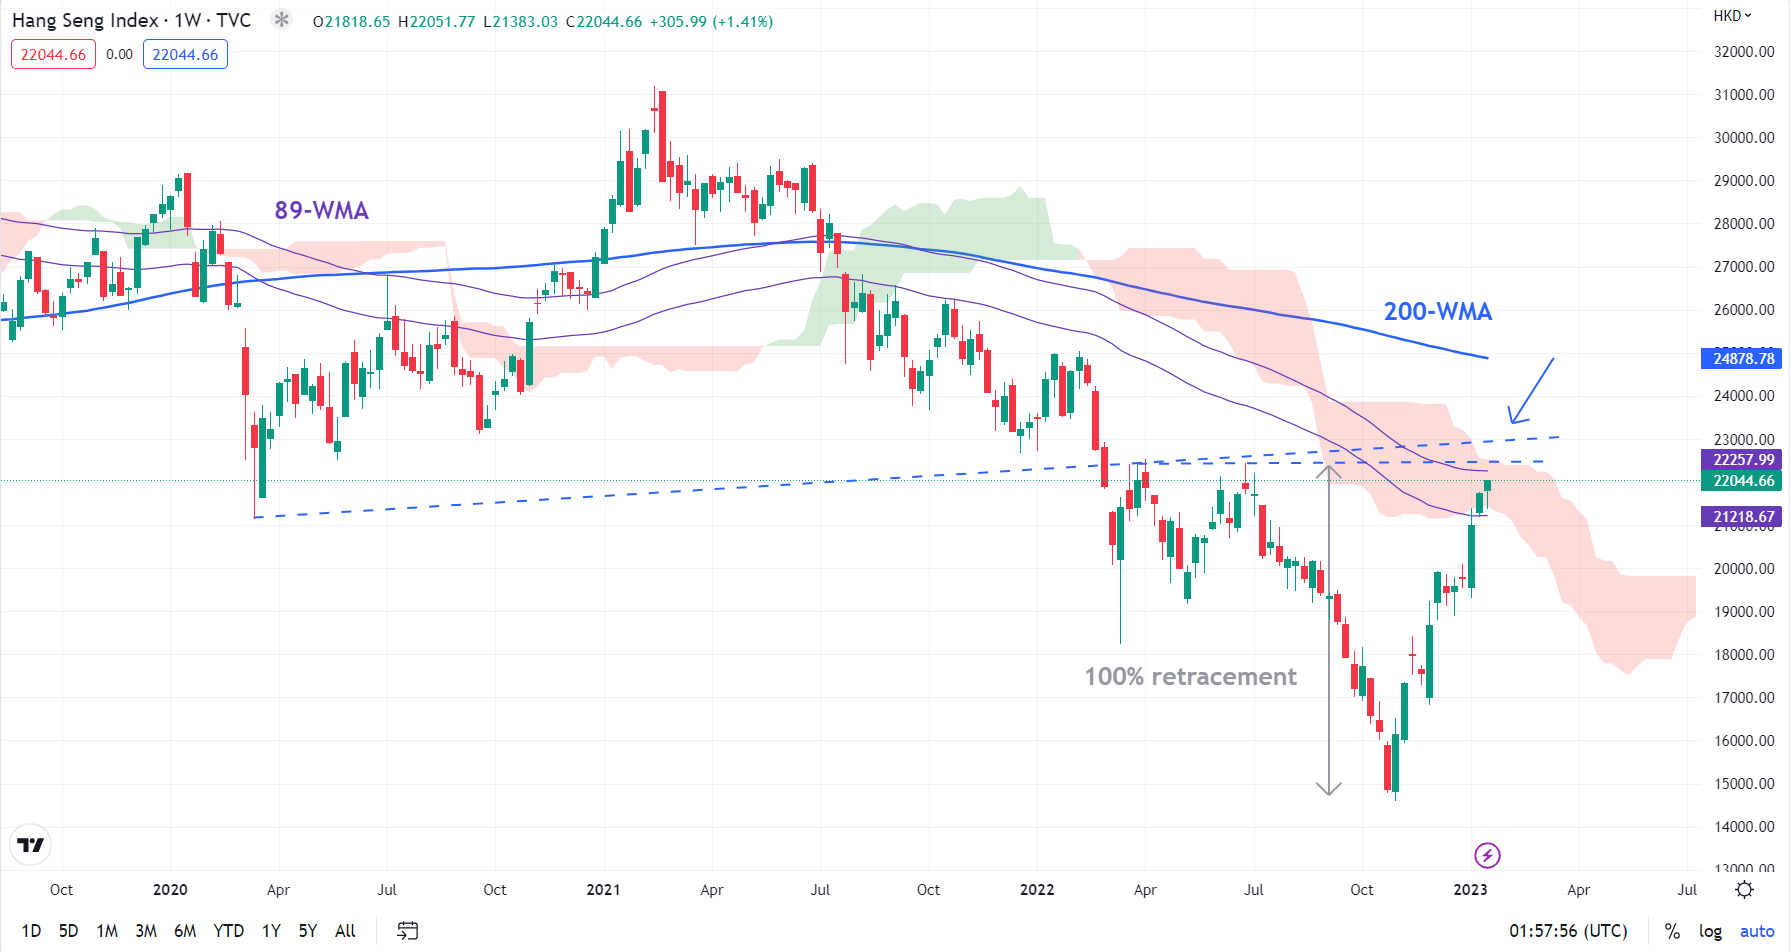
As pointed out in the previous update, the index has achieved the price objective of a reverse head & shoulders pattern triggered last month – scenario 2 highlighted in November – the break mid-December above resistance at 18415 triggered the bullish pattern (the left shoulder is the early-October low, the head is the end-October low, and the right shoulder is the November 22 low), paving the way toward 21800, the target of the pattern. The Hang Seng Index is now approaching another barrier at the April and July 2022 highs of 22450-22500. Any break above could open way toward the 200-week moving average (now at about 24875).

Hang Seng Index Weekly Chart

image3.png

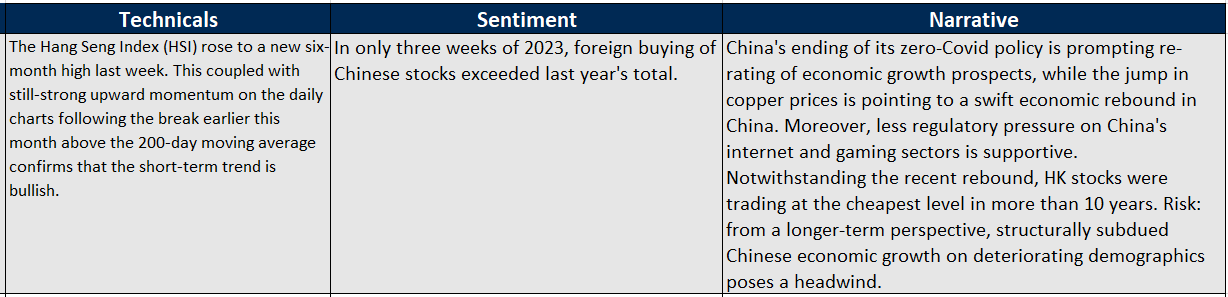
From a medium-term perspective, the strong rebound from the end of last year raises the odds that the worst could be over for HK/China stocks. The index has retraced 100% of the July-October 2022 slide – a sign that bears are getting exhausted. This is further reinforced by the surge in inflows this month as China’s ending of its zero-Covid policy is prompting re-rating of economic growth prospects (see table highlighting the broader narrative).

gold_246-768x419

Gold Holds the High Ground as US Dollar Languishes. Where to for XAU/USD?

Gold traded above US$ 1,942 overnight and continues to trade just below that level today as markets fret over the health of the US economy.

Disappointing PMI data appeared to lead to market perceptions that the Fed night is not going to be hiking as hard as previously thought. Treasury yields fell across the curve with the largest declines seen at the back end.

The lower return on offer from interest-rate products seems to have favoured the non-yield-bearing precious metal.

The Federal Open Market Committee (FOMC) meeting is Wednesday next week and a 25 basis point lift is baked in by the rates market. The proceeding commentary will be scrutinised for hints on futures rate moves and may impact the US Dollar and gold

Microsoft reported better-than-expected earnings but gave a warning on revenue from the Azure cloud business going forward and this appears to have soured market sentiment with Wall Street futures pointing to a soft start there later.

APAC equity markets that were open today have had a fairly quiet session with mainland China and Hong Kong still on holiday. South Korean indices were the exception with the Kospi and Kosdaq posting a gain of over 1% on their first day back trading after the Lunar New Year holidays.

Australia saw a sizzling CPI number today with the headline number printing at 7.8% year-on-year to the end of December, above the 7.6% anticipated and 7.3% previously.

Looking at the futures market, the odds of a 25 basis point hike at the RBA’s February meeting increased from around 50/50 to a 76% chance. AUD/USD climbed to a 5-month peak in the aftermath.

The Kiwi Dollar also got an initial boost from their CPI data that was 7.2% year-on-year for the fourth quarter rather than the 7.1% estimated. The currency then spent the rest of the day drifting lower.

Crude oil has been steady so far today after tumbling overnight on higher-than-forecast API inventory build. The WTI futures contract is near US$ 80.50 bbl while the Brent contract is around US$ 86.50 bbl at the time of going to print.

After German IFO numbers today, the Bank of Canada will be making an interest rate decision and the US will see mortgage data.

The full economic calendar can be viewed here.

GOLD TECHNICAL ANALYSIS

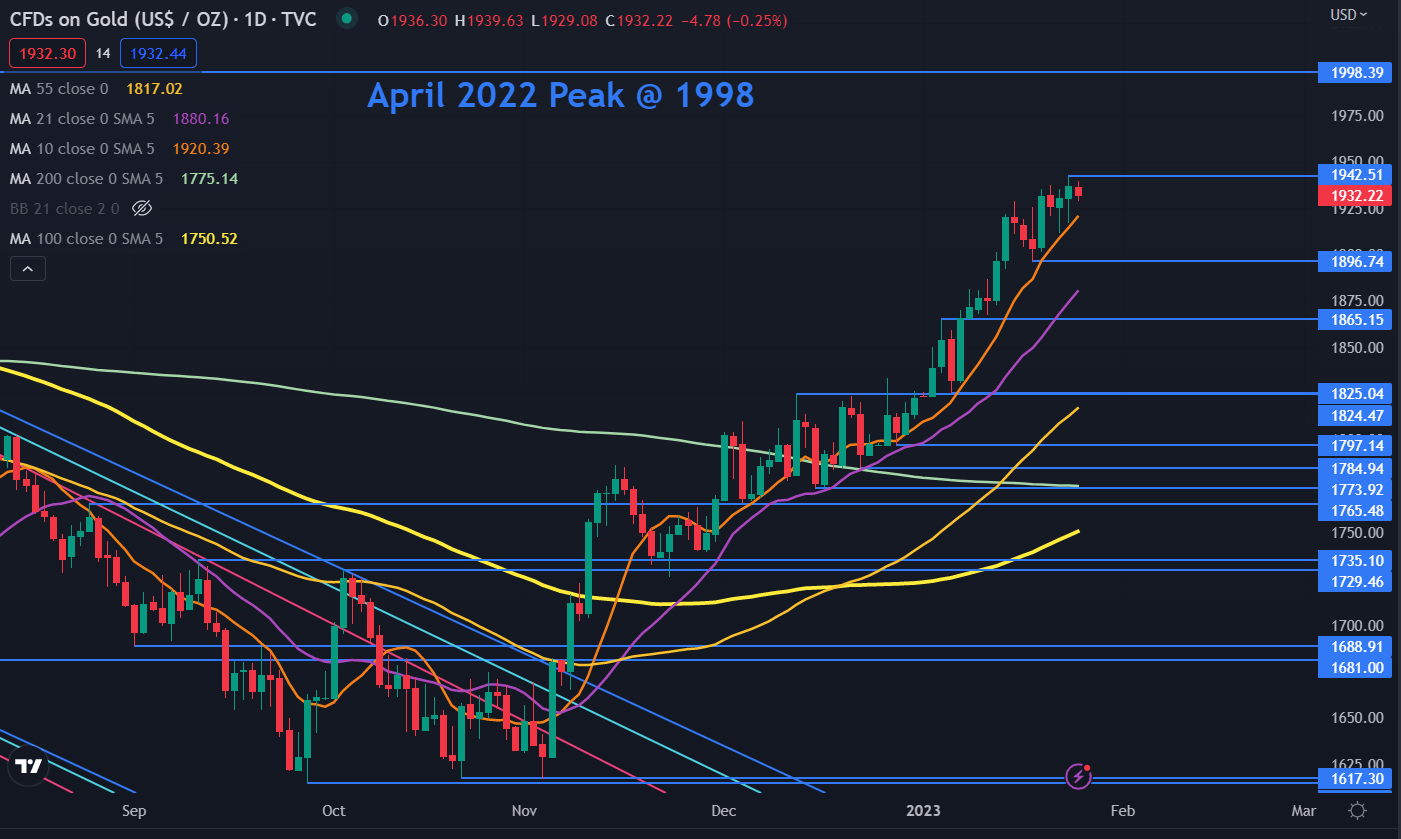
Gold is currently above all short, medium and long-term daily simple moving averages (SMA).

The gradients on the 10-, 21-, 55- and 100-day SMAs are positive but the 200-day SMA is yet to tick up. This may suggest that bullish short and medium-term momentum is evolving but long-term momentum is yet to completely acknowledge this.

Resistance might be at the recent peak of 1942 or the April 2022 high of 1998.

On the downside, support may lie at the low of 1897 or the breakpoints of 1865 and 1825.

image1.png