Food prices rose 0.3% in December while the energy index declined 4.5%, as energy and gas prices continue to drop at the pumps. The biggest contributor to the index, shelter, contributed 0.8% to the overall monthly change from November.
“The index for gasoline was by far the largest contributor to the monthly all items decrease, more than offsetting increases in shelter indexes“ – BLS
Market Response and a Case for a Fed Pause?
Positioning heading into the CPI report suggested markets expected another leg lower on the inflation front. S&P500 futures rose in anticipation while the benchmark for USD strength, the US dollar index, consolidated around the March 2020 high of 103 after a spate of heavy losses at the back of last year continuing into 2023.
For a long time now, stubbornly high US shelter data had resulted in a drag for prior inflation prints given its large weighting (32.77% of the reading) and lagging nature. More real time rent/housing data, however, points to these readings trending lower in months to come.
Towards the end of 2022, Jerome Powell highlighted US inflation ex-shelter as a better gauge of inflation.
With inflation coming down and financial conditions remaining tight, market expectations for next month’s interest rate setting meeting remain largely in favor of a 25 bps hike (77%). With core goods dropping and concerns on Wall Street about a likely recession, we may just see a change in tone form the Fed on February the 1st.
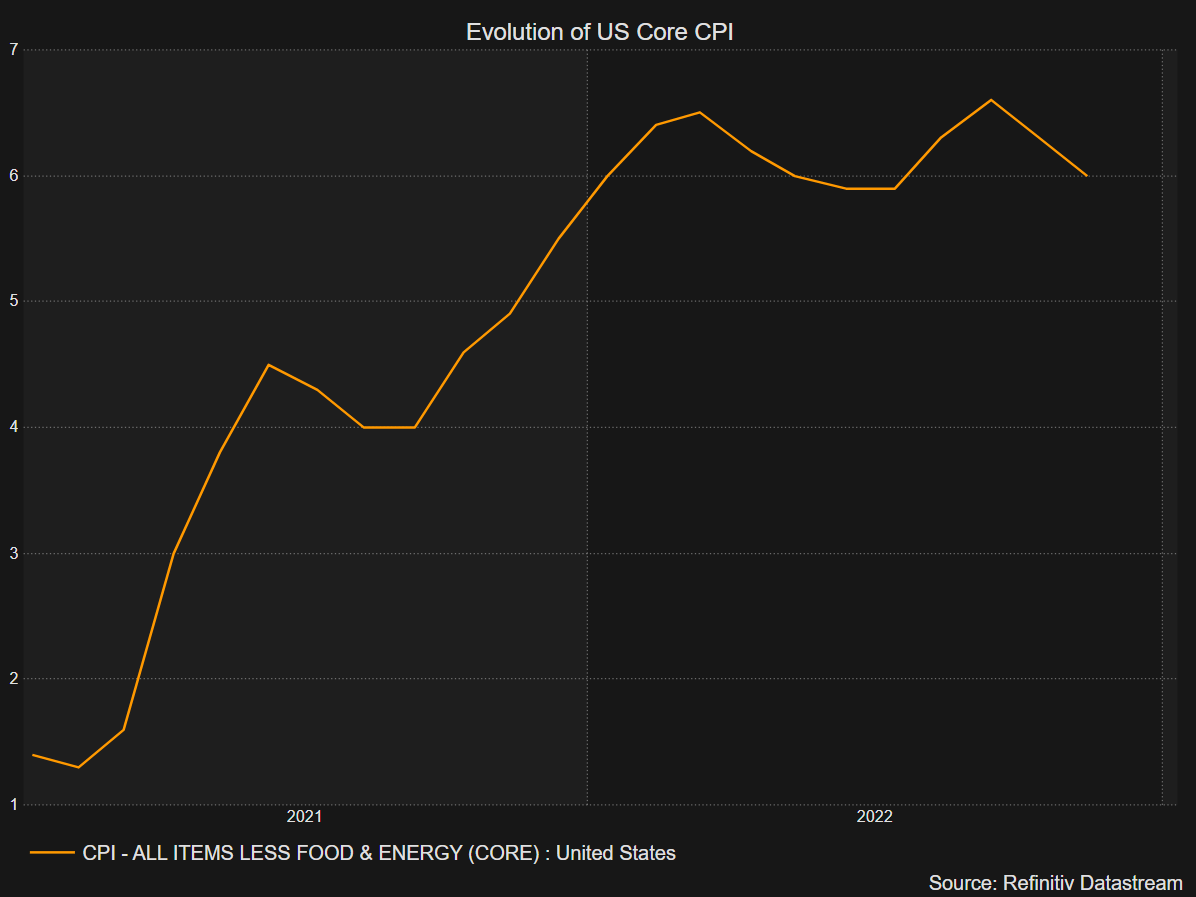
US Core CPI (Inflation Minus Volatile Food and Energy Prices)
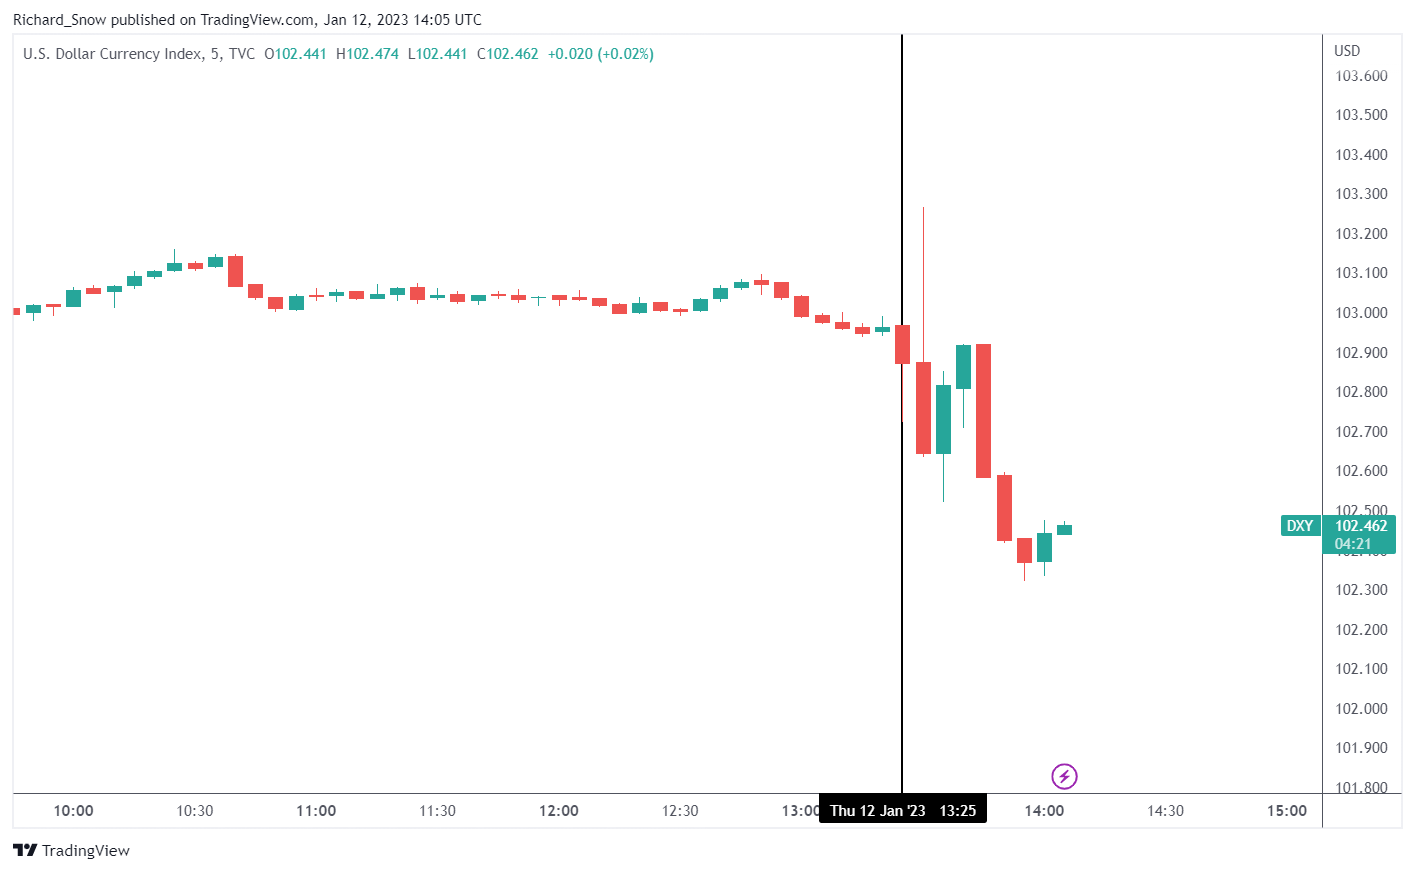
US Dollar Basket (DXY) 5 Mins Chart
The dollar witnessed an initial spike higher but proceeded to move lower in line with the recent trend of dollar selling. Higher market conviction about a Fed pause remains dollar negative in the absence of external shocks that prompt a dash for liquidity.
Source: Tradingview, prepared by Richard Snow
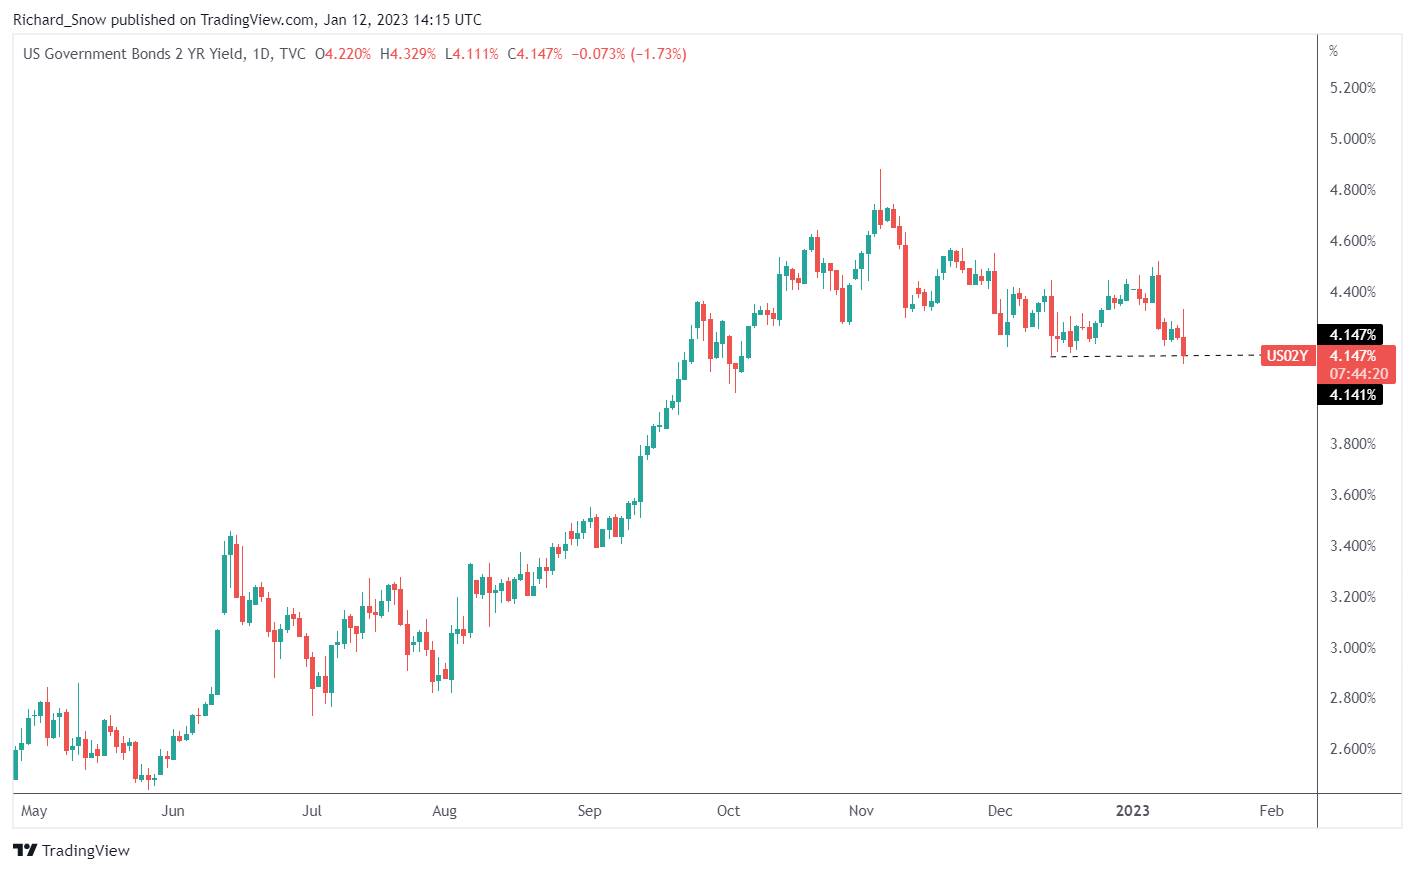
US 2 Year Yields Daily Chart
The 2 year treasury yield eased after the data. The 2 year yield most closely tracks the Fed’s medium term time frame and hence, tends to react to sudden changes in interest rate expectations. The 10 year yield trades lower too.
Source: Tradingview, prepared by Richard Snow
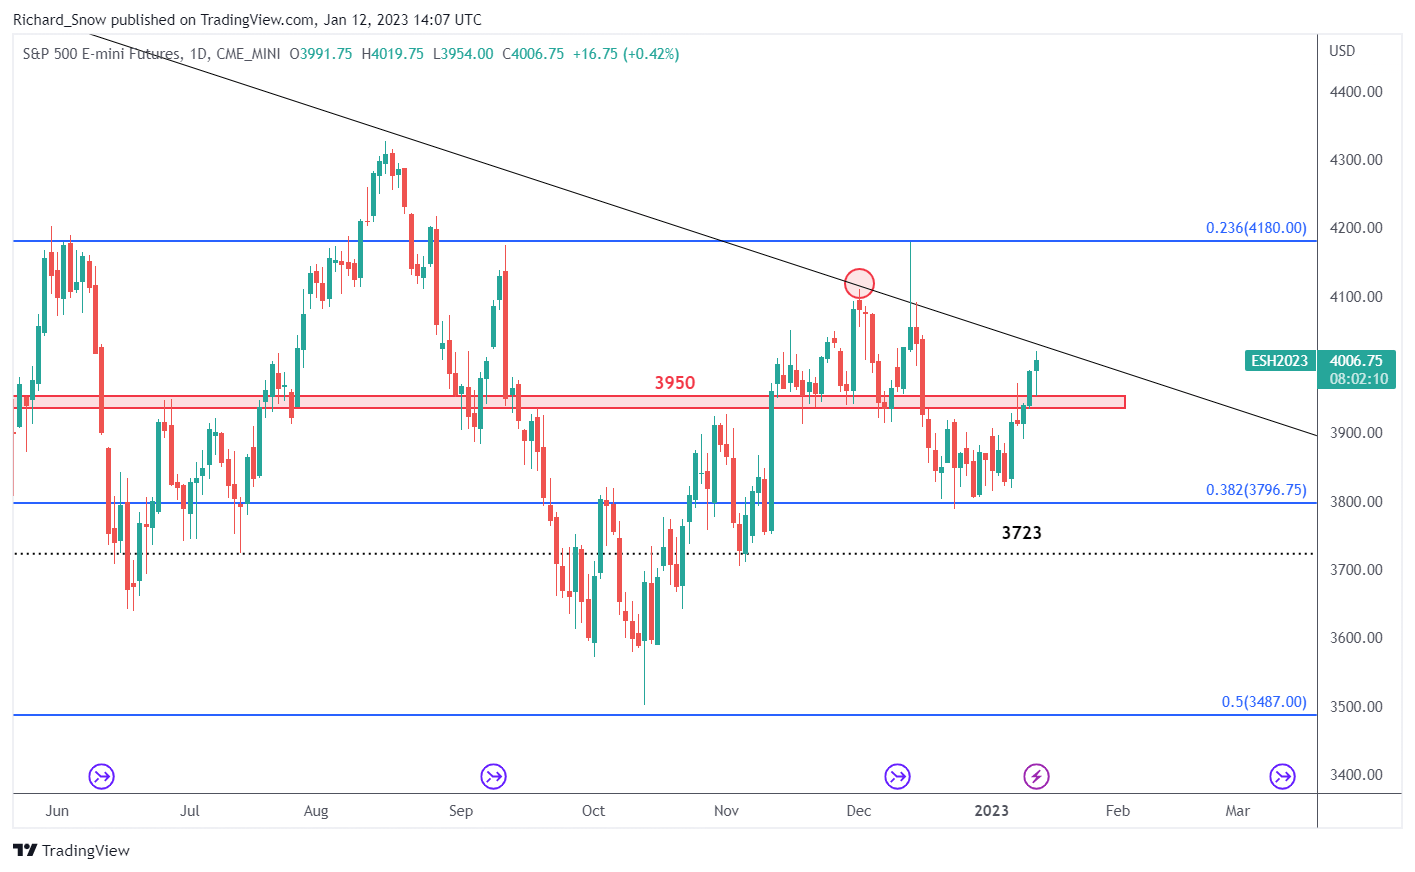
S&P500 Futures (ES1!) Daily Chart
Us equities are poised for another test of the major trendline resistance after surging past the psychologically important 4000 mark. The outlook on the index is troublesome though as recession concerns and lower expected corporate earnings are expected to roll in starting tomorrow with large US banks.
Accelerating downward momentum raises the likelihood of a further fall in USD/CNH. However, deeply oversold conditions point to a short-term pause before the resumption of the downtrend.
USD/CNH, down over 8% since October, last month fell below key support on a horizontal trendline from early October that came in at 7.01, triggering a bearish head & shoulders pattern (the left shoulder at the September high, the head at the October high, and the right shoulder at the November high), pointing to a decline toward 6.65.
USD/CNH Daily Chart
USD/CNH TECHNICAL FORECAST –BEARISH
Accelerating downward momentum raises the likelihood of a further fall in USD/CNH. However, deeply oversold conditions point to a short-term pause before the resumption of the downtrend.
USD/CNH, down over 8% since October, last month fell below key support on a horizontal trendline from early October that came in at 7.01, triggering a bearish head & shoulders pattern (the left shoulder at the September high, the head at the October high, and the right shoulder at the November high), pointing to a decline toward 6.65.
Cracks in the USD/CNH rally became evident after the pair in November failed to clear major resistance on a slightly upward-sloping channel from 2018, slightly above the 2019 high of 7.20, first highlighted in early November. The subsequent break of key support levels confirmed that the uptrend was beginning to reverse (see previous update). Extreme low readings of the 14-day Relative Strength Index (RSI) reaffirm that the trend has turned down (see Daily chart).
While the broader trend remains down, USD/CNH is looking deeply oversold, raising the chances of a short-term pause in the slide/minor rebound (see the Monthly chart). On the Weekly chart, USD/CNH is approaching quite strong support on the 89-week moving average and the 200-week moving average. Previous corrections in recent years have been truncated around the 89-week moving average, and instances, where the moving average was broken, were followed by major trend reversals.
USD/CNH Weekly Chart
Cracks in the USD/CNH rally became evident after the pair in November failed to clear major resistance on a slightly upward-sloping channel from 2018, slightly above the 2019 high of 7.20, first highlighted in early November. The subsequent break of key support levels confirmed that the uptrend was beginning to reverse (see previous update). Extreme low readings of the 14-day Relative Strength Index (RSI) reaffirm that the trend has turned down (see Daily chart).
USD/CNH Monthly Chart
While the broader trend remains down, USD/CNH is looking deeply oversold, raising the chances of a short-term pause in the slide/minor rebound (see the Monthly chart). On the Weekly chart, USD/CNH is approaching quite strong support on the 89-week moving average and the 200-week moving average. Previous corrections in recent years have been truncated around the 89-week moving average, and instances, where the moving average was broken, were followed by major trend reversals.
When the Federal Reserve adjusts its monetary policy stance by either raising or lowering borrowing costs, the investment landscape changes, becoming more friendly or more hostile to the equity market. In this article, we will discuss how valuations and performance of value and growth stocks tend to be affected by rising and falling interest rates, but before we get to that, some context and definitions need to be established.
GROWTH STOCKS
Growth companies are often unprofitable and have speculative prospects, but investors are willing to pay a premium to own them because they have an innovative business/product that has the potential to deliver above-average returns over a long-term horizon, although there are no guarantees. They are riskier and therefore more volatile than the market in general, but their share prices usually rise faster than typical stocks because of their strong earnings growth outlook. Often, these high-flyers focus on increasing future revenue at the expense of delaying profitability, reinvesting their earnings into product research and expansion, so they do not frequently distribute capital to shareholders through dividends or buybacks.
VALUE STOCKS
Value stocks sit on the opposite spectrum. These are mature companies with a well-established business, solid balance sheets, proven history of financial performance and steadier but low growth over time. Despite their high quality and solid fundamentals, they have fallen out of favor and lost their “WOW” factor, so they trade a discount to the market and appeared undervalued based on various financial metrics such as price/earnings, price/book, cash flows, etc. Value companies typically pay dividends, offer lower volatility, and carry less risk than the market, but their share prices rarely experience explosive upward movements similar to those seen in the growth universe.
It is clear from the above introduction that different stocks have different characteristics; they are not created equal, so they will be affected by changes in monetary policy in dissimilar ways, but to try to gauge the possible impact, it is first necessary to understand a little about valuations. Very simplistically, the value of a company can be thought of as the present value of expected earnings.
By buying Apple’s shares, for example, a long-term investor has acquired an ownership claim in the company’s profits over time. To assign an intrinsic value to the perpetual cash flows associated with the business’ operations, analysts first forecast earnings growth and then discount the sum of the projected income stream to today’s dollars using a discount rate, usually a risk-free rate such as the 10-year U.S. Treasury yield. This is where interest rates play a huge role in equity investing.
CONCLUSIONS
The tables above show that higher discount rates produce lower equity values, but the effects vary across investment styles. In general, however, growth companies will be more sensitive to rising interest rates because of the nature and path of their cash flows: little in their early stages, large later in their life cycle.
Going back to the two hypothetical examples, growth company ZZZ lost 21.3% of its value when the discount rate used went from 0.25% to 3.0%. In real life, the less attractive valuation will likely coincide with a steep drop in the company’s stock price. Company XYZ was also affected by the change in the rate environment, but its present worth only fell by 14.3%, suggesting that companies with value characteristics may fare better when monetary policy becomes more restrictive.
Focusing on real life examples, the charts below are composed of two panels. The upper panel shows the ratio between IWD (iShares Russell 1000 Value) and IWF (iShares Russell 1000 Growth), and the lower panel displays the U.S. 10-year yield by itself.
Chart 1 is from January 2020 to May 2020. During this period, when the 10-year yield dropped from about 1.89% to 0.66%, the IWD/IWF ratio declined roughly 19%, pointing to strong growth outperformance.
CHART 1 – IWD/IWF RATIO VS US 10-YEAR YIELD (JANUARY 2020-MAY 2020)
CHART 2 – IWD/IWF RATIO VS US 10-YEAR YIELD (JANUARY 2022-MAY 2022)
A range of financial markets remain risk-on ahead of the latest US inflation report which is expected to show price pressures turning further lower. This bullish market outlook remains at odds with the Federal Reserve’s ongoing rhetoric that rates will need to stay higher for longer to quell runaway inflation. While the US central bank sees the terminal Fed Funds rate around 5.1%, suggesting at least another 75 basis points of rate hikes, the market is pricing in 50 basis points of future hikes (2x25bps) before the Fed stops tightening monetary policy. The recent US dollar weakness suggests that the markets are not only questioning the Fed’s outlook, but they are also starting to ignore it. According to the latest CME FedWatch Tool, there is currently a 79% probability of a 25bp rate hike at the next FOMC meeting.
The risk going into today’s data release is that markets have become overly optimistic that inflation will fall by more than expected. Any disappointment today will leave a range of risk markets vulnerable to a sharp move lower, while inline numbers will leave further upside limited.
For all market-moving data releases and economic events see the real-time DailyFX Calendar.
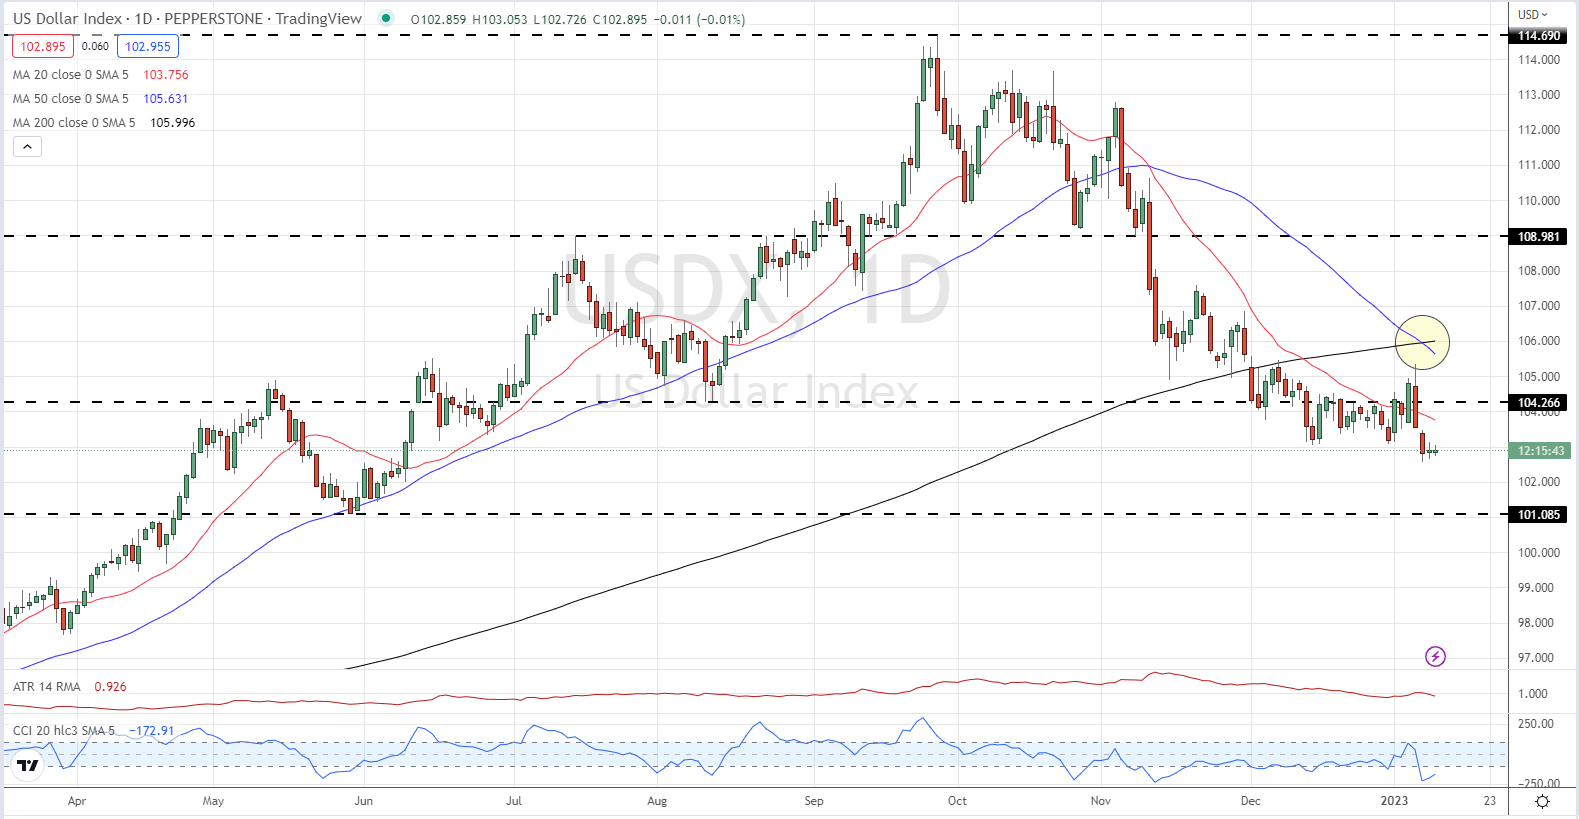
While the short-term risk of a USD rebound is in play, the longer-term technical outlook for the greenback remains pointed to the downside. The US dollar index (DXY) is just a handful of pips above making a fresh multi-month low, while the current price is now below all three moving averages, a bearish technical backdrop. Add into the mix the recent 50-day/200-day ‘death cross’, and little technical support ahead of the May 30 swing-low at 100.96, and the longer-term US dollar outlook remains bearish.
US Dollar (DXY) Daily Price Chart – January 12, 2023
After lackluster trading over the past few weeks, Bitcoin appears to be gaining some traction. However, it would be too soon to conclude that the tide has changed for cryptocurrencies.
BTC/USD has traded within a narrow range since mid-December, holding around crucial support at the December 7 low of 16690, highlighted in the previous update. The hold above the support keeps alive the view of a broader base-building in cryptocurrencies, that is, scenario 1 pointed out in mid-November. Having said that, the hold above a support area wouldn’t necessarily imply bullishness. That’s because BTC/USD has seen similar bouts of strength in recent months which weren’t sustained.
In particular, the 89-day moving average has been a significant barrier since mid-2022, coinciding with another ceiling at the mid-December high of 18370. Until the barrier is cleared, the path of least resistance remains sideways to down for BTC/USD. A decisive break above could pave the way initially toward the 200-day moving average, potentially toward the 5 November high of 21470.
On the downside, 16200-16700 continues to be a strong cushion. Any break below would confirm that the upward pressure had faded, raising the odds of a broad range of 15500-18500 developing in the interim. Furthermore, a decisive break below the November low of 15480 could pave the way toward the 2019 high of 13895.
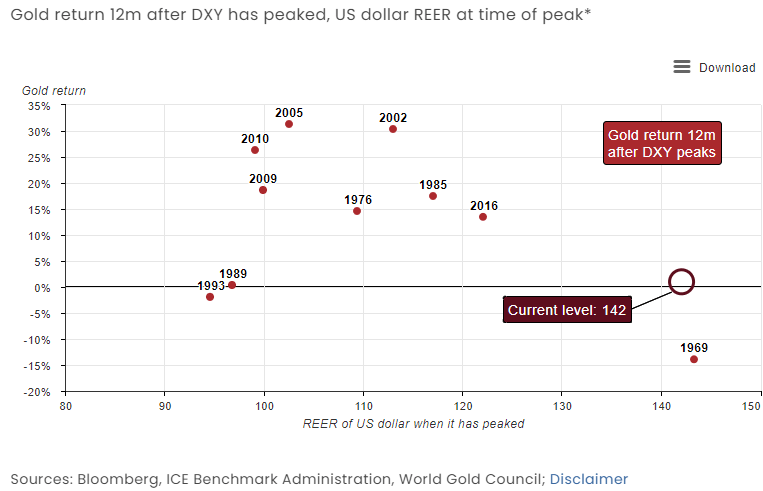
A recent report from the World Gold Council highlighted a weaker US dollar and heavy central bank buying of gold as drivers behind the recent move higher in the precious metal. Their 2023 Gold Outlook also highlighted how gold performs well during a recession with the precious metal ‘delivering positive returns in five out of the last seven recessions’. The report also emphasized gold’s positive performance 12 months after the US dollar (DXY) peaked, something that occurred in late September last year.
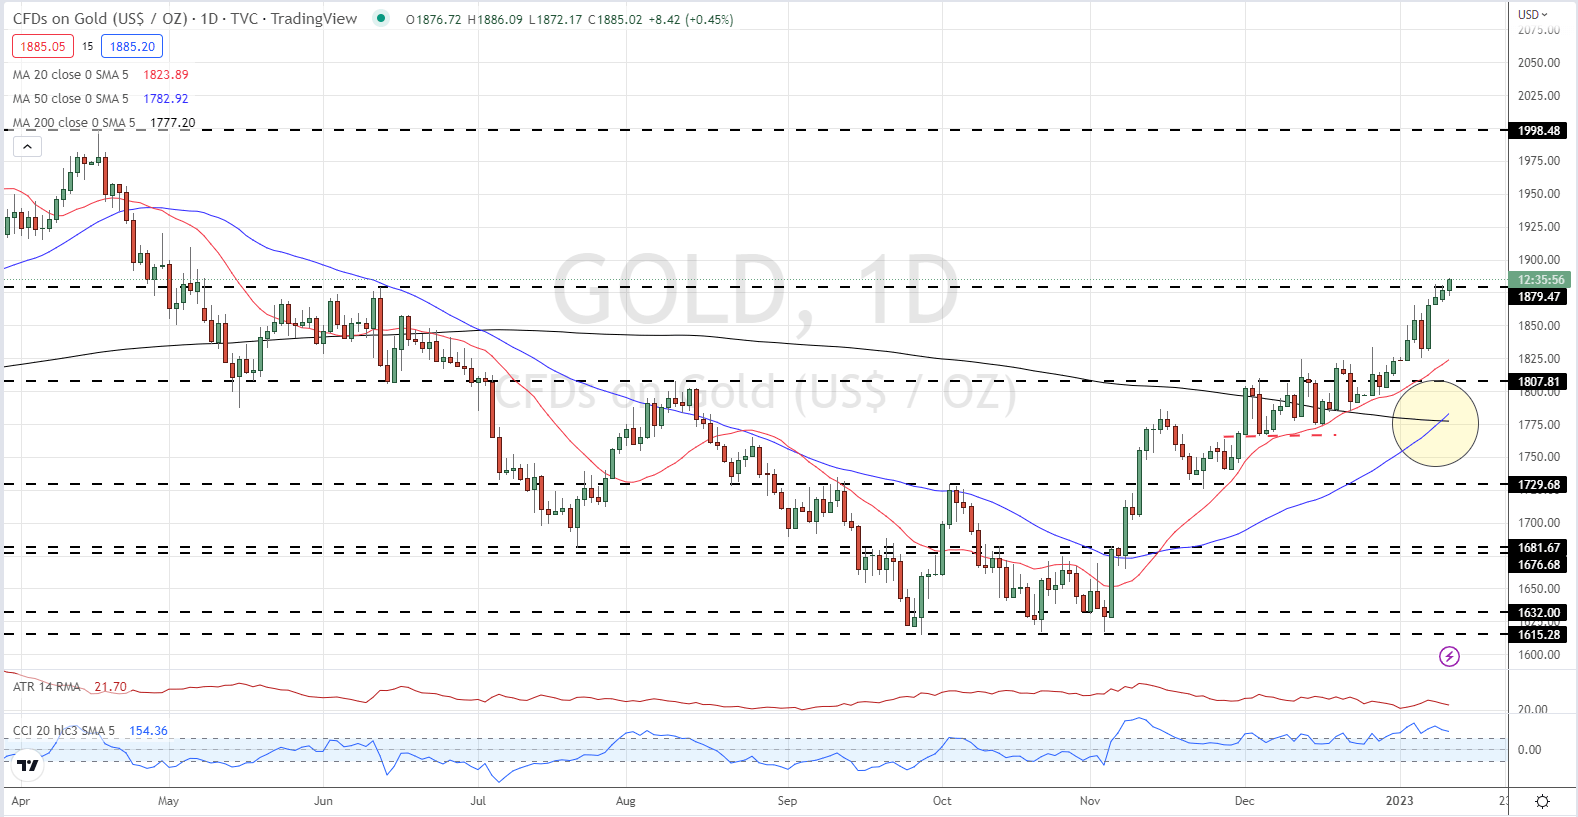
The daily gold chart remains positive and suggests further gains ahead. The multi-month level of resistance around $1,880/oz. has been broken, but not convincingly yet, while the recent formation of a ‘golden cross’ will boost bullish sentiment. Looking ahead, the next level of psychological resistance at $1,900/oz. will offer little in the way of a barrier for gold, leaving gold bulls looking at just under $2,000/oz. as their longer-term target.
Gold Daily Price Chart – January 11, 2023
The latest US inflation data is released on Thursday and this report will be the driver of price action in the short term. Any beat or miss from the current market forecast will steer gold going into the weekend.
If the metal really is what so many of its adherents believe it to be, then these should be some of the best days it has seen for years. After all, inflation has re-awakened across the globe. And that after decades of such obliging docility that a whole trading generation won’t have encountered price rises of current magnitude in their lives. Inured to a world in which even 2% inflation targets often proved elusive, 2022 has provided hard lessons.
And yet gold’s downtrend remains very much in place.
You don’t have to look very far to see need for a haven asset either. Russia’s invasion of Ukraine has crippled a European economy still utterly reliant on Putin’s regime for its energy needs. Tensions between China and the US threaten the last thirty years of largely peaceful globalization, to the point where many commentators are prepared to call it over. Covid has of course played its baleful part too, stunting global growth and, again, forcing a rethink of supply chains. Resilience is now prioritized where once price held sway. China’s neighbours increasingly eye its ambitions toward Taiwan with concern. Military budgets are rising across the region.
And still gold continues to weaken.
In truth the metal has spent much of the time since March behaving rather more like a classic ‘risk asset’ than any sort of haven.
Stock markets and gold have been falling more or less together since March, which looks counterintuitive if the latter really is any sort of effective haven or inflation hedge.
Clearly, as can be seen on the chart above, prices do rise when disaster strikes or inflation rises. But it’s also clear that such gains have been short lived, and that neither has come close to breaking the prevailing downtrend. Gold is Inflation-Sensitive, But Interest Rates Dominate
In truth gold is responsive to inflation, but really via the transmission channel of interest rate expectations.
The metal famously offers nothing beyond the prospect of price rises or, perhaps, capital preservation. There’s no yield on offer to the gold holder, no dividend. No perks of any kind, really. So, the years of historically low interest rates seen across the world and especially in the US since 2009 have flattered the asset. When yields are generally low, or even negative, the opportunity cost of holding onto a non-yielding asset shrinks too.
Now matters have gone into reverse. With interest rates rising sharply around the world, the appeal of non-yielding gold is fading.
In truth, the most powerful influence on the price of gold is the expected path of interest rates, especially in real terms. The lower the expected real rate goes, the greater is the appeal of an asset that yields nothing. Once they start to rise, gold looks short of good points.
There is possibly a caveat or two to add here. Gold’s fortunes may yet revive if the considerable firepower currently deployed by central banks in the inflation fight starts to look ineffective. The US Federal Reserve seems to be having some success in bringing prices to heel, but it’s certainly far too early for much optimism. Other monetary authorities are yet to ramp up their efforts, and it’s far from clear how successful they will be. Don’t forget that we’ve not seen inflation targeting tested in quite this manner before. In the recent past interest rate rises have been modest and quite pain-free for central banks. They’re not anymore. Increases in borrowing costs will mean real pain for businesses and consumers.
Moreover, in the increasingly uncertain economic and political environment we’re all getting used to, it’s hard to see precious metals being entirely evicted from portfolio recommendations. In hard times diversification is usually the watchword. The global environment might well become more supportive too. India may not have the world’s largest official holdings, but it has long been the country with the most gold within its national territory. In short, 1.4 billion people who have a long tradition of holding physical gold are getting richer. That may not see gold prices surge, but it’s bound to add some long-term support. Indeed, physical gold ownership is offered by retail banks across Asia in a way that would seem quite unfamiliar for most in the West.
But to participate in the gold market, it’s important to distinguish between investing in the metal and trading its shorter-term price moves.
If gold is viewed as some sort of defense against what we might call ultimate macro shocks, threats to the entire monetary system and fiat currency itself, then it seems illogical to hold it in any sense other than the physical. Gold products, exchange-traded funds and so on, make very little sense on this score, offering returns in the very fiat currencies which would supposedly be on the ropes should those macro shocks appear.
Trading price moves can of course be done via any method, but those keen to participate would be well-served to remember that what will matter over time are those interest-rate expectations even if the ‘haven’ or ‘inflation hedge’ impulses will clearly be seen to move the market from time to time.
As we’ve seen this year on a few occasions, those impulses fade before the interest-rate fundamentals, which seem to always reassert themselves.
WTI crude oil is coming under pressure this Tuesday morning ahead of the European session on the back of a stronger U.S. dollar. The dollar upside grew from yesterday’s Fed speakers including the Fed’s Bostic and Daly who reinforced their outlook for the U.S. central bank to raise interest rates to 5% and beyond after which they expect a hold before tapering off. Fed funds futures have shown a lack of conviction for this +5% mark as of yet with the terminal priced in at 4.953% currently. It will be interesting to see whether last week’s decline in wage pressures from the Non-Farm Payroll (NFP) report will translate over to the upcoming U.S. CPI release which could then cement a 25bps rate hike for February leaving the dollar vulnerable to further downside. From a crude oil perspective, a weaker dollar may give WTI crude the impetus it needs to push above the $75 per barrel mark once more.
FEDERAL RESERVE INTEREST RATE PROBABILITIES
The economic calendar (see below) for today is relatively light but should provide some volatility around Fed Chair Jerome Powell’s speech. The focus will be on whether or not he supports the views of the Fed’s Daly and Bostic which may leave crude oil on the backfoot. The trading day for crude oil will close off via the API crude oil stock change figure which has been increasing since mid-December 2022. Another push higher could leave WTI lagging.
Chinese imports of crude oil have also been reported to rise but has not followed through to crude oil pricing at this point however, Chinese re-opening optimism is still a critical factor for crude oil prices and until such time as more clarity around fiscal stimulus and COVID concerns are gained, crude may remain relatively subdued.
Economic activity in the services sector contracted in December for the first time since May 2020, according to the Institute for Supply Management, suggesting that recessionary pressures are building in the US. The report, released last Friday, showed the headline figure fall to 49.6 from a prior 56.5, while business activity fell by 10 points to 54.7. The numbers suggest the US economy is heading for, or may even be in, a recession in the early part of 2023.
image1.png
Friday’s weaker-than-expected ISM data, and lower average hourly wage growth seen in the latest US Jobs Report, hit the US dollar hard. The greenback just failed to make a fresh multi-month low but remains weak with little short-term support seen on the daily chart. US Dollar Currency Index – January 9, 2023
image2.png
The US dollar sell-off is noticeable in a wide range of US pairs including cable (GBP/USD). The pair has rallied from a Friday low around 1.1850 to a current level of 1.2160 with Sterling in the passenger seat while the greenback drives the move. The British Pound is trying to move higher in itself today but the economic backdrop remains neutral to negative as the UK government struggles to control a raft of strikes currently hitting the country. The UK now needs to solve the current wave of industrial action otherwise the current small bid in Sterling will quickly evaporate.
After Friday’s US dollar sell-off, cable is now back above all three moving averages and a confirmation of this move in the next couple of days may well set the pair up for another leg higher. With little in the way of UK economic news until the end of the week, it looks likely that the US dollar will continue to be in charge of cable. GBP/USD Daily Price Chart – January 9, 2023
Crude oil held onto overnight gains today as the fallout from yesterday’s surprise move by the Bank of Japan continues to reverberate throughout markets.
US crude inventories decreased by 3.1 million barrels last week according to data from the American Petroleum Institute (API).
This was well below the slight decline that was anticipated. Oil traders will now look to today’s Energy Information Administration (EIA) stockpile figures for clarity on the situation.
OPEC also weighed in yesterday by saying that they will remain proactive and pre-emptive.
Further delays to the re-opening of the Keystone pipeline have also been announced. The connection links the Canadian oil fields to the US gulf coast.
The WTI futures contract is above US$ 76 bbl while the Brent contract is near US$ 80 bbl at the time of going to print.
Japan is a major energy importer and the surge in the Yen this week may assist their capacity to shore up supplies as they head into their winter.
Yesterday’s volatility in the Asian session has been replaced by relatively sedate price action across most markets so far today. The implications of the Bank of Japan’s decision are yet to be fully digested.
Wall Street managed to eke out some small gains that fed into a mixed APAC equity session. Australia’s ASX 200 found firmer footing while Japan’s Nikkei 225 slipped again. The rest of the region was mostly flat.
Swimming against the tide in Japan is the bank and insurer stocks. These entities could gain from a higher interest rate environment.
Speculation is growing that the BoJ might move out of the negative interest rate policy (NIRP) stance. Further tightening by another major central bank may impact global growth.
Treasuries have added a couple of basis points across the curve today, adding to the large gains seen yesterday, particularly at the back end of the curve.
Currencies markets have settled down somewhat, except for the New Zealand Dollar. It is notably lower while the US Dollar is mildly firmer across the board. Gold is steady above US$ 1,800.
Canadian CPI will be released later today alongside US mortgage and home sales data.
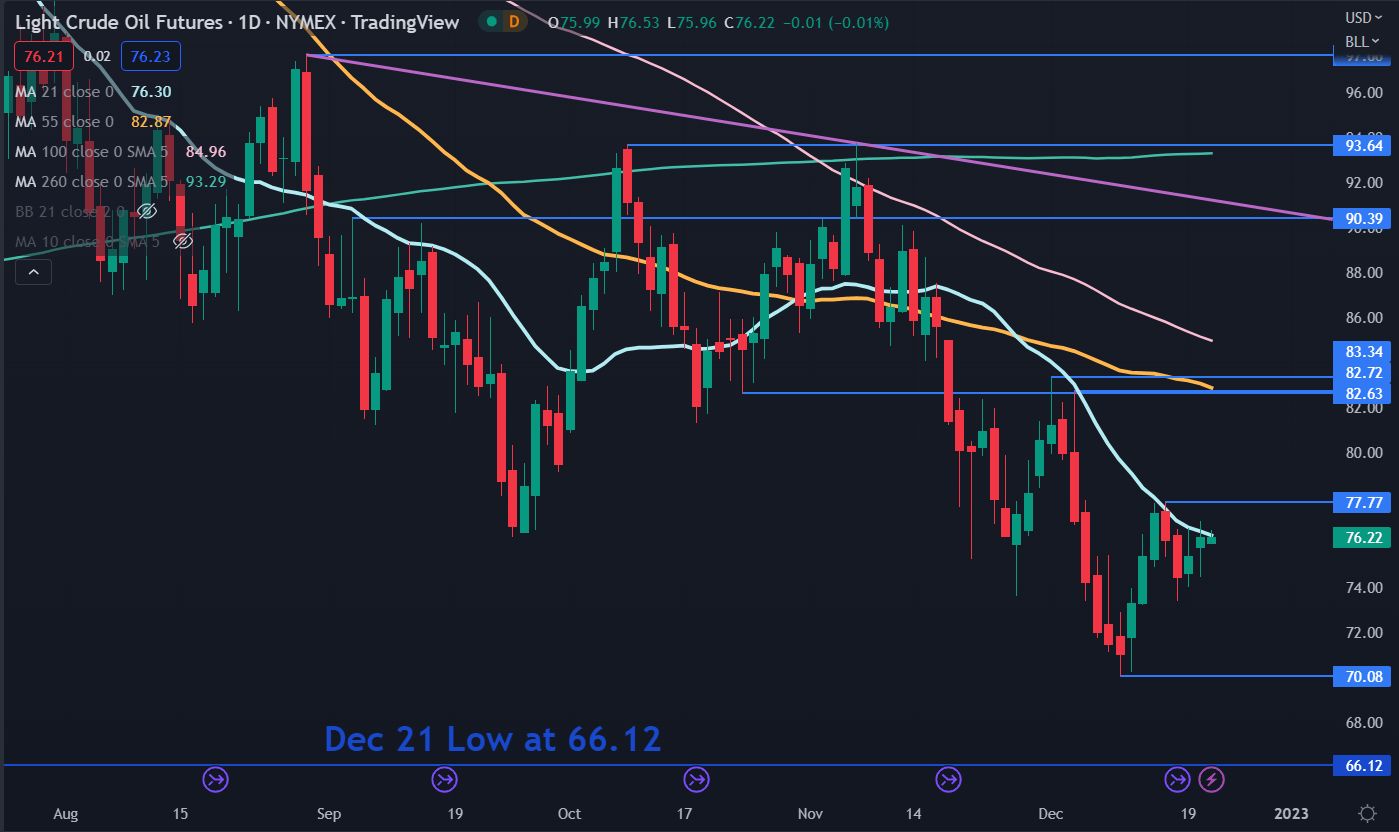
WTI CRUDE OIL TECHNICAL ANALYSIS
WTI crude oil rallied off its 12-month low of 70.08 seen earlier this month and that level may provide support ahead of the December 2021 low of 66.12.
The price has been unable to overcome the 21-day simple moving average (SMA) of late and it may continue to offer resistance ahead of the recent high of 77.77. That level may offer resistance
Further up, resistance might be at the breakpoint of 82.63 or the recent peaks of 82.72 and 83.34. The 55-day SMA is also currently near that high of 83.34.









 Chat now!