GBP Breaking News: UK Economy Expands 0.1% in Q1 of 2023, GBP/USD Bid

GBP Breaking News: UK Economy Expands 0.1% in Q1 of 2023, GBP/USD Bid

UK GDP first quarterly estimates of UK real gross domestic product (GDP) shows that the economy increased by 0.1% in Quarter 1 (Jan to Mar) 2023 while the monthly estimates show that GDP fell by 0.3% in March 2023, following an increase of 0.5% in January 2023.

image1.png

Customize and filter live economic data via our DailyFX economic calendar

The services sector grew in Q1 thanks to information and communication 1.2%, and administrative and support service activities 1.3%. Looking at other sectors construction grew by 0.7% with manufacturing 0.5% and the production sector at 0.1% respectively.

On the consumption side, household spending showed no growth on the quarter as incomes continue to be squeezed by high inflation, while there was a positive contribution from gross fixed capital formation 1.3%, namely business and government investment. The UK economy remains 0.5% smaller than before the Covid-19 pandemic.

UK GDP GROWTH PROSPECTS FOR 2023

The BoE Yesterday announced upgraded growth forecast as the UK Economy remains rather resilient despite households struggles with rising prices. UK Chancellor Hunt confirming his excitement at today report stating that its good news that the economy is growing but to reach the government’s growth priority we need to stay focused on competitive taxes, labor supply and productivity. The Chancellor was also given a nod by the BoE yesterday with the Fiscal support in Hunts Spring Budget seen as a supporting factor to the economic outlook.

However, given all the optimism around the UK economy it’s easy to forget that the economy stalled in February and contracted in March, a sign of sluggishness and caution. The March data in particular is a cause for concern, however the Office for National Statistics (ONS) says that the UK economy suffered from the awful weather during the month. The month of March was the 6th wettest March since 1836 with this seen as a key driver of the poor data as consumers kept indoors and retail sales suffered.
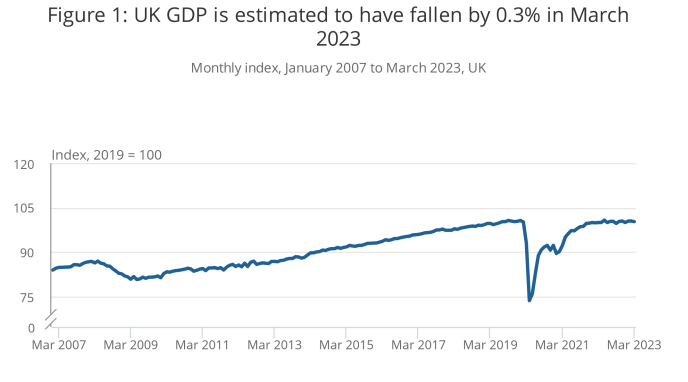
image3.png

Source: ONS

This will be worth keeping an eye on moving forward as the UK moves toward the summer months and whether the blip in February and March continues, or was weather really responsible for Marchs dip in particular?

MARKET REACTION

The initial market reaction following the news has seen GBPUSD decline 15 pips before rallying to trade marginally up for the day around 1.2530. Looking at the bigger picture from a technical perspective, GBPUSD price came under pressure on yesterday around recent highs and key resistance area around the 1.2660 mark. A selloff down to 1.2500 followed but the bullish structure remains intact. A daily candle close below the 1.2460 level would invalidate the bullish structure and see further downside come into play with 1.2360 support coming into focus which lines up with the 50-day MA.

A lot of this will rest on overall sentiment today as well with any haven demand likely to see the dollar continues its recent recovery. An improvement on overall sentiment could see a push toward the recent highs once more.

GBPUSD Daily Chart, May 12, 2023
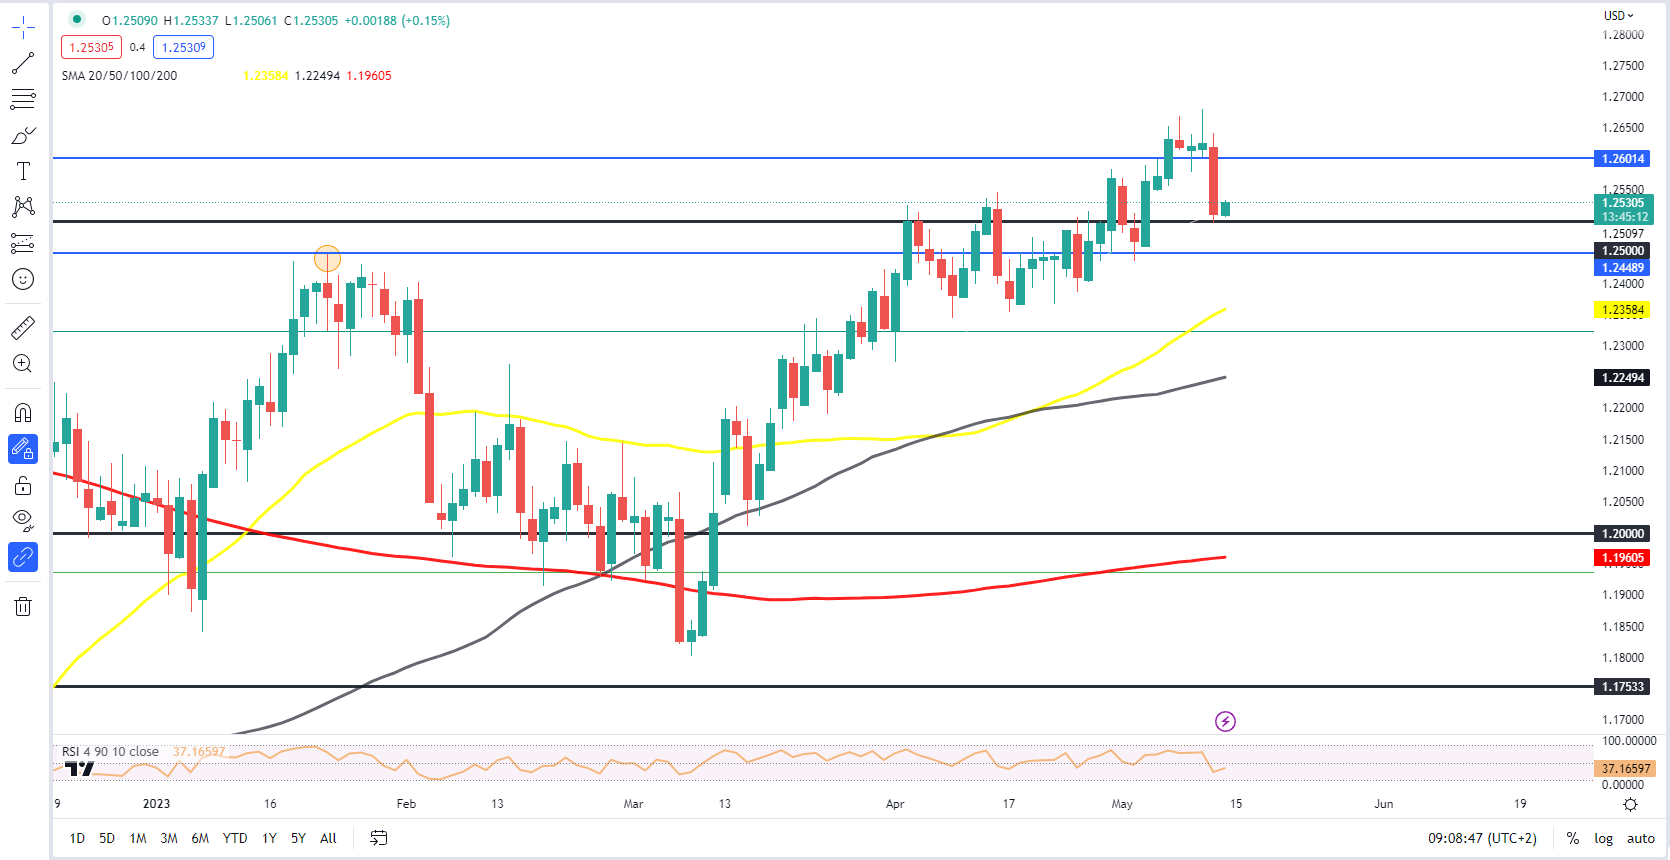
image4.png


Hoping For an Early Fed Pivot Does Not Mean We Will Get One

Hoping For an Early Fed Pivot Does Not Mean We Will Get One

Every economic age has its dominant phrase. Think of the ‘irrational exuberance’ which then-Federal Reserve Chair Alan Greenspan fretted about during the 1990’s dot-com bubble. If that’s too far back for you, what about European Central Bank chief Mario Draghi in 2012 promising skeptical markets that he’d do ‘whatever it takes’ to save the Euro?

The buzzword of this inflation-ravaged era is more succinct. In fact, it’s just one word – ‘pivot.’

For our purposes it means the point at which the United States Federal Reserve will feel it can stop raising interest rates and begin to offer the possibility that they could start to go down.

It’s easy to see why that word dominates. 2022 brought, among other dark things, interest rate rises unprecedented in the working lives of many people now engaged with financial markets. The US central bank has hit the monetary brakes no fewer than seven times, pushing the benchmark rate up to a target range of 4.25-4.5%. That’s the highest rate in fifteen years. Moreover, while there are clear rhetorical signs that the Fed is now more cautious about raising rates than it was back in the summer, there are equally clear signals that borrowing costs will go higher yet and that it may not top out below 5%.

Given that the Fed Funds rate spent much of the time between 2009 and 2021 barely above zero, the scale of the turnaround has been astonishing.

And given that so many market participants cut their teeth in a long era of docile inflation, cheap money and ever-flowing credit, it’s no wonder that so many should be keen that the Fed does indeed pivot as soon as possible. The thing about Golden Ages is that people always want them back.

But that doesn’t mean they come back. Of course, the key to whether or not the Fed will, in fact, pivot, will be found in the inflation data. And the picture there is still very unclear.

Boosted by a number of factors, from the war in Ukraine through to Covid’s supply-chain havoc and a general rethink of the previously dominant trend toward ever-more globalization, prices surged in 2022 by measures not seen for fully 40 years. The US was not alone in facing this gale, of course. Other countries did so too, and some had it a lot worse. Inflation has run hotter in Europe thanks among other factors to its energy dependence on Russia.

Even Japan has seen a resurgence of pricing power, where inflation has been thought dead for decades.

But the US still runs the table, and it’s the success of the US response which will matter most. And there are some encouraging signs. The Fed’s preferred measure of inflation continued to slacken in November, providing another indicator that price pressures may indeed have peaked earlier in the year.

The Personal Consumption Expenditures price index, or PCE, rose 5.5% on the year, well below the 6.1% rise seen just a month earlier. The core measure, which cuts out the volatile effects of food and energy costs, was up by a more reassuring 4.7% annualized. Both readings were at their lowest since October 2021.

The release chimes with official Consumer Price Index data for the same month, which showed a similar slackening.

Nevertheless, price rises there still stand at 7.1%, which is a very long way indeed from the 2% rate targeted by the Fed. Moreover, the US central bank’s mandate is to promote stable prices and maximum employment. There may not be many active in the markets today who remember the inflationary pressures of the 1970s and early 1980s. However, there will be many in the Fed who do remember them, and how hard-won the victory was. The monetarist students at the US central bank will be only too aware that they can’t afford to end the rate rising process until inflation – and as importantly, inflation expectations – have been actually and obviously seen to be crushed.

Hence, we see things like stocks falling despite robust Gross Domestic Product numbers. Investors are seeing everything through the inflation prism, and any sign that the Fed’s action has yet to clearly cool economic activity just has investors ever-more convinced that the pivot is not here yet.

5.5% inflation may be better than 6.1%, but it’s still outrunning the Fed’s target by a huge amount, and there’s simply no way policymakers are going to stop fighting while that’s the case. Chair Jerome Powell and the rest of the Open Market Committee well know that their success in getting inflation down will define their time.

Many commentators think we might get very close to pivot territory by the late spring of next year, but in truth we’d probably have to see a marked moderation in wage momentum and, probably, employment growth. Both have remained surprisingly strong despite the Fed’s actions.

Inflation also has a nasty tendency to get sticky. Faced with rising prices, employees demand higher wages, which only add to cost pressures at a time when there’s usually little option but to pass these on again to consumers. And so on…

The upshot of all this is that it could yet be a very long time before the Fed actually does ‘pivot,’ and any prognosis that such a thing could happen in the early part of 2023 depends on evidence of a pretty rapid economic slowdown coming soon. If the economic data don’t start to support this thesis unambiguously in the early months of the year, then the waiting for the pivot could prove a much longer game than many in the markets now hope it’ll be.

Fed’s Barkin: Inflation still ‘stubbornly high’ and isn’t easing fast enough toward 2% target

Fed’s Barkin: Inflation still ‘stubbornly high’ and isn’t easing fast enough toward 2% target

Inflation remains “stubbornly high” and is no longer making much progress toward the Federal Reserve’s 2% target, a top Fed official said Wednesday, hours after price data for April were released.

In an interview, Tom Barkin, president of the Federal Reserve Bank of Richmond, said he is also seeing some signs that banks in his region — which includes Virginia, North Carolina, South Carolina and West Virginia — are slowing their lending. It isn’t yet clear, he said, what consequences that trend might have on the economy and inflation.

For now, Barkin said, inflation remains unacceptably high. A government report Wednesday on consumer prices in April showed that inflation fell to 4.9%, the lowest year-over-year level in two years. Yet excluding volatile food and energy costs, inflation stayed high from March to April and was up 5.5% from a year earlier, little changed since December.

Barkin noted that the latest figures reflected some one-time fluctuations — sharp drops in airline fares and hotel room prices, for example, and a spike in the cost of used cars — that may not persist.

“Just looking through all that it still paints a picture of inflation that is stubbornly high,” he said.

Core inflation has been stuck in a range of 0.3%-0.5% for months, he added, “where you’d really like it to be moving down and in concert with our target.”

Wall Street investors have told themselves a variety of stories about trends that should reduce inflation, Barkin said. The unraveling of supply chains was supposed to bring goods prices lower and supply chains have untangled, “but you still have inflation,” he said.

Another hope was that the Fed’s rapid interest rate hikes would rein in Americans’ expectations of inflation, Barkin said. Inflation expectations can be self-fulfilling — if companies don’t expect prices to rise much, they won’t see a need to raise their own prices.

Yet even as “expectations have come down,” Barkin said, “inflation is still stubbornly high.”

“I’m still open to the notion that demand is settling and inflation will follow in relatively short order, but I wouldn’t say I’m convinced yet,” he said.

When asked what would cause him to support more rate hikes, Barkin pointed to any signs that demand was re-accelerating. Consumer spending was flat in February and March, he noted, a sign the economy is cooling in a way that could help bring down inflation.

“And so what would be the things that would be most compelling to me?” he asked. “Signals that demand, in fact, was not ebbing. … (Or) something that made you think inflation was accelerating or poised to accelerate.”

In a policy statement it issued last week, the Fed removed a sentence from its previous statement that had said “some additional” rate hikes might be needed. It replaced that sentence with language that said it would now weigh a range of factors in “determining the extent” to which future hikes might be necessary.

Most analysts saw that change as evidence that the Fed will now pause its rate hikes after having raised its benchmark rate 10 times since March 2022, from near zero to about 5.1%, the highest level in 16 years. The rate hikes, which have been intended to cool spending, growth and inflation, have elevated the costs of auto loans, credit card borrowing and business loans.

In the interview, Barkin said the Fed’s message after its meeting last week was “explicitly not a pause” in its rate increases “or even necessarily a peak.” Instead, he said, it provided “the optionality to do more, if you need to do it. And also the optionality to wait if waiting is appropriate.”

Barkin’s remarks were broadly similar to what other Fed officials have said in recent days. John Williams, president of the New York Fed, noted Tuesday that “we haven’t said we’re done raising rates.”

Rather, Williams said, the Fed is no longer indicating that it will raise rates at each meeting. Instead, he said, the central bank will do what it deems necessary based on the latest economic data, including bank lending trends.

Williams also stressed that the Fed was unlikely to cut its key rate this year, even though investors expect three rate cuts this year, according to CME’s Fedwatch tool.

The Fed will keep rates at a high enough level to restrain the economy “for quite some time,” Williams said. “I do not see any need … to cut interest rates this year.”

EUR/USD accelerates losses and drops to the 1.0920 region

EUR/USD accelerates losses and drops to the 1.0920 region

The selling pressure around the European currency gathers further steam and drags EUR/USD to 3-week lows near 1.0920 on Thursday.

EUR/USD weakens amidst USD-buying

EUR/USD resumes the weekly leg lower and approaches the 1.0920 region on the back of the continuation of the bid bias around the greenback, which motivates the USD Index (DXY) to creep towards the 102.00 neighbourhood.

In the meantime, recent hawkish comments from ECB’s rate setters failed to lend sustained legs to the pair, which has so far met a tough up-barrier near the 1.1100 mark.

Still around the ECB, Board member M. Kazaks suggested on Wednesday that a rate hike in July might not be the last one amidst the current context of still elevated inflation, an idea that falls in line with speculation of another quarter-point hike in September, which should bring the deposit rate to 4.0%.

There are no scheduled releases in the euro calendar on Thursday, leaving all the attention to the publication of Producer Prices and the usual weekly Initial Jobless Claims across the ocean.

What to look for around EUR

EUR/USD faces renewed downside pressure in response to the resurgence of the risk aversion and the consequent investors’ move towards the greenback.

The movement of the euro’s value is expected to closely mirror the behaviour of the US Dollar and will likely be impacted by any differences in approach between the Fed and the ECB with regards to their plans for adjusting interest rates.

Moving forward, hawkish ECB-speak continue to favour further rate hikes, although this view appears in contrast to some loss of momentum in economic fundamentals in the region.

Key events in the euro area this week: ECB De Guindos, Schnabel (Thursday).

Eminent issues on the back boiler: Continuation (or not) of the ECB hiking cycle. Impact of the Russia-Ukraine war on the growth prospects and inflation outlook in the region. Risks of inflation becoming entrenched.

EUR/USD levels to watch

So far, the pair is losing 0.64% at 1.0921 and faces the next contention level at 1.0909 (weekly low April 17) seconded by 1.0831 (monthly low April 10) and finally 1.0795 (100-day SMA). On the flip side, the surpass of 1.1095 (2023 high April 26) would target 1.1100 (round level) en route to 1.1184 (weekly high March 21 2022).

ECB Speakers Fail to Boost EUR as US Debt Ceiling Concerns Grow

ECB Speakers Fail to Boost EUR as US Debt Ceiling Concerns Grow

EURO FUNDAMENTAL BACKDROP

Yesterday’s gains for the euro has been pared back this morning as the USD recovers. Despite US CPI falling in line with expectations and advocating for almost 3 rate cuts by year end (money market pricing), risk sentiment is souring due to the lack of confidence in US debt ceiling talks. The safe haven appeal of the US dollar has thus garnered support against the EUR and could provide a floor for EUR/USD until such time as a decision materializes.

The eurozone looks to further European Central Bank (ECB) officials today in what is a light economic calendar for the region. Expect more hawkish commentary particularly from the ECB’s Schnabel; however, as we saw yesterday, there was no real follow through from ECB guidance. The European session has already kicked off with the ECB’s Nagel citing sticky inflation and the need for higher for longer rates – but has not translated once again.

Chinese CPI and PPI data missed forecasts during the Asian session and has since dampened risk sentiment. Concerns around China’s economic growth and local demand has weighed on the euro thus exacerbating risk aversion from the US debt ceiling subject.

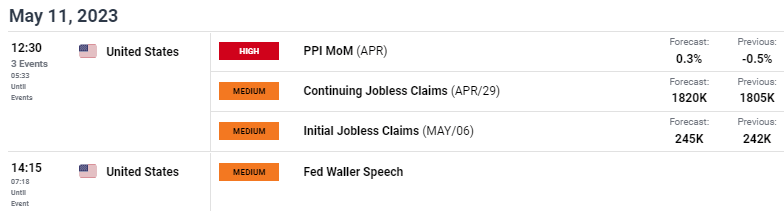
Later today (see economic calendar below), US PPI alongside jobless claims data will come into focus followed by FOMC members Waller and Kashkari.

EUR/USD ECONOMIC CALENDAR

image1.pngimage2.png

TECHNICAL ANALYSIS

EUR/USD DAILY CHART

image3.png

Chart prepared by Warren Venketas, IG

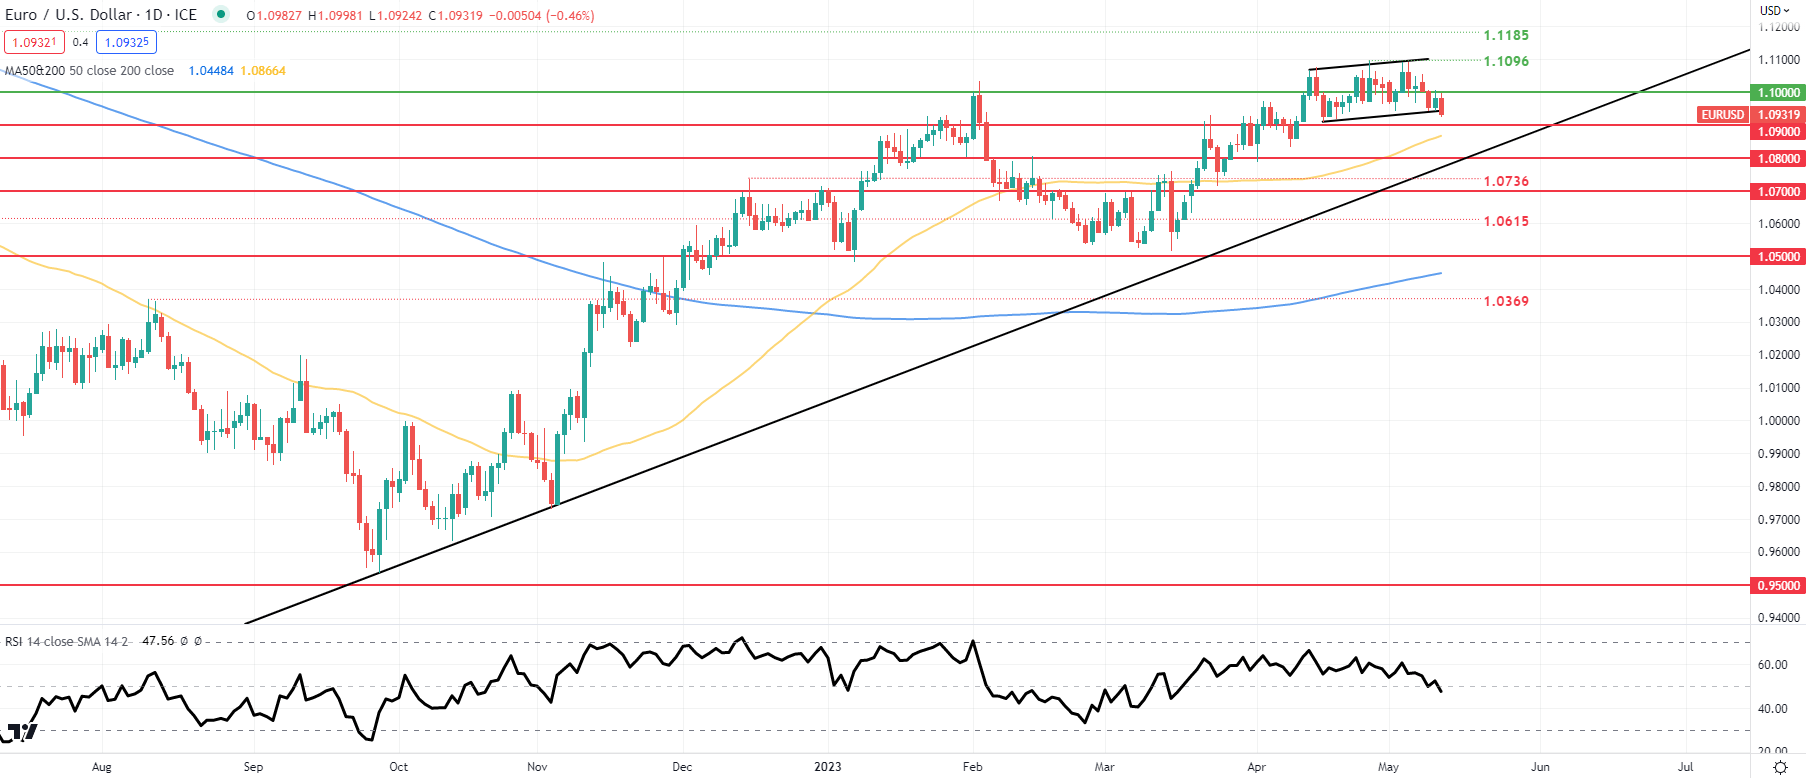
Daily EUR/USD price action has broken below the ascending channel (black) and a daily candle close below this level could prompt a further euro sell-off. This will be contingent on US factors (primary debt ceiling guidance) which is why the Relative Strength Index (RSI) reflects hesitation.

Death Cross: What is it and How to Identify it When Trading?

Death Cross: What is it and How to Identify it When Trading?

Death cross: What is it and How to Identify it when Trading?

The ‘death cross’ is a term often mentioned in trading circles due to its usefulness in spotting changes in trends while also being incredibly easy to use. This article will explain the concept of the death cross and how to identify it on price charts. Furthermore, read our article on the Golden Cross to discover complementary indicators to use alongside the simple moving averages when analyzing changing trends.

Death Cross

What is a Death cross?

A death cross occurs when the 50 simple moving average (SMA) crosses below the 200 SMA. The death cross provides a bearish backdrop to the market as short-term price momentum advances lower, with the potential to evolve into a new long-term trend (downtrend).

The 50 SMA is an arithmetic average of closing price levels over the last 50 periods or days, if you are using the daily chart for example. Therefore, the 50 SMA is more reactive to more recent price movement than the 200 SMA, which averages out the last 200 closing prices and tends to create a smoother line, less reactive to recent prices than the 50 SMA.

Learn how to calculate simple moving average in our article, ‘Moving Average Explained for Traders’

How to Identify a Death cross

There are three main stages to the formation of the death cross:

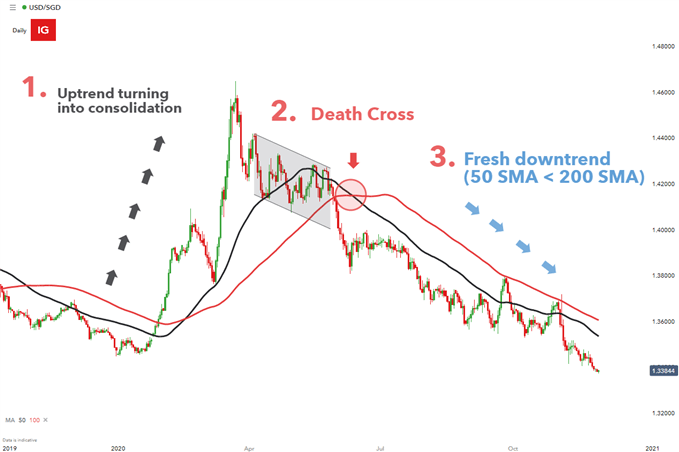
1. The lead up: Price action consolidates or, in some scenarios, turns sharply lower after trending higher for a considerable period of time. A period of consolidation provides the initial clue that the uptrend may be starting to lose momentum and could even result in an eventual trend reversal. The 50 SMA remains above the 200 SMA during this stage.

2. The death cross: This is the exact moment the 50 SMA crosses below the 200 SMA, providing the bearish backdrop for the market known as the death cross. The death cross is often interpreted as a trigger to look for entries into the market.

3. Continued downward momentum: Price action advances lower after the death cross is observed, often creating a fresh new trend (downtrend). Ideally, in this stage you may observe the shorter 50 SMA acting as dynamic resistance for price action and price continues to trade below the 50 SMA for some time.

Death cross on Daily USD/SGD Chart 2019-2020

The Simple Moving Average as a Lagging Indicator

By its very nature the simple moving average is a lagging indicator, meaning that it relies on past price action to provide assistance when analyzing current market conditions. Inherently, the SMA has a lag period, resulting in the signal being produced some time after the move has occurred.

Some may view this as a lost opportunity while others may appreciate the delayed signal as it may provide a greater level of conviction that the trend has indeed changed and we aren’t simply witnessing a short term retracement. Shorter-term traders like scalpers and day traders, seeking to capitalize on smaller moves, can make the indicator more responsive by simply reducing the short-term and longer-term moving averages when adjusting the input criteria.

USD/CHF Price Analysis: Bullish triangle confirmation signals further upside past 0.8900

USD/CHF Price Analysis: Bullish triangle confirmation signals further upside past 0.8900

USD/CHF remains on the front foot around 0.8920, reversing the previous day’s losses heading into Thursday’s European session.

In doing so, the Swiss Franc (CHF) pair pierces the top line of the one-week-old descending triangle bullish chart formation.

Adding strength to the USD/CHF upside bias is the quote’s clear rebound from the stated triangle’s lower line, by forming double bottom near 0.8865, as well as the firmer but not overbought RSI (14) line.

With this, the USD/CHF pair appears well set to approach a downward-sloping resistance line from May 05, around 0.8950 by the press time.

However, the pair’s upside beyond 0.8950 may find it difficult amid the likely overbought RSI (14) line around then. Additionally challenging the USD/CHF bulls above 0.8950 is the monthly high of near 0.8995, quickly followed by the 0.9000 psychological magnet.

On the contrary, a one-week-old ascending trend line, close to 0.8880 at the latest, can act as short-term support in a case where the USD/CHF defies the latest triangle breakout by slipping back under 0.8915 level.

Even so, the stated triangle’s lower line of around 0.8865 can challenge the pair bears before directing them to the monthly low of 0.8820 and the 0.8800 round figure.

USD/CHF: Hourly chart

Yellen Says Debt Default Would Hurt US International Leadership

Yellen Says Debt Default Would Hurt US International Leadership

Treasury Secretary Janet Yellen said failure to avoid a looming federal government default would undermine Washington’s ability to provide international leadership and defend US national security.

Yellen has long warned a default could cause an “economic and financial catastrophe.” She added the new wrinkles Thursday while in Japan to attend a meeting of Group of Seven finance officials.

A default “would spark a global downturn” and “would also risk undermining US global economic leadership and raise questions about our ability to defend our national security interests,” Yellen said according to the text of her remarks released by the Treasury.

President Joe Biden and Republican lawmakers made little progress in a meeting earlier this week in Washington that kicked off negotiations on the topic. Republican aides and White House staff planned to begin budget discussions in its wake, with another meeting set for Friday between Biden and congressional leaders.

Biden and congressional Republicans are locked in a showdown over raising the $31.4 trillion borrowing limit, with GOP leaders demanding promises of future spending cuts before they approve a higher ceiling. Biden has insisted on a “clean” increase, with budget talks kept separate.

The US government reached the statutory cap on borrowing in January and the Treasury has since been using special accounting measures to make cash available. Yellen has told Congress those measures could run out as soon as June 1, putting payments to US bond investors, benefits recipients and federal contractors, among others, in jeopardy.


GBP/USD tests 1.2600 on BoE’s “Super Thursday”

GBP/USD tests 1.2600 on BoE’s “Super Thursday”

GBP/USD is holding lower near 1.2600, retreating from near 1.2650 heading into the European open. The cautious mood ahead of the BoE monetary policy decision is keeping Pound Sterling bulls at bay. Meanwhile, the US Dollar is struggling following softer US CPI.

GBP/USD continues to trade within the lower half of the ascending regression channel. The Relative Strength Index (RSI) indicator on the four-hour chart stays near 50, highlighting the lack of directional momentum.

On the downside, 1.2600 (psychological level) aligns as interim support ahead of 1.2565 (50-period Simple Moving Average (SMA) on the four-hour chart, lower limit of the ascending channel). A four-hour close below the latter could attract sellers and cause GBP/USD to decline toward 1.2500 (psychological level, 100-period SMA).

First resistance is located at 1.2650 (mid-point of the ascending channel). If GBP/USD rises above that level and starts using it as support, 1.2670 (Monday high) and 1.2700 (psychological level) could be targeted.

GBP/USD has been moving up and down in a tight range above 1.2600 early Wednesday following Tuesday’s indecisive action. April’s inflation report from the US could trigger a short-term reaction in the pair ahead of the Bank of England’s (BoE) policy announcements on Thursday.

Although the US Dollar Index extended its recovery amid risk aversion on Tuesday, GBP/USD managed to hold its ground. Investors seem to be reluctant to bet on Pound Sterling weakness on the possibility of a hawkish BoE surprise. HSBC noted recently that it see the risk of a “few” votes for 50 bps increase, based on recent UK data.

Having said that, inflation data from the US could trigger a straightforward market reaction and impact GBP/USD in the American session on Wednesday. The headline Consumer Price Index (CPI) in the US is forecast to rise 5% year-on-year in April, the same as in March. The Core CPI, which excludes volatile food and energy prices, is expected to increase 0.4% on a monthly basis.

Market participants remain fairly certain that the US Federal Reserve will pause its tightening cycle in June in the face of tightening financial conditions. A stronger than expected increase in the Core CPI in April could cause investors to reassess the Fed’s rate outlook and provide a boost to the US Dollar (USD) in the near term. On the flip side, a soft monthly core inflation reading should help GBP/USD gather bullish momentum.

Nevertheless, GBP/USD’s reaction might not be strong enough to provide a directional clue with the BOE’s rate decision looming.