Crude Oil Steadies as Markets Eye Fed and ECB Rate Decisions. Where to for WTI?

Crude Oil Steadies as Markets Eye Fed and ECB Rate Decisions. Where to for WTI?

Crude oil failed to hold onto Friday’s gains at the start of this week and is listing lower going into the Tuesday session.

A holiday-impacted trading day saw a mixed bag of data that saw sentiment sway to and fro. Markets appear poised ahead of several central bank monetary policy decisions later this week.

On Monday, Chinese manufacturing PMI came in at 49.2 for April instead of the estimated 51.4 and 51.9 prior. Non-manufacturing PMI was 56.4 rather than the 57.0 anticipated and 58.2 previously. The less-than-rosy outlook for growth in world’s second-largest economy seemed to undermine crude.

Then later on, the US manufacturing ISM for April was 47.1, beating the forecasts of 46.8 and 46.3 previously but still in contractionary territory below 50 for the diffusion index.

On a brighter note, US construction spending in March grew by 0.3% month-on-month, beating the 0.1% anticipated and the revised -0.3% prior.

The Federal Deposit Insurance Corporation (FDIC) announced that JP Morgan would be acquiring the beleaguered First Republic Bank. This appeared to lift Treasury yields along the curve and the US Dollar got a general boost across the board, undermining WTI.

The price action has consolidated since the middle of last week after filling in the gap created by the OPEC+ announcement of a cut to production of 1.1 million barrels per day that kicked in at the start of this week.

Looking ahead, the Federal Reserve and the European Central Bank (ECB) will be meeting on Wednesday and Thursday respectively.

Both banks are forecast to raise rates by 25 basis points by the market. Although the tightening is anticipated, any deviation from this expectation might see volatility for crude tick higher.

CRUDE OIL (WTI) TECHNICAL ANALYSIS

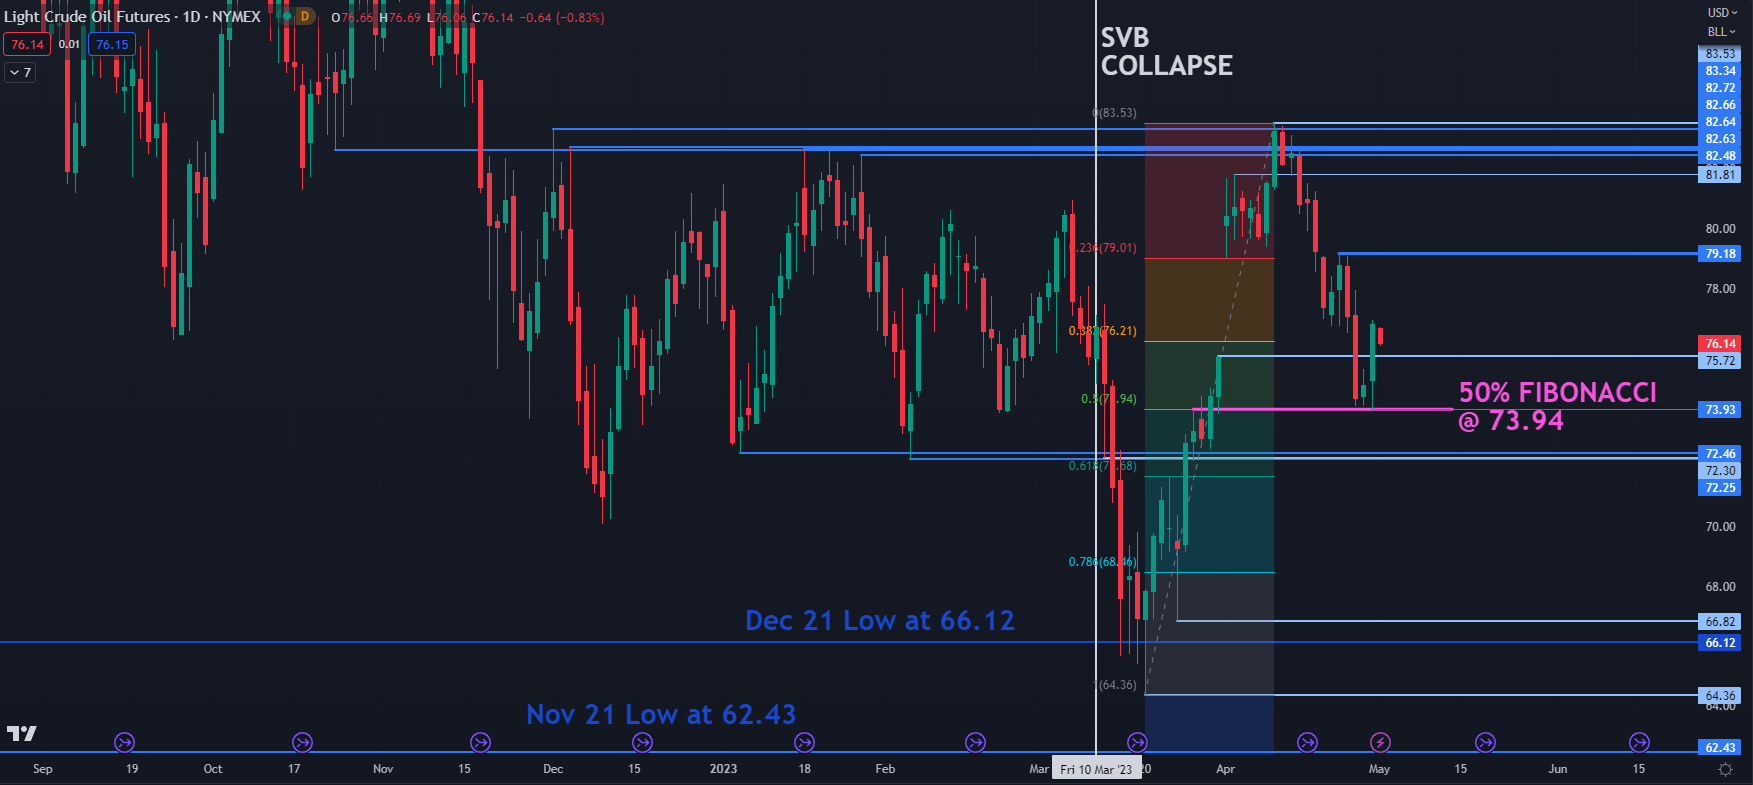
WTI crude appears to have retreated into a range trading type environment after bouncing off the 50% Fibonacci Retracement level of the move from 64.36 to 83.53 at 73.94.

That level may continue to provide support ahead of the breakpoints and prior lows in the 72.25 – 72.46 area.

On the topside, resistance could be at the recent high of 79.18. Further up, there are a series of breakpoints and previous peaks in the 82.50 – 83.50 area that may offer a resistance zone.

image1.png


Exploring Seasonality in Wall Street, Europe, and Asia-Pacific Stock Markets

Exploring Seasonality in Wall Street, Europe, and Asia-Pacific Stock Markets

Have you ever wondered whether or not certain months of the year are consistently better or worse for stock markets? If such a relationship does exist, then we would describe it as seasonal. Seasonality is something you often see in all kinds of data. For example, you can probably guess which months of the year ice cream sales consistently spike or when people repeatedly purchase more winter clothing.

Businesses use seasonality every year to plan their ventures, but can investors do the same with stock markets? If we assume that markets are efficient, reflecting all available information at a given time, then changes in stock prices every day (or in this case every month) should behave as white noise. In other words, we should not be able to predict the future based on past performance because markets are random.

I will put this simplified theory to the test for global stock markets. We will analyze the Dow Jones, S&P 500 and Nasdaq Composite on Wall Street. Then, we will do the same for the DAX 40, FTSE 100 and CAC 40 to gauge European indices. Finally, I will wrap up with a few major benchmark indices from the Asia-Pacific region: the Nikkei 225, ASX 200 and Hang Seng Index.

Each heatmap chart below contains identical parameters:

  1. Average monthly percent change (+2.5 means the index rose 2.5% on average in that month)
  2. Which months are significant (based on a 95% confidence interval from a regression model)
  3. The average goodness of fit between the 3 regression models (1 for each stock index)

These parameters will be discussed in further detail below.

Dow Jones, S&P 500, Nasdaq Composite Monthly Seasonality

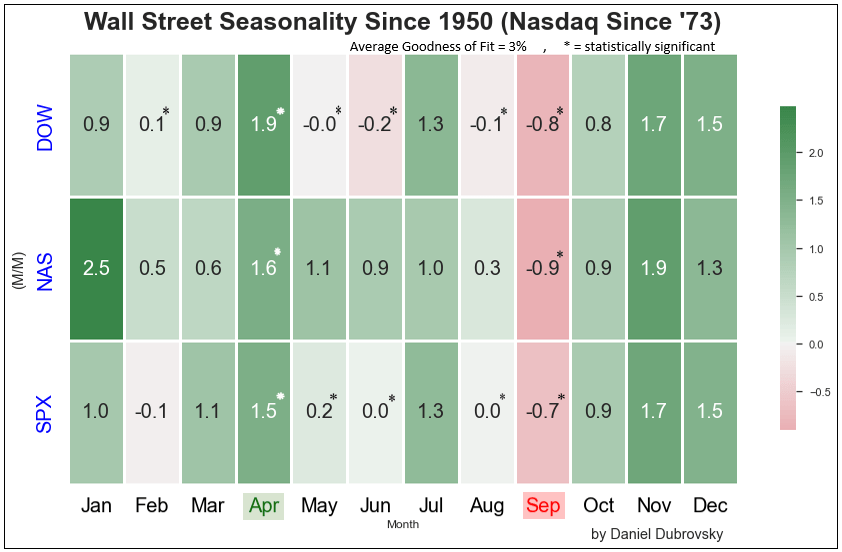
Starting with Wall Street, I have used data on the Dow Jones and S&P 500 since 1950. For the Nasdaq Composite, information since 1973 was used. The most recent month pulled was from December 2022, which applies to all European and Asia-Pacific indices as well. Are there any seasonal effects? Yes!

Historically, it seems that April has been the best month for Wall Street. On average the Dow, S&P and Nasdaq rallied +1.67% in this month. These are also statistically significant. In other words, there is about a 2.6% chance that this +1.67% effect on Wall Street is due to chance within the context of this study.

Meanwhile, September is the only month where all 3 indices have averaged negative and are statistically significant. In this month, the indices averaged -0.8%. I have also highlighted which other months are statistically significant with a “*”. Note that January seems to be a very strong month for the Nasdaq, but it is not significant because, over the years, this month has become progressively weaker.

Finally, and arguably more importantly, notice that the average goodness of fit between the 3 models is 3% (out of a maximum of 100%). What does that mean? On average, about 3% of the variation on Wall Street since the 1950s (‘70s for the Nasdaq) can be explained by seasonality alone (without factoring in any other variables like monetary policy or the unemployment rate).

In other words, while we found meaningful seasonality in April and September, seasonality by itself did a very poor job of explaining how stock markets traded in these months.
Dow Jones, S&P 500, Nasdaq Composite Monthly Seasonality

DAX 40, FTSE 100, CAC 40 Monthly Seasonality

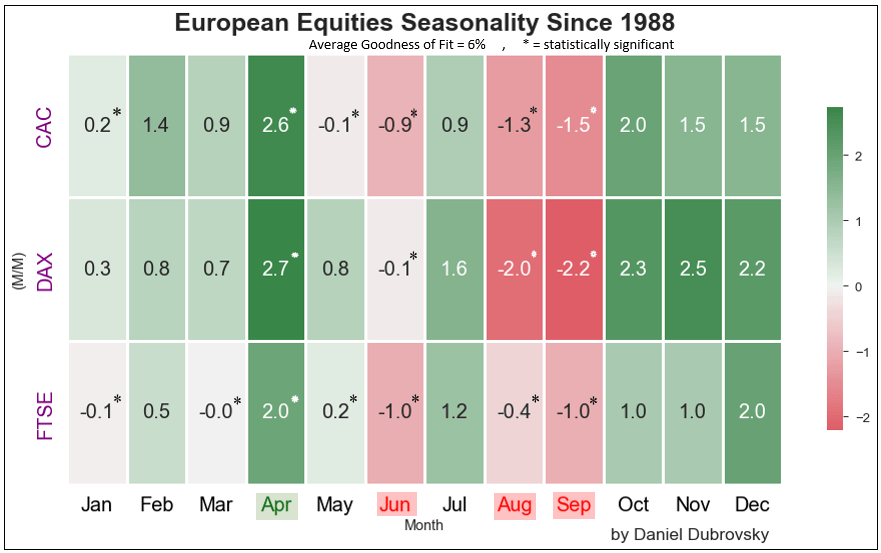
Now let us switch to European indices. It should be noted that the data is not as comprehensive as Wall Street, only going back to 1988. This means that compared to the Dow Jones and S&P 500, we have almost half the number of observations for the DAX 40 (German), FTSE 100 (United Kingdom) and CAC 40 (France).

Still, April has consistently been the best month, similarly to Wall Street. In this month, these European indices averaged 2.43%. For all 3 of them, this month is statistically significant.

Meanwhile, June, August and September have consistently been some of the worst months, averaging -0.67%, -1.23% and -1.57%, respectively. These are all statistically significant. As such, it seems you can find more weak months for this corner of global stock exchanges.

Similarly, with Wall Street, the average goodness of fit for seasonality in European indices is quite low at 6%. Once again this means that while we can identify meaningful seasonality, by itself it is not a good indicator of how these markets have performed in April, June, August and September over the years.
DAX 40, FTSE 100, CAC 40 Monthly Seasonality

Nikkei 225, ASX 200, Hang Seng Index Monthly Seasonality

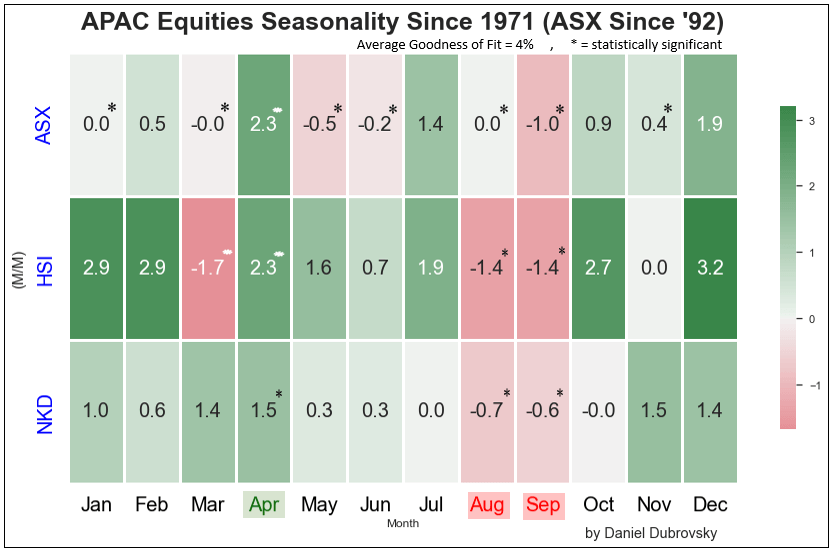
Wrapping up with Asia-Pacific markets, we will be analyzing the Nikkei 225 (Japan) and Hang Seng Index (Hong Kong) since 1971, along with the ASX 200 (Australia) since 1992.

Much like with Wall Street and European indices, April appears to have consistently and significantly been the best month for these APAC stock markets. The Nikkei 225, Hang Seng Index and ASX 200 averaged about 2% over the years.

Meanwhile, August and September have consistently and significantly been the worst periods. During these months, the indices returned -0.7% and -1% on average, respectively.

Like with other markets, the average goodness of fit was approximately 4%. Once again, while we can identify meaningful seasonality, by itself it did not do a good job of explaining how these markets performed in April, August and September over the years.
Nikkei 225, ASX 200, Hang Seng Index Monthly Seasonality

Should We Care About Seasonality in Stock Markets?

The takeaways from this deep dive can be split up into 4 key findings:

  1. Statistically significant seasonality is present in global stock markets
  2. April has consistently been the best month between the US, Europe and Asia
  3. September is the only month between all areas that has consistently disappointed
  4. Seasonality by itself has been a poor predictor of performance

For those with a keen eye, you might have noticed that October, November and December have historically been strong months for these global markets. But, as tested with the regression model, for the most part, these months have not been statistically significant.

With that in mind, while we can identify reoccurring patterns in global stock markets, which to a certain extent pours cold water on the “white noise” hypothesis, it probably will not hurt much to brush aside these effects in analyzing stock markets generally.

Australian Dollar Spikes After RBA Hikes. Will AUD/USD Find Higher Ground?

Australian Dollar Spikes After RBA Hikes. Will AUD/USD Find Higher Ground?

The Australian Dollar roared over 67 cents after the RBA tightened monetary policy following a pause last month. The 25 basis point lift took the cash rate to 3.85%.

In the accompanying statement on monetary policy, the bank said, “Some further tightening of monetary policy may be required to ensure that inflation returns to target in a reasonable timeframe, but that will depend upon how the economy and inflation evolve.”

They highlighted the tight labour market and that wages had started to pick up.

Australian retail sales and trade data will be released this week followed by building approvals figures next week. The Citibank Economic Surprise Index (ESI) in the chart below is leaning toward a possible beat for AUD fundamental data coming up.

image1.png

Data: Bloomberg

Prior to the meeting, interest rate markets were pricing in a fifty-fifty chance of a 25 basis point hike later this year. Now that it has arrived, the market is recalibrating and digesting the intonation of the statement. The reaction in AUD/USD has been more abrupt.

It would seem that last week’s inflation figures stoked some flames of concern with headline CPI of 7.0% slightly beating forecasts of 6.9% year-on-year to the end of March and it was against 7.8% previously.

The RBA’s preferred measure of trimmed-mean CPI was 6.6% year-on-year for the same period instead of estimates of 6.7% and 6.9% previously.

The headline CPI figure has been above the RBA’s mandated 2 – 3% inflation target since the second quarter of 2021 while the trimmed mean has been above the target since the first quarter of 2022.

The RBA didn’t start raising the cash rate until May 2022. The shortcomings of the trimmed mean measure may have been exposed by this episode.

This adjusted inflation gauge looks at the middle of 70% of the headline CPI basket. That is, it eliminates the 15% of the basket that rose the most and least.

This symmetric approach means that if one side of the basket is seeing far more aggressive price changes, the other side of the basket being eliminated doesn’t necessarily evenly compensate for it.

When inflation pressures are moving significantly up or down, the value of appraising the underlying price changes using a core method such as the trimmed mean might not be as useful as it has been historically.

What is apparent from today’s decision is that the RBA are back in inflation-fighting mode.

The Federal Reserve and European Central Bank (ECB) will meet later this week while the Bank of England will gather next week. Interest rate markets have priced in a 25 basis point lift by all three central banks.

The RBA’s full monetary policy statement can be read here.

AUD/USD 1 MINUTE CHART PRICE REACTION TO RBA HIKE

Live prices can be found here.

image2.png


Hoping For an Early Fed Pivot Does Not Mean We Will Get One

Hoping For an Early Fed Pivot Does Not Mean We Will Get One

Every economic age has its dominant phrase. Think of the ‘irrational exuberance’ which then-Federal Reserve Chair Alan Greenspan fretted about during the 1990’s dot-com bubble. If that’s too far back for you, what about European Central Bank chief Mario Draghi in 2012 promising skeptical markets that he’d do ‘whatever it takes’ to save the Euro?

The buzzword of this inflation-ravaged era is more succinct. In fact, it’s just one word – ‘pivot.’

For our purposes it means the point at which the United States Federal Reserve will feel it can stop raising interest rates and begin to offer the possibility that they could start to go down.

It’s easy to see why that word dominates. 2022 brought, among other dark things, interest rate rises unprecedented in the working lives of many people now engaged with financial markets. The US central bank has hit the monetary brakes no fewer than seven times, pushing the benchmark rate up to a target range of 4.25-4.5%. That’s the highest rate in fifteen years. Moreover, while there are clear rhetorical signs that the Fed is now more cautious about raising rates than it was back in the summer, there are equally clear signals that borrowing costs will go higher yet and that it may not top out below 5%.

Given that the Fed Funds rate spent much of the time between 2009 and 2021 barely above zero, the scale of the turnaround has been astonishing.

And given that so many market participants cut their teeth in a long era of docile inflation, cheap money and ever-flowing credit, it’s no wonder that so many should be keen that the Fed does indeed pivot as soon as possible. The thing about Golden Ages is that people always want them back.

But that doesn’t mean they come back. Of course, the key to whether or not the Fed will, in fact, pivot, will be found in the inflation data. And the picture there is still very unclear.

Boosted by a number of factors, from the war in Ukraine through to Covid’s supply-chain havoc and a general rethink of the previously dominant trend toward ever-more globalization, prices surged in 2022 by measures not seen for fully 40 years. The US was not alone in facing this gale, of course. Other countries did so too, and some had it a lot worse. Inflation has run hotter in Europe thanks among other factors to its energy dependence on Russia.

Even Japan has seen a resurgence of pricing power, where inflation has been thought dead for decades.

But the US still runs the table, and it’s the success of the US response which will matter most. And there are some encouraging signs. The Fed’s preferred measure of inflation continued to slacken in November, providing another indicator that price pressures may indeed have peaked earlier in the year.

The Personal Consumption Expenditures price index, or PCE, rose 5.5% on the year, well below the 6.1% rise seen just a month earlier. The core measure, which cuts out the volatile effects of food and energy costs, was up by a more reassuring 4.7% annualized. Both readings were at their lowest since October 2021.

The release chimes with official Consumer Price Index data for the same month, which showed a similar slackening.

Nevertheless, price rises there still stand at 7.1%, which is a very long way indeed from the 2% rate targeted by the Fed. Moreover, the US central bank’s mandate is to promote stable prices and maximum employment. There may not be many active in the markets today who remember the inflationary pressures of the 1970s and early 1980s. However, there will be many in the Fed who do remember them, and how hard-won the victory was. The monetarist students at the US central bank will be only too aware that they can’t afford to end the rate rising process until inflation – and as importantly, inflation expectations – have been actually and obviously seen to be crushed.

Hence, we see things like stocks falling despite robust Gross Domestic Product numbers. Investors are seeing everything through the inflation prism, and any sign that the Fed’s action has yet to clearly cool economic activity just has investors ever-more convinced that the pivot is not here yet.

5.5% inflation may be better than 6.1%, but it’s still outrunning the Fed’s target by a huge amount, and there’s simply no way policymakers are going to stop fighting while that’s the case. Chair Jerome Powell and the rest of the Open Market Committee well know that their success in getting inflation down will define their time.

Many commentators think we might get very close to pivot territory by the late spring of next year, but in truth we’d probably have to see a marked moderation in wage momentum and, probably, employment growth. Both have remained surprisingly strong despite the Fed’s actions.

Inflation also has a nasty tendency to get sticky. Faced with rising prices, employees demand higher wages, which only add to cost pressures at a time when there’s usually little option but to pass these on again to consumers. And so on…

The upshot of all this is that it could yet be a very long time before the Fed actually does ‘pivot,’ and any prognosis that such a thing could happen in the early part of 2023 depends on evidence of a pretty rapid economic slowdown coming soon. If the economic data don’t start to support this thesis unambiguously in the early months of the year, then the waiting for the pivot could prove a much longer game than many in the markets now hope it’ll be.

Forecast for Quotes: Take part in the new Demo Account Contest.

Forecast for Quotes: Take part in the new Demo Account Contest.

Dear clients,

LiteFinance presents a new service — Contracts for Quote Forecasts — in a demo mode.

You can place contracts for rate changes in any trading asset the LiteFinance company provides. This service allows you to profit from correct forecasts for quotes.The new section is working in a demo mode.

We invite our clients to be the first to test the new service and earn real money by participating in the Forecast for Quotes demo account contest. The most successful participants will share the prize fund of $62,000 in real money.

LiteFinance will give away $1,000 every 12 hours during a month. Five traders with the biggest contest account equity at the end of each stage will be awarded the following prizes:

  • 1st place — $500;
  • 2nd place — $200;
  • 3d place — $100;
  • 4th place — $100;
  • 5th place — $100.

How to participate in the Forecast for Quotes contest?

  1. Log in to your Client Profile and fully verify your email, phone number, name, and address
  2. Switch your Profile to a demo mode in the top-right corner of the Profile page.
  3. Click on the Quotes Forecasts tab in the side menu of your Client Profile, and then the “Contest” tab.
  4. Click on “Participate”, and a contest demo account with a $10,000 start deposit will be automatically opened for you.

How to make contracts for forecasts?

  1. Choose an asset you want to make a forecast for.
  2. Enter a contract size and a projected rate change in points.
  3. Indicate the direction of your quote forecast: “Higher” or “‎Lower”.

If your prediction is correct, the contract will close at a profit; if the price reaches the predetermined level in the opposite direction, your contract will close at a loss.

Try your luck and mastery, and leave your rivals far behind!

We thank you for your assistance and hope you will appreciate this new earning opportunity!

Faithfully yours,

LiteFinance.

US Dollar rallies, Argentina to pay for Chinese imports in Yuan

US Dollar rallies, Argentina to pay for Chinese imports in Yuan

The US Dollar (USD) has gathered strength in the second half of the week and the US Dollar Index climbed above 102.00 for the first time in a week on Friday. The risk-averse market atmosphere helps the USD find demand as a safe haven while hawkish Federal Reserve (Fed) bets provide an additional boost to the currency.

Ahead of the weekend, the US Bureau of Economic Analysis (BEA) will release the Personal Consumption Expenditures (PCE) Price Index, the Fed’s preferred gauge of inflation, for March. Employment Cost Index data for the first quarter will also be watched closely by market participants.

Technical analysis: US Dollar Index techs point to a bullish tilt

The US Dollar Index (DXY) climbed above the 20-day Simple Moving Average (SMA), which is currently located near 101.80, for the first time in 10 days on Friday. Additionally, the Relative Strength Index (RSI) indicator on the daily chart rose to 50, reflecting the lack of seller interest.

In case the DXY manages to end the week above 101.80, it could stage an extended recovery toward 102.60 (static level) and 103.00 (50-day SMA, 100-day SMA).

If sellers defend 101.80 and don’t allow the index to hold above that level, additional losses toward 101.00/100.80 (psychological level, static level, multi-month low set on April 14) and 100.00 (psychological level) could be witnessed.

How does Fed’s policy impact US Dollar?

The US Federal Reserve (Fed) has two mandates: maximum employment and price stability. The Fed uses interest rates as the primary tool to reach its goals but has to find the right balance. If the Fed is concerned about inflation, it tightens its policy by raising the interest rate to increase the cost of borrowing and encourage saving. In that scenario, the US Dollar (USD) is likely to gain value due to decreasing money supply. On the other hand, the Fed could decide to loosen its policy via rate cuts if it’s concerned about a rising unemployment rate due to a slowdown in economic activity. Lower interest rates are likely to lead to a growth in investment and allow companies to hire more people. In that case, the USD is expected to lose value.

The Fed also uses quantitative tightening (QT) or quantitative easing (QE) to adjust the size of its balance sheet and steer the economy in the desired direction. QE refers to the Fed buying assets, such as government bonds, in the open market to spur growth and QT is exactly the opposite. QE is widely seen as a USD-negative central bank policy action and vice versa.

EU Breaking News: German Economy Stagnates, EU GDP Grows Marginally

EU Breaking News: German Economy Stagnates, EU GDP Grows Marginally

German GDP Stagnates, EU GDP Reveals Growth Slow Down

Q1 GDP data for Germany narrowly avoided a contraction as the first three months of the year registered a 0% improvement on Q4 of 2022, according to the flash estimate on Friday morning. The print comes in significantly lower than consensus estimates of a minor 0.3% growth, leading EU related assets decisively lower.

The wider Euro Area economy fared slightly better but also missed estimates on both the quarter on quarter (QoQ) and year on year (YoY) benchmarks. YoY growth of 1.3% represents a 0.5% decline from the Q4 statistic, continuing the growth slowdown.

image1.png

Customize and filter live economic data via our DailyFX economic calendar

The disappointing data has resulted in rate expectations shifting further in favor of a 25 basis point (bp) hike when the ECB’s governing council meets next week Thursday, with an outside chance of a 50 bps looking less likely. Markets currently anticipate an 80% chance of a 25 basis point hike next week.

ECB Interest Rate Probabilities (Implied)

image2.png

EU Assets Head Lower After Disappointing Growth Data

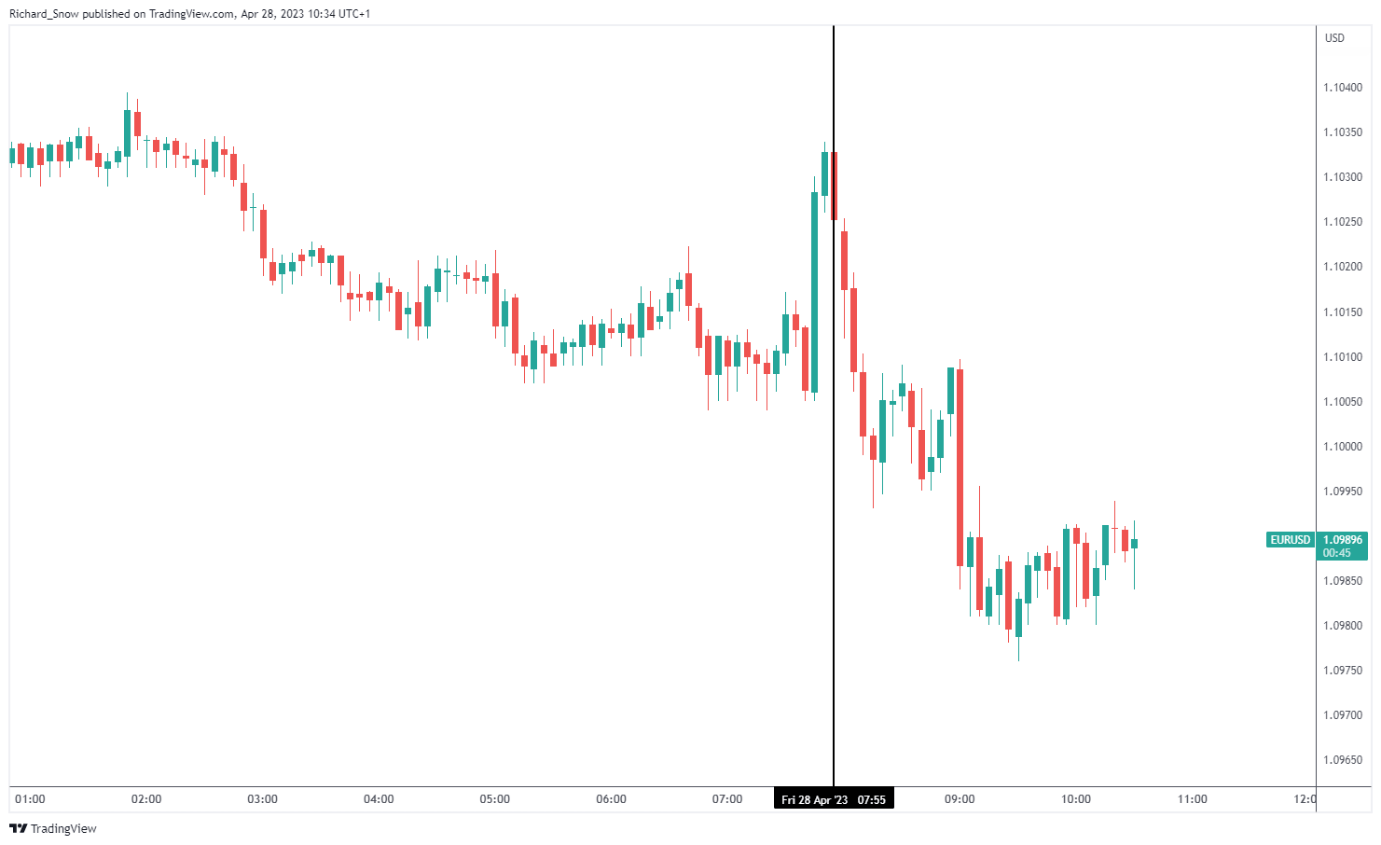
EUR/USD immediately headed lower after the German data but consolidated in the moments after the EU data made its way across computer screens.

EUR/USD 5-Min Chart

image3.png

Source: TradingView, prepared by Richard Snow

The recent move lower has been spurred on by the weaker than expected growth data in Germany along with a rare boost for the dollar as yesterday’s inflation component of the US Q1 GDP print came in hotter than expected – adding more weight behind the general consensus we’ll see a 25 basis point hike next week from the FOMC.

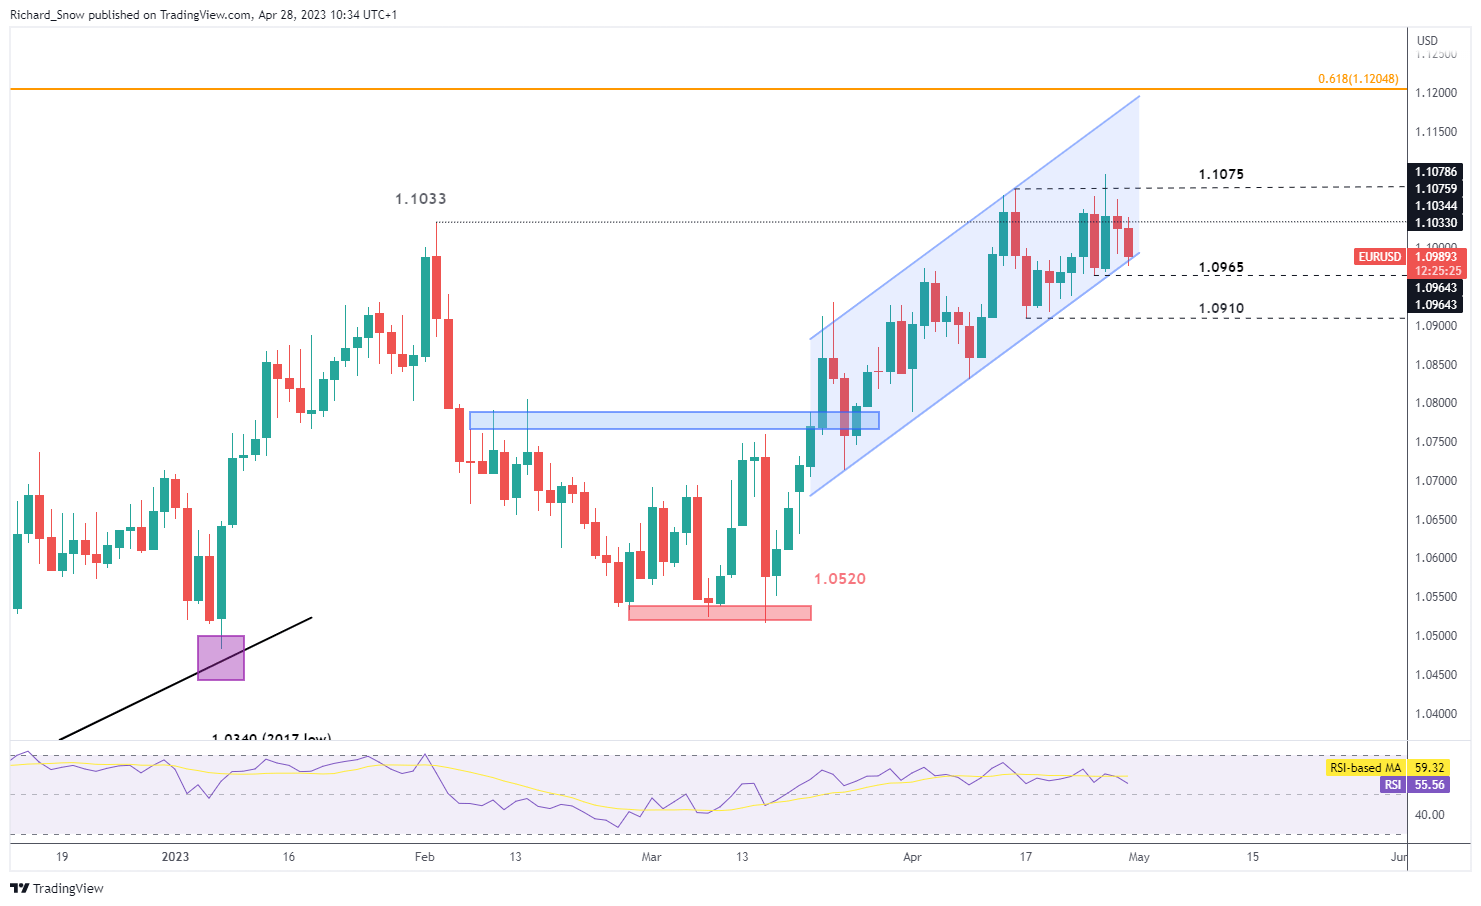
The longer-term uptrend remains bullish as prices remain within the ascending channel for now. In fact, such a pullback will be welcomed by EUR/USD bulls anticipating a pullback before considering a bullish continuation.

EUR/USD Daily Chart

image4.png

Source: TradingView, prepared by Richard Snow

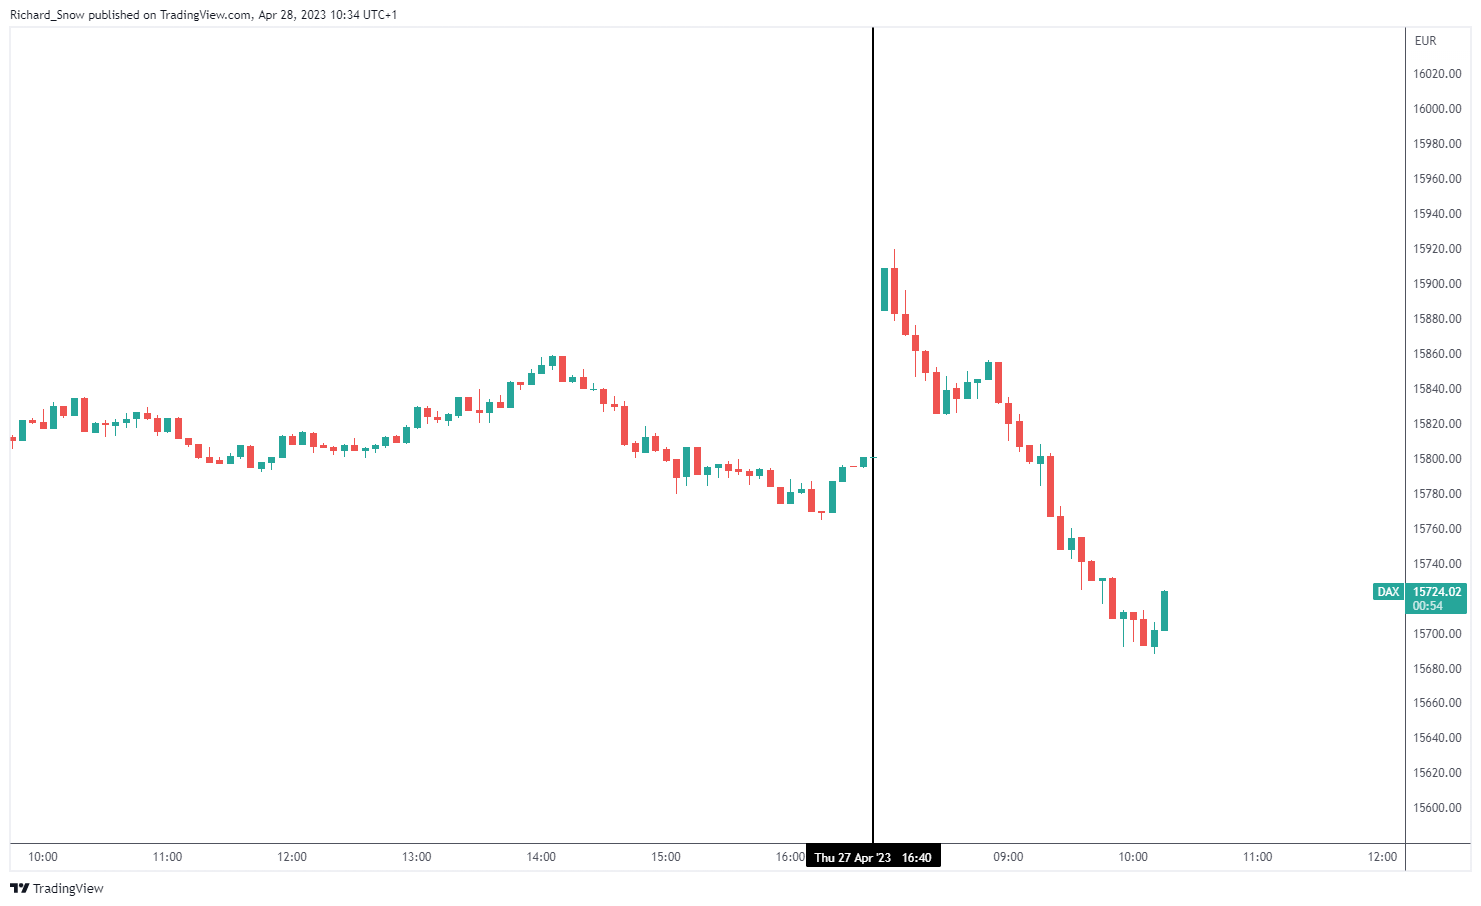
The DAX index also declined after the German growth data according to the 5-minute chart below despite a gap higher at the open. The index had already shown signs of bullish fatigue on the daily chart with as it struggled to push on from the yearly high.

image5.png

AUD/USD drops to its lowest level since March 10, further below 0.6600 ahead of US PCE

AUD/USD drops to its lowest level since March 10, further below 0.6600 ahead of US PCE

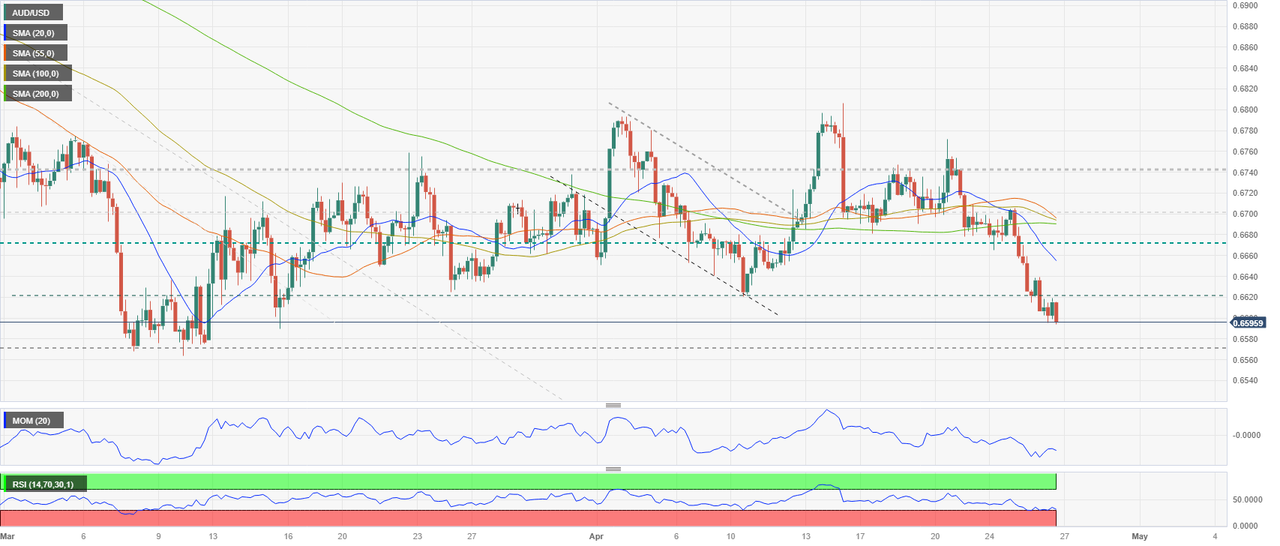
The AUD/USD pair attracts fresh selling near the 0.6640-0.6645 area on Friday and extends its intraday descent through the first half of the European session. The downward trajectory drags spot prices to the 0.6580-0.6575 region, or the lowest level since March 10, and is sponsored by resurgent US Dollar (USD) demand.

In fact, the USD Index (DXY), which tracks the Greenback against a basket of currencies, climbs to a fresh weekly top and draws support from firming expectations for another 25 bps lift-off at the next FOMC meeting in May. The bets for additional rate hikes by the US central bank were reaffirmed by the US macro data released on Thursday, which indicated persistent inflationary pressures and that the US job market remains healthy despite an economic slowdown.

Moreover, the Bank of Japan (BoJ)-inspired sell-off in the Japanese Yen (JPY), along with a generally weaker tone surrounding the equity markets, further benefit the safe-haven buck and drive flows away from the risk-sensitive Aussie. Apart from this,
technical selling below the 0.6600 round-figure mark aggravates the bearish pressure and contributes to the AUD/USD pair’s steep intraday decline. Spot prices now move back closer to the YTD low touched in March.

Investors now look forward to the release of the US Core PCE Price Index – the Fed’s preferred inflation gauge – due later during the early North American session. Given that the markets have been pricing in a pause in the Fed’s rate-hiking cycle after May, a stronger reading might prompt aggressive short-covering around the USD and pave the way for a further depreciating move for the AUD/USD pair. Nevertheless, spot prices remain on track to register heavy weekly losses.

AUD/USD Price Forecast: New 2023 Low for Aussie dollar?

AUD/USD Price Forecast: New 2023 Low for Aussie dollar?

AUSTRALIAN DOLLAR FUNDAMENTAL BACKDROP

The Australian dollar is trading in the red against the U.S. dollar this Friday morning as risk appetite dwindles. The greenback’s safe-haven appeal has come into play via renewed attacks from Russia in Ukraine US banking concerns. Emergency borrowings from the Federal Reserve increased for the second consecutive week underlining the tension in the financial sector. Earlier this morning, Australian housing credit data (see economic calendar below) for March printed in line with forecasts at 0.3% and maintains its downward trajectory as high interest rates make borrowing less attractive from a private sector point of view.

Later today, the Fed’s preferred measure of inflation (Core PCE) is due and anything suggestive of elevated levels may interfere with money market expectations on the Fed’s rate hike cycle that currently predicts only one more 25bps rate hike next week. Michigan consumer sentiment will close off the trading week with preliminary signs of a higher release than the March print (a USD positive).

ECONOMIC CALENDAR

image1.png

Source: DailyFX economic calendar

The RBA’s interest rate expectations (refer to table below) have been muted over the last few weeks, now anticipating no further rate hikes despite the strong inflation print on Wednesday. Should the Fed increase rates next week, the interest rate differential between the two nations will increase in favor of the US, making the USD more attractive moving forward. Although mostly priced in already, any indication as to more potential US rate hikes would likely hurt the Aussie dollar.

RBA INTEREST RATE PROBABILITIES

image2.png

Source: Refinitiv

Australian perspective, inflation for

TECHNICAL ANALYSIS

AUD/USD DAILY CHART

image3.png

Chart prepared by Warren Venketas, IG

Daily AUD/USD price action extends it’s bearish move after the bear flag (black) breakout on Tuesday and death cross (red). The next level under consideration for bears will be the 0.6565 swing low, with a break below signaling a fresh yearly low for the pair.