Gold Prices Fall as Traders Raise Odds of More Fed Tightening after Solid Jobs Data

Gold Prices Fall as Traders Raise Odds of More Fed Tightening after Solid Jobs Data

Gold prices (XAU/USD) retreated on Monday, falling more than 1.0% and threatening to break below the psychological $2,000 level, undermined by broad-based U.S. dollar strength and increased odds of additional Fed tightening following remarkably strong U.S. labor market data released last Friday.

The latest U.S. employment report, which showed the U.S. economy added 236,000 jobs in March, led traders to increase bets that the FOMC will deliver another quarter-point rate rise at its May meeting, implicitly reducing the likelihood of a pause to the hiking cycle next month.

A continuation of the central bank’s tightening campaign will stand to benefit the U.S. currency, creating headwinds for the dollar-denominated yellow metal and preventing its prices from decisively trading above the $2,000 threshold in the coming days and weeks. This, however, does not mean that the bullish case has been invalidated.

Despite the uncertainty about the near-term monetary policy path, the Fed will likely adopt a dovish stance at some point in the not-so-distant future once the economy takes a turn for the worse, burdened by the lagged effects of aggressive hikes and the adverse impact of the banking sector turmoil. When this happens, gold will be well-placed to stage a strong rally.

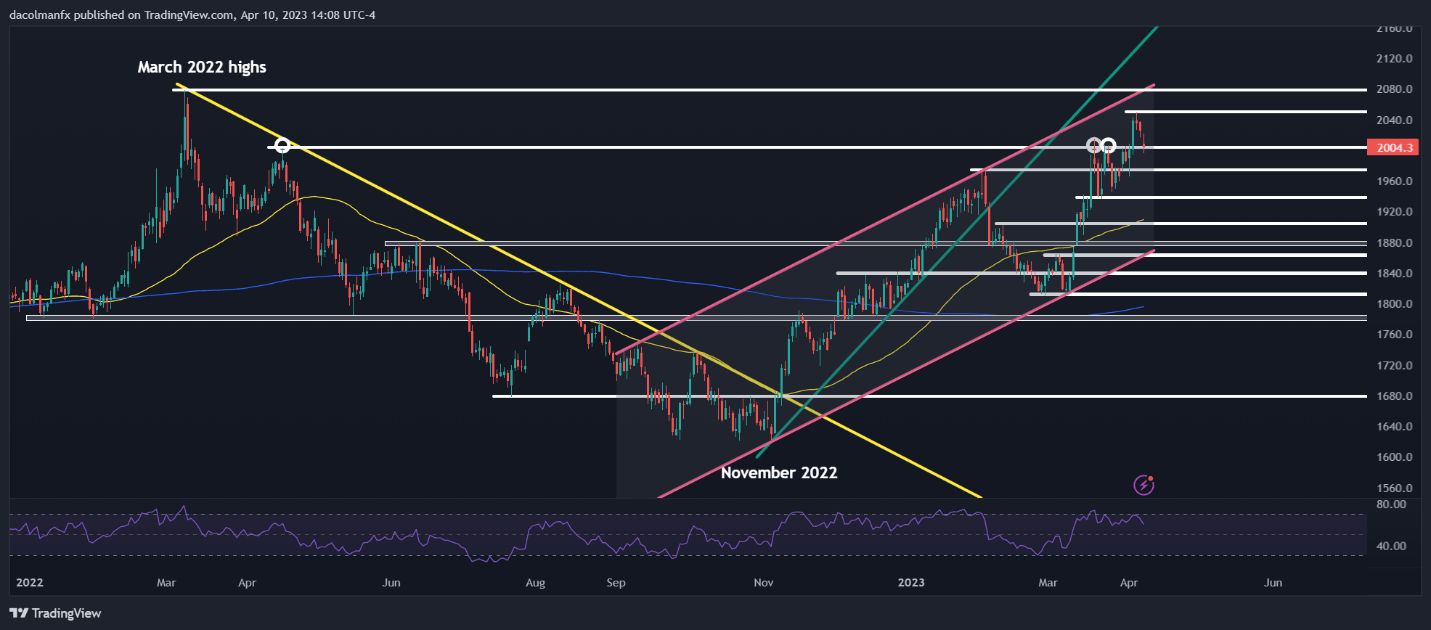
Focusing price-action analysis, XAU/USD is currently hovering above key technical support at $2,000 following its recent pullback. If this floor is taken out convincingly, sellers could launch an attack on $1,975, followed by $1,940.

On the flip side, if bulls regain control of the market and spark a rebound from present levels in short order, the first resistance to keep an eye on is located at $2,050 near April’s swing high. If prices manage to breach this ceiling, buying interest could pick up momentum, setting the stage for a climb toward $2,075, gold’s all-time peak.

GOLD PRICES TECHNICAL CHART

Chart, line chart, histogram  Description automatically generated


US Dollar Extends Rise as Liquidity Comes Back and Markets Absorb NFP Report

US Dollar Extends Rise as Liquidity Comes Back and Markets Absorb NFP Report

Asia-Pacific Market Briefing – Markets Fully Absorb NFP Print from Last Week

The US Dollar aimed higher against its major counterparts on Monday, extending a recent streak of cautious gains. Its performance could be traced back to Friday when another solid US non-farm payrolls report crossed the wires. During that time, Wall Street was offline for the Good Friday holiday, meaning the complete reaction wouldn’t be fulfilled until liquidity was restored over the past 24 hours.

236k jobs were added in March, slightly higher than the 230k consensus. This marked a slowdown from February’s revised 326k print. Meanwhile, the unemployment rate unexpectedly dipped to 3.5% instead of holding steady at 3.6%. This was while the labor force participation rate increased to 62.6% from 62.5%. That hinted that the economy was able to absorb the increase in workers without sacrificing a rise in unemployment.

The key takeaway from the jobs report was that another 25-basis point rate hike from the Federal Reserve is likely in the cards for May’s policy announcement. In response, Treasury yields have been rising since the jobs report. Still, Wall Street remained unperturbed. By the end of Monday, the Dow Jones and S&P 500 finished higher. Meanwhile, the tech-heavy Nasdaq Composite was practically unchanged.

Looking to Tuesday’s Asia-Pacific trading session, the most prominent economic print on the docket is Chinese inflation figures (both CPI and PPI) for March. Given China’s recovery from its Covid-zero strategy, investors will be watching if these figures could show signs of rising price pressures, which could be indicative of an accelerating economy.

US Dollar Technical Analysis

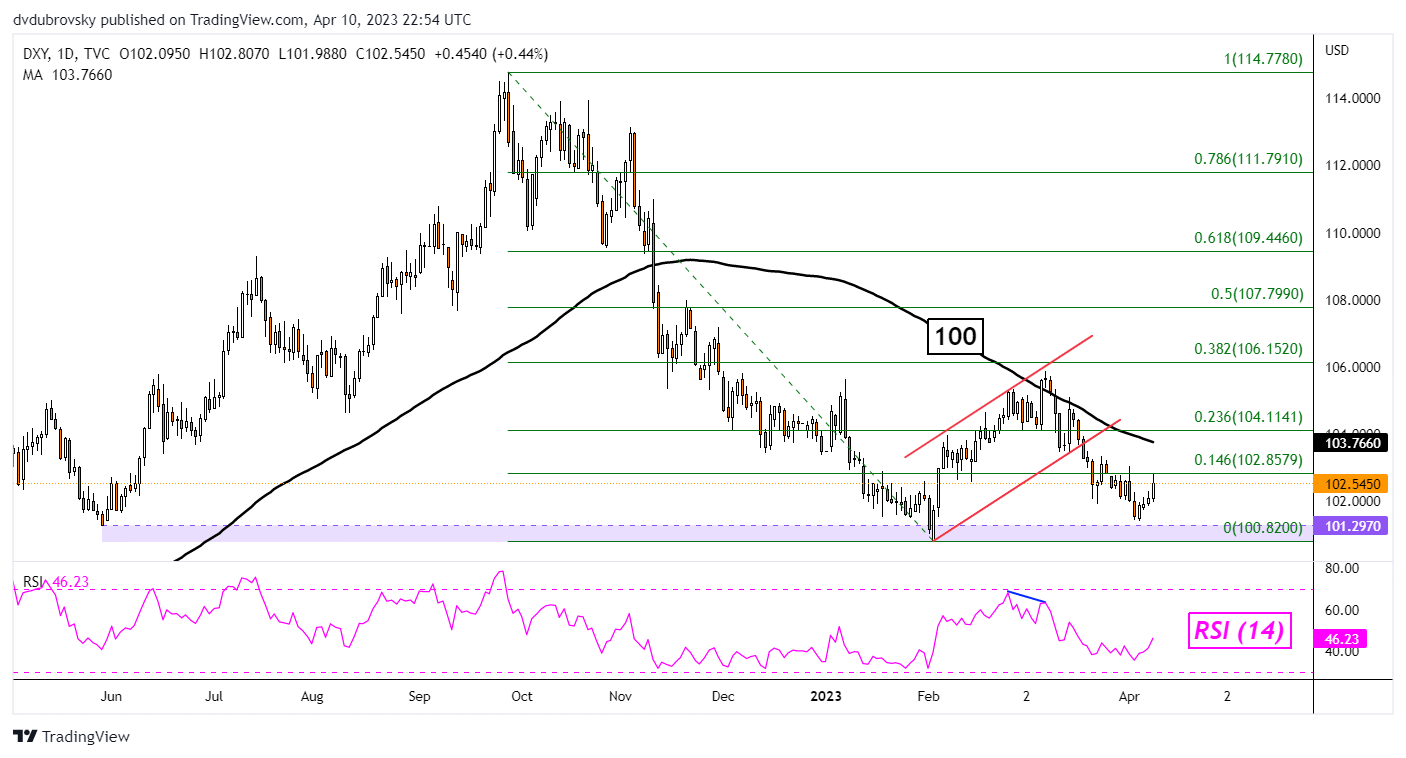
Looking at the DXY Dollar Index, we can see that the greenback is aiming higher after prices turned just above the critical 101 – 101.29 support zone. This could open the door to extending gains, but the 100-day Simple Moving Average (SMA) remains above. It could hold as resistance, maintaining the downside focus (as it did on a couple of occasions in March).

DXY Daily Chart

DXY Daily Chart

Trading Economic Data Means Looking Past the Numbers

Trading Economic Data Means Looking Past the Numbers

Economic Data, Foreign Exchange Trading, Central Banks – Talking Points

The foreign exchange market’s reaction to economic data is one of the most important subjects for traders to consider, but also one of the most vexed.

The monthly round of official and private releases from around the world covers everything from inflation and employment to the forward-looking views of corporate purchasing managers. Together with central bank pronouncements, it forms what we might call the framework of foreign exchange trading.

Major Economic Releases Can Dominate Trade

Markets may well hunker down, losing both volume and volatility, in the run-up to an eagerly anticipated number. Official US labor market statistics are perhaps the most obvious example here. When the trading community expects serious gains or crushing losses the session can be subdued from Asia’s open and right across Europe as participants nurse suspicions or hopes. Even when the market expects neither many traders will – in financial journalism’s enervating cliché – “wait and see.”

This makes sense of course, enervating or not. Obviously, there’s a link between the economic performance of a country with a freely floating currency and the performance of that currency against its peers. At the most basic level a strong piece of economic data will boost a currency, a weaker one will tend to see it fall.

However, to take the matter no further would be a grave error. For one thing, individual pieces economic data tend to influence currencies in a very fleeting way. The gains provided by even a blockbuster, expectation-shattering number can be undone by the end of a day’s session, and well before that in some cases. It may even mean no more than a few minutes’ spike one way or another.

So, there’s clearly more to know about data and its effects.

The first and perhaps most important thing is that, while data provide the rhythm, the world moves to a monetarist cadence and central banks will always play lead. So, ultimately, the longer-term effects any piece of economic news must be considered with a view to how it might change monetary policy. No single data release is ever likely to do that, and markets would have caused to worry if it did. Central banks like to be ahead of the numbers, ready to tighten or loosen policy as needed before trends turn.

Therefore, we might see the markets only very briefly cheer strong retail sales, say, or powerful job creation. They might be great for the politicians, but, if inflation remains docile, they might not mean anything at all in terms of central bank policy changes. And if rates aren’t going up or coming down, then the longer-term effect of the data on the currency won’t amount to much.

Of course, these days docile inflation is little more than a happy memory across much of the world as war in Ukraine boosts both food and fuel prices at a time when post-Covid supply chain storms are still raging.

Currencies Can Fall Even When Interest Rates Rise

In July of this year, the United States Federal Reserve delivered a three-quarter point interest rate rise, something which would have been considered extraordinary monetary action for most of the past thirty years. And yet the US Dollar actually lost ground by the end of the session for, in its post-rate-hike remarks, the Fed left markets reasonably sure that future actions were going to be a lot more measured.

So, we can on occasion see the phenomena of a ‘dovish’ rate hike, or even a ‘hawkish’ rate cut. That’s when a central bank takes action but strongly implies that it has finished doing so, or that the barrier to more is extremely high. Higher interest rates have not been terribly helpful to rare-breed Sterling bulls this year either. The United Kingdom’s political and economic turmoil has left the market wondering if its economy can bare higher borrowing costs. The US certainly looks much better placed to do so.

With all this in mind, merely watching and reacting to pieces of economic news is unlikely to make for a satisfactory trading strategy. Indeed, the Dollar’s broad gains this year have rendered data watching all-but meaningless in many countries. Their currencies have fallen against the Greenback regardless of the numbers as the US currency reveals itself as the ultimate safe-haven play.

Competent traders know where the market is focused and where in the business cycle we are. What that tends to mean in practice is which specific data releases are most likely to trigger changes in the monetary mood music.

These can change dramatically over time. Older readers may well recall the days when western industrial production figures were the ones to watch for the best central bank steer. In more recent times unemployment figures took over. Policymakers were leery of wage inflation and, poised to “withdraw the punchbowl” if the labor market party showed any sign of getting out of hand.

Now of course inflation figures themselves are perhaps the ones which traders look at most obsessively, with prices’ stubborn elevation. One day, the focus will move on again. It always does. But a nuanced approach to trading economic data should remain a constant.

Natural Gas Price Setup: Downward Pressure is Abating

Natural Gas Price Setup: Downward Pressure is Abating

NATURAL GAS TECHNICAL OUTLOOK: BULLISH

Natural gas prices are holding above strong support, raising the prospect of at least some consolidation / minor rebound as the downward momentum is fading.

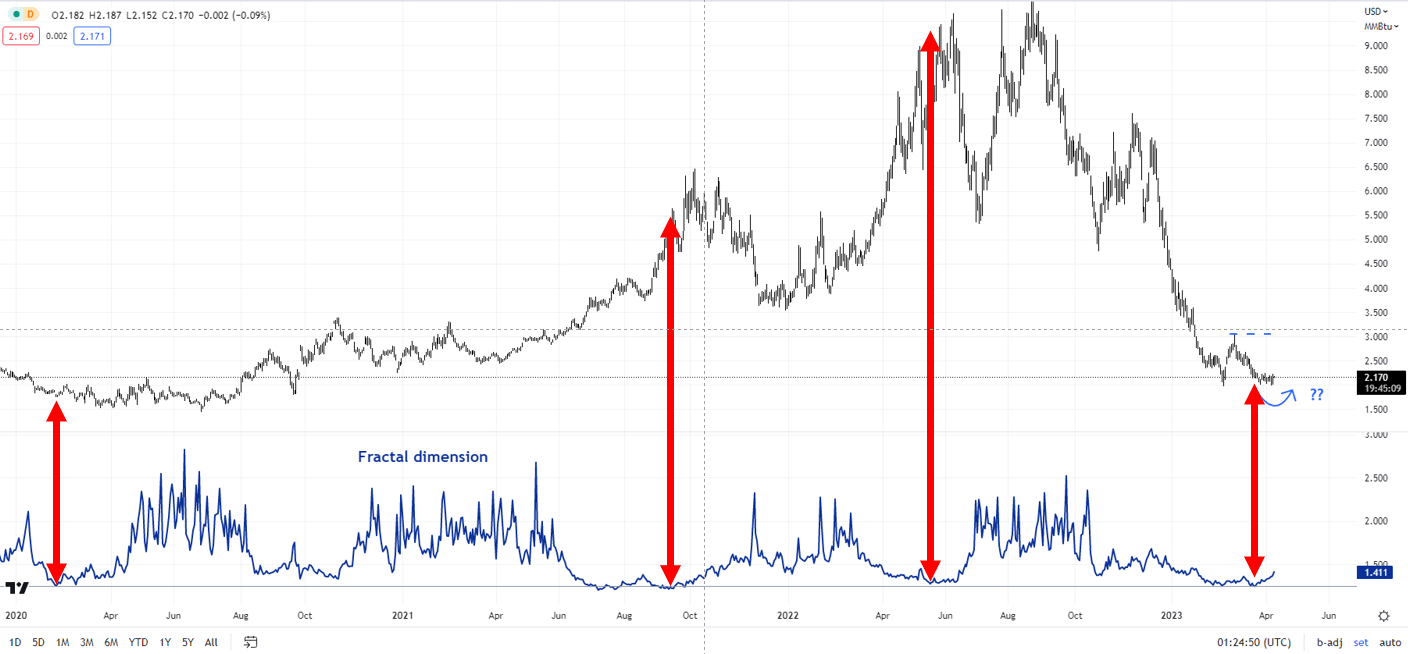
Market diversity as measured by fractal dimensions appears to be low as natural gas retests multi-month lows. Fractal dimensions measure the distribution of diversity. When the measure hits the lower bound, typically 1.25-1.30 depending on the market, it indicates extremely low diversity as market participants bet in the same direction, raising the odds of a price reversal. For natural gas, the 65-day fractal dimension fell below the threshold of 1.25, flashing a red flag. See “Natural Gas Price Action Setup: Is the Slide Overdone?”, published February 21 for more on the topic.

Natural Gas Daily Chart

image1.png

Chart Created by Manish Jaradi using Tradingview

A positive momentum divergence on the daily and weekly charts (ascending Relative Strength Index associated with a double bottom in natural gas) is a sign that the eight-month-long slide is losing momentum. Moreover, speculative short positioning has reduced sharply since March even as natural gas prices are hovering around 2.5-year lows.

So far, natural gas is holding above strong support at the February low of 1.97. Furthermore, the colour-coded daily candlestick charts show the most recent leg lower (from early March) is consolidation within the downtrend, and not the start of a fresh leg lower.

Natural Gas Daily Chart

image2.png

Chart Created by Manish Jaradi using Tradingview

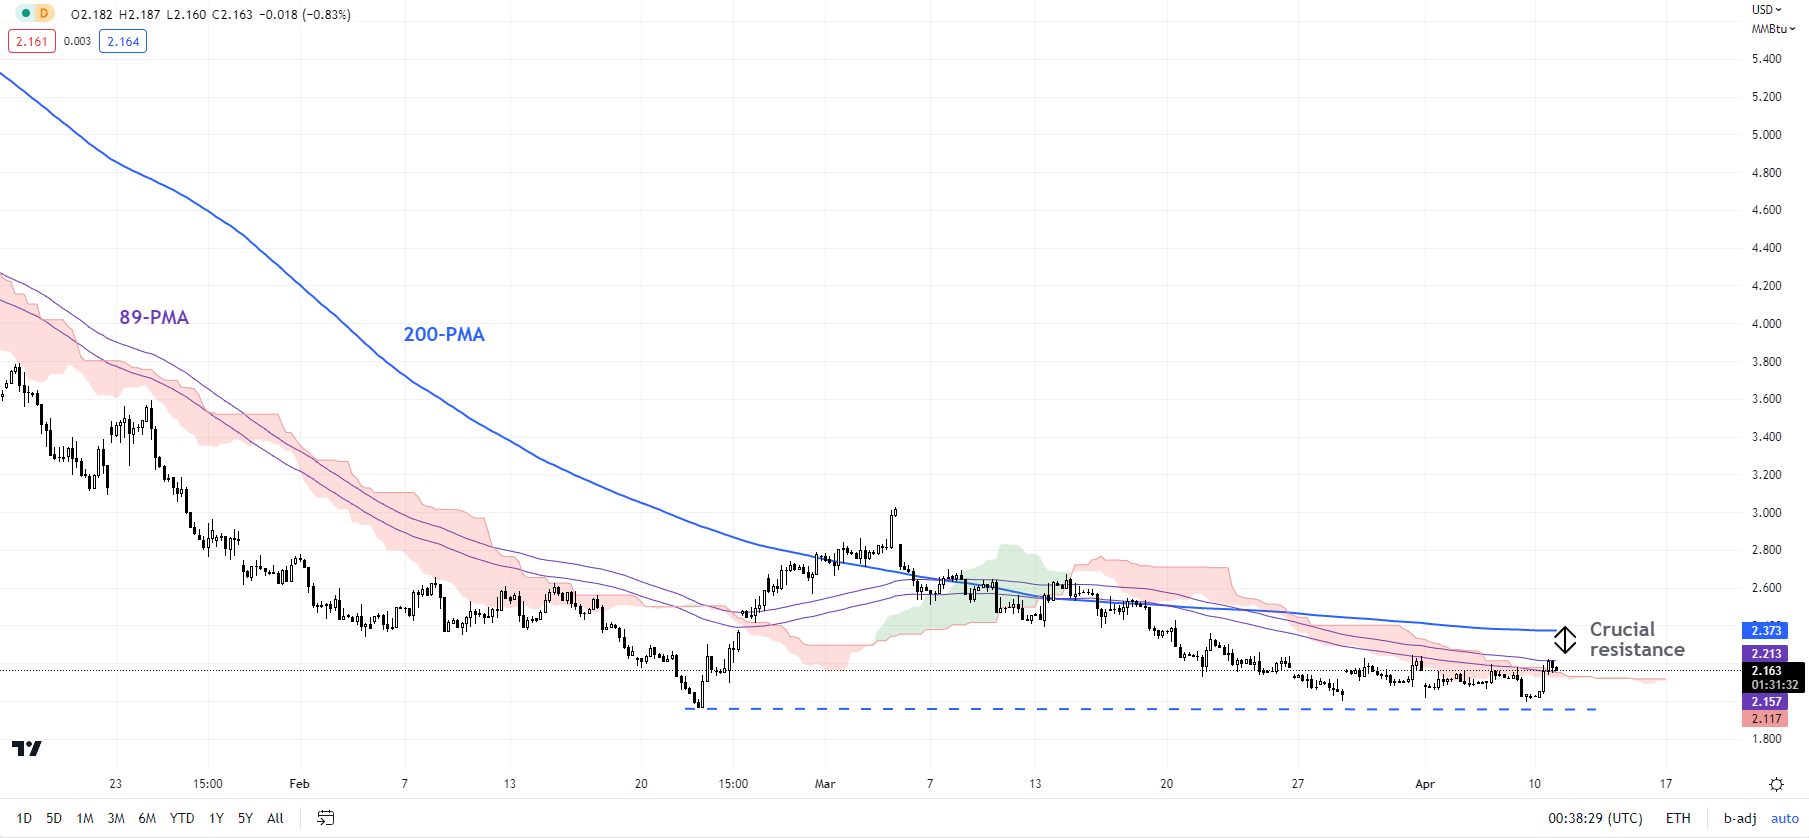
This suggests that the conditions for at least a short-term consolidation/minor rebound are getting ripe. To be fair, natural gas needs to clear the crucial resistance area around 2.25-2.40, including the 89-period moving average, the 200-period moving average, and the upper edge of the Ichimoku cloud on the 240-minute charts. A move above the resistance would raise the odds of a retest of the March high of 3.03. Any break above 3.03, would trigger a double bottom (the February and the March lows), potentially opening the way toward 4.00.

Natural Gas 240-minute Chart

image3.png

Chart Created by Manish Jaradi using Tradingview

On the downside, a drop below 1.97 could pave the way toward the 2020 low of around 1.45, also the target of a major double-top pattern (the 2022 highs) triggered at the end of last year.

Bitcoin Crosses the Key $30000 Mark. Will it Sustain?

Bitcoin Crosses the Key $30000 Mark. Will it Sustain?

BITCOIN TECHNICAL OUTLOOK – BULLISH

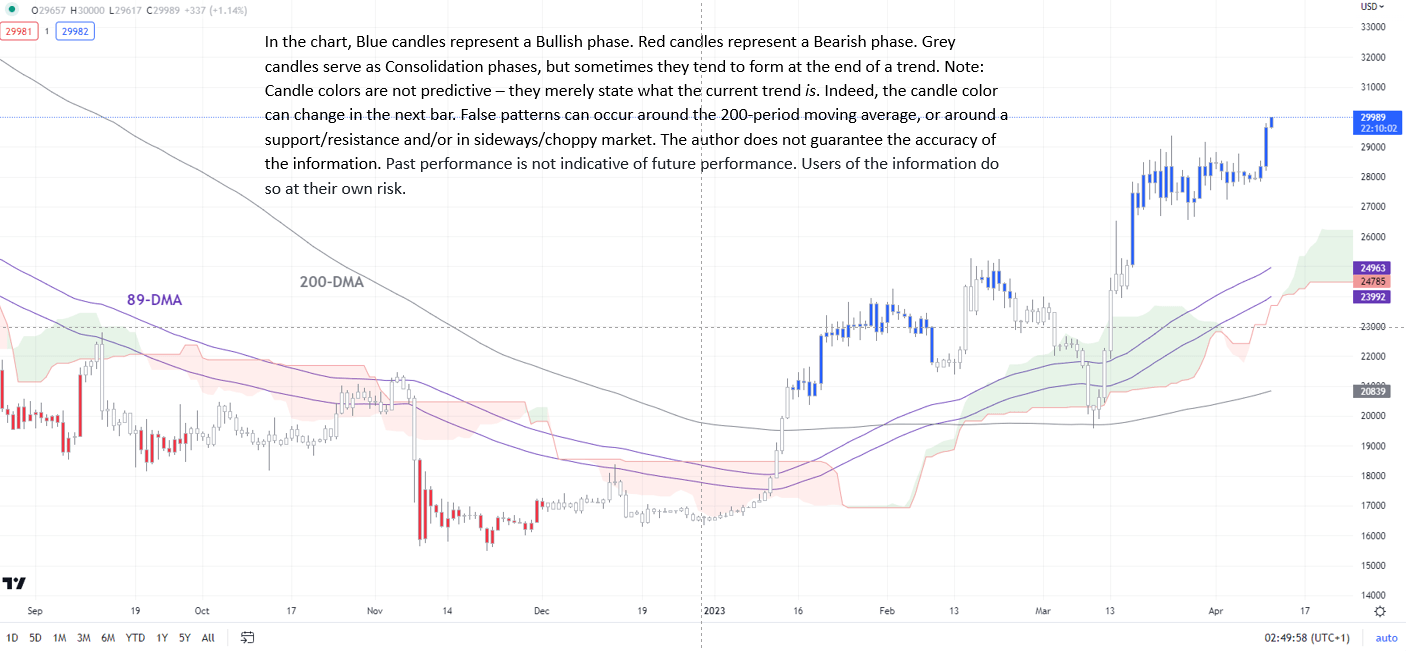
Bitcoin’s jump to a nine-month high is a sign that the medium-term downtrend in cryptocurrencies is changing. While the trend on the daily charts continues to be bullish, some short-term consolidation can’t be ruled out.

BTC/USD has crossed a vital barrier at the March highs of 28920-29175. The break has opened the way initially toward resistance on an uptrend line from January (now at about 30800) followed by the May 2022 high of 32375. From a trend perspective, Bitcoin turned bullish in January – see “Bitcoin Technical Outlook: BTC/USD Turns Bullish”, published January 18. The colour-coded candlestick charts, based on trend/momentum indicators, indicate BTC/USD remains in a bullish phase (see chart).

BTC/USD Daily Chart

image1.png

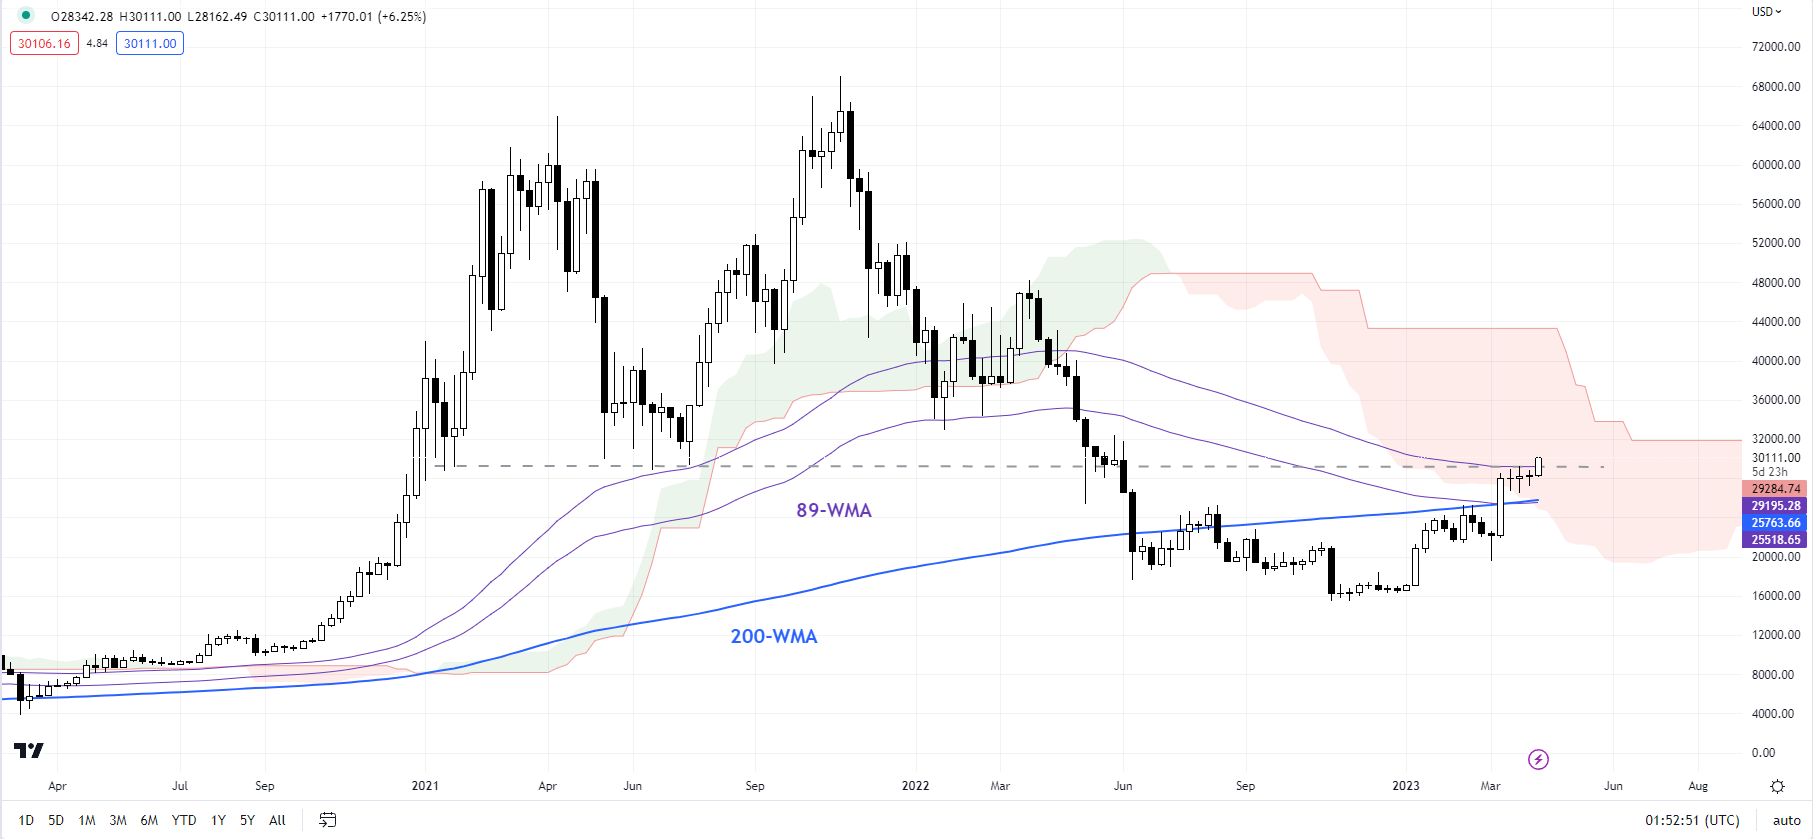
Importantly, the higher-top-higher-bottom sequence forming on the weekly charts indicates that the medium-term downward pressure is easing. This is further reinforced by the rise above the stiff hurdle on the 200-week moving average. For more discussion, see “Bitcoin Technical Outlook: Medium-Term Downward Pressure is Fading”, published March 30.The potential for a base building in cryptocurrencies was first highlighted in November, and the possibility of a reversal in the medium-term downward pressure was subsequentlyhighlighted in January.

BTC/USD Weekly Chart

image2.png

Chart Created by Manish Jaradi Using TradingView

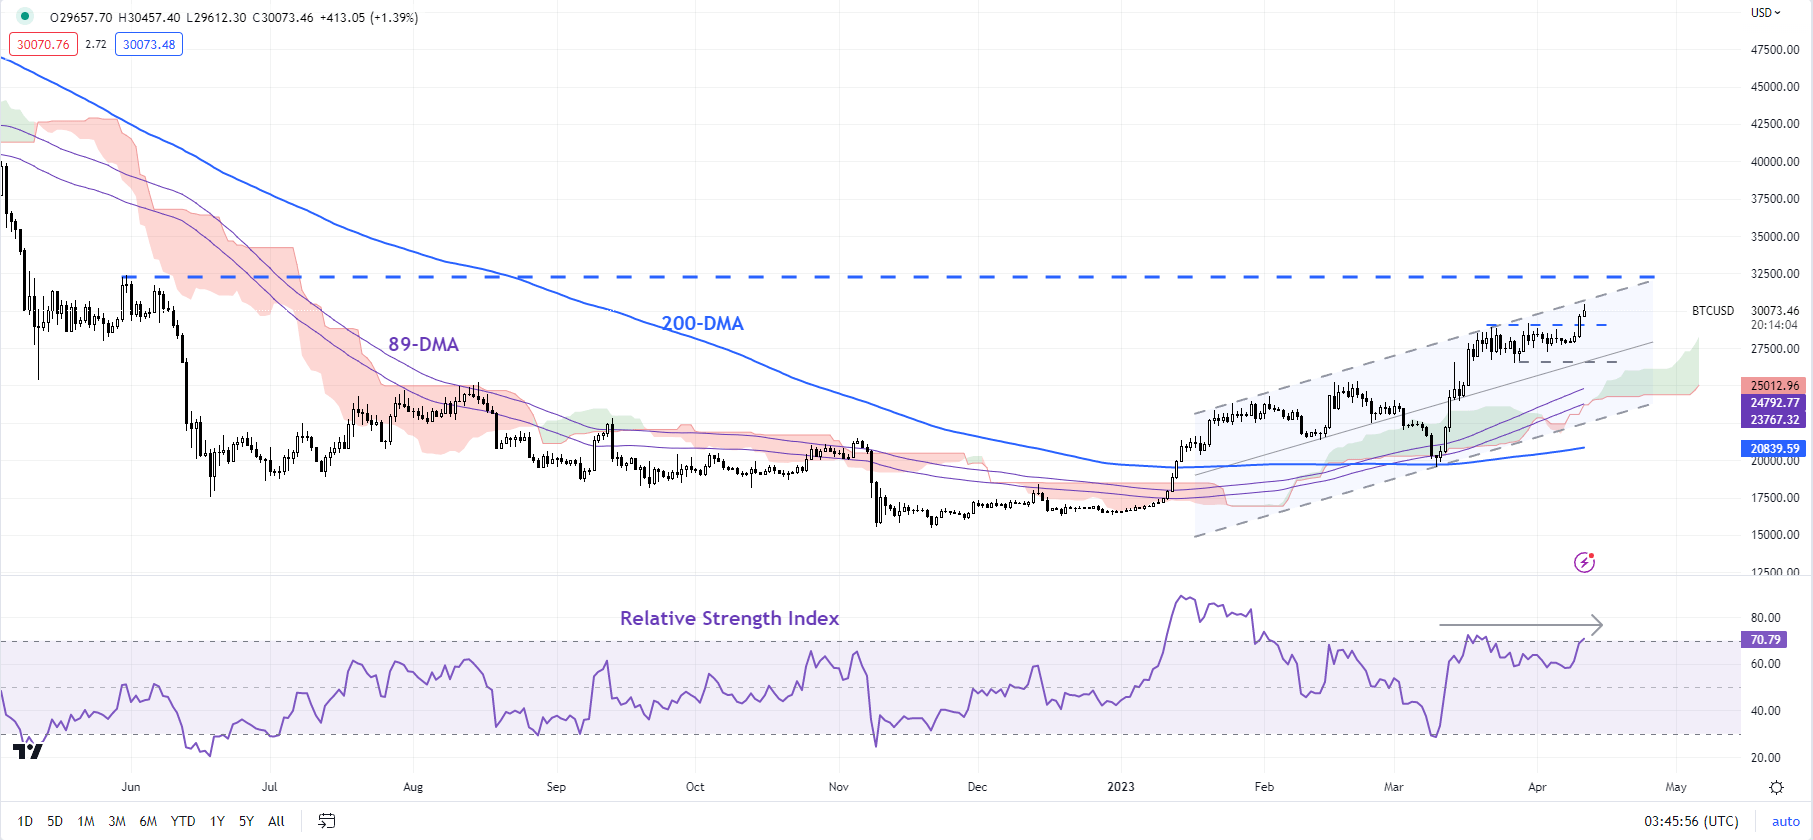
BTC/USD rose in Q1-2023 above the 200-day moving average, the 89-day moving average, and the lower edge of the Ichimoku cloud on the daily charts. The downward correction in March truncated at the 200-day moving average, further reinforcing the nascent uptrend.

BTC/USD Daily Chart

image3.png

Chart Created by Manish Jaradi Using TradingView

In the very near term, this week’s surge has come about on lower momentum, raising the prospect of minor fatigue in the rally, especially given the pace and the extent of the recent gains. Still, there is immediate support at the end-March low of 26525. Only a break below the support would indicate that the upward pressure had eased somewhat in the short term.

Q2 Trade Idea – Is it Time for Silver to Shine Brighter?

Q2 Trade Idea – Is it Time for Silver to Shine Brighter?

Is it Time for Silver to Shine Brighter?

Silver is continuing to benefit from the current economic backdrop as sticky, global inflation worries and recessionary fears continue to swirl. And with these worries likely to remain in the coming quarter, the price of silver could continue to move higher and test recent levels of resistance.

The daily chart shows silver’s positive performance since mid-March with the precious metal rallying around 17% off its March 10 swing low. This rally has seen silver trade through the 20-, 50- and 200-day moving averages, adding credibility to the move. A pattern of higher lows and higher highs remains in place with the next target seen just above $24.50. Above here, multi-month highs at $26.21 and $26.94 come into focus. The CCI indicator is currently showing silver as overbought so a period of consolidation may be required before the next leg higher.

Silver Daily Price Chart

image1.png

The silver /gold ratio also shows silver underperformance against gold since mid-December 2022 with only the recent rally breaking the pair out of the downward channel in the last couple of days. The pair have also moved above the 20-day moving average and near both the 50- and 200-day moving averages. A confirmed break above here would allow the silver/gold spread further room to move higher. The spread pair are also in overbought territory so as above a period of consolidation may be seen in the short term.

Silver/Gold Spread Daily Price Chart

image2.png

While both charts show the current move higher to be potentially overdone, both setups look positive for silver not just to move higher but for it to also outperform gold as well. The next three months may see silver shine even brighter.

Volatility May See Range Breaks across Markets but Trends Might be Short-Lived

Volatility May See Range Breaks across Markets but Trends Might be Short-Lived

Volatility May See Range Breaks across Markets but Trends Might be Short-Lived

Going into the second quarter, the macro environment for financial markets is characterized by stubbornly high inflation and an evolving banking crisis. Will volatility continue to evolve?

While separate, they are related. The ultra-loose monetary conditions of the pandemic era created circumstances that allowed for a large amount of spare capacity of liquidity. That led to building price pressures and excessive availability of capital that enabled risk-taking that would otherwise have been challenged by the market.

The inflation problem is well documented, but the unfolding banking crisis has created uncertainty around the viability of some institutions. The banks that have failed so far have done so for two different reasons. The first is the mismanagement of their balance sheets which saw a mismatch in assets and liabilities. Silvergate Bank, SVB Financial and Signature Bank could be in this category. The second is weak balance sheets that are exposed when financial conditions tighten to make capital harder to obtain and more expensive. Credit Suisse and Republic Bank could be in this category.

How many more impending collapses there might be is the great ‘known unknown’. Observing equity indices and FX, the long, drawn-out trends that prevailed through the pandemic era appear to be over for now.

Forex for BeginnersHowever, elevated volatility from this uncertainty can be seen across several asset classes. This scenario has seen ranges build over time and often break to one side before either establishing a new range or folding back inside the prior range.
In this type of trading conditions, false breaks could set up an opportunity. This type of trade requires robust risk management and is generally typified by smaller position sizes and wider stop loss parameters to allow for excess volatility when markets break the range.

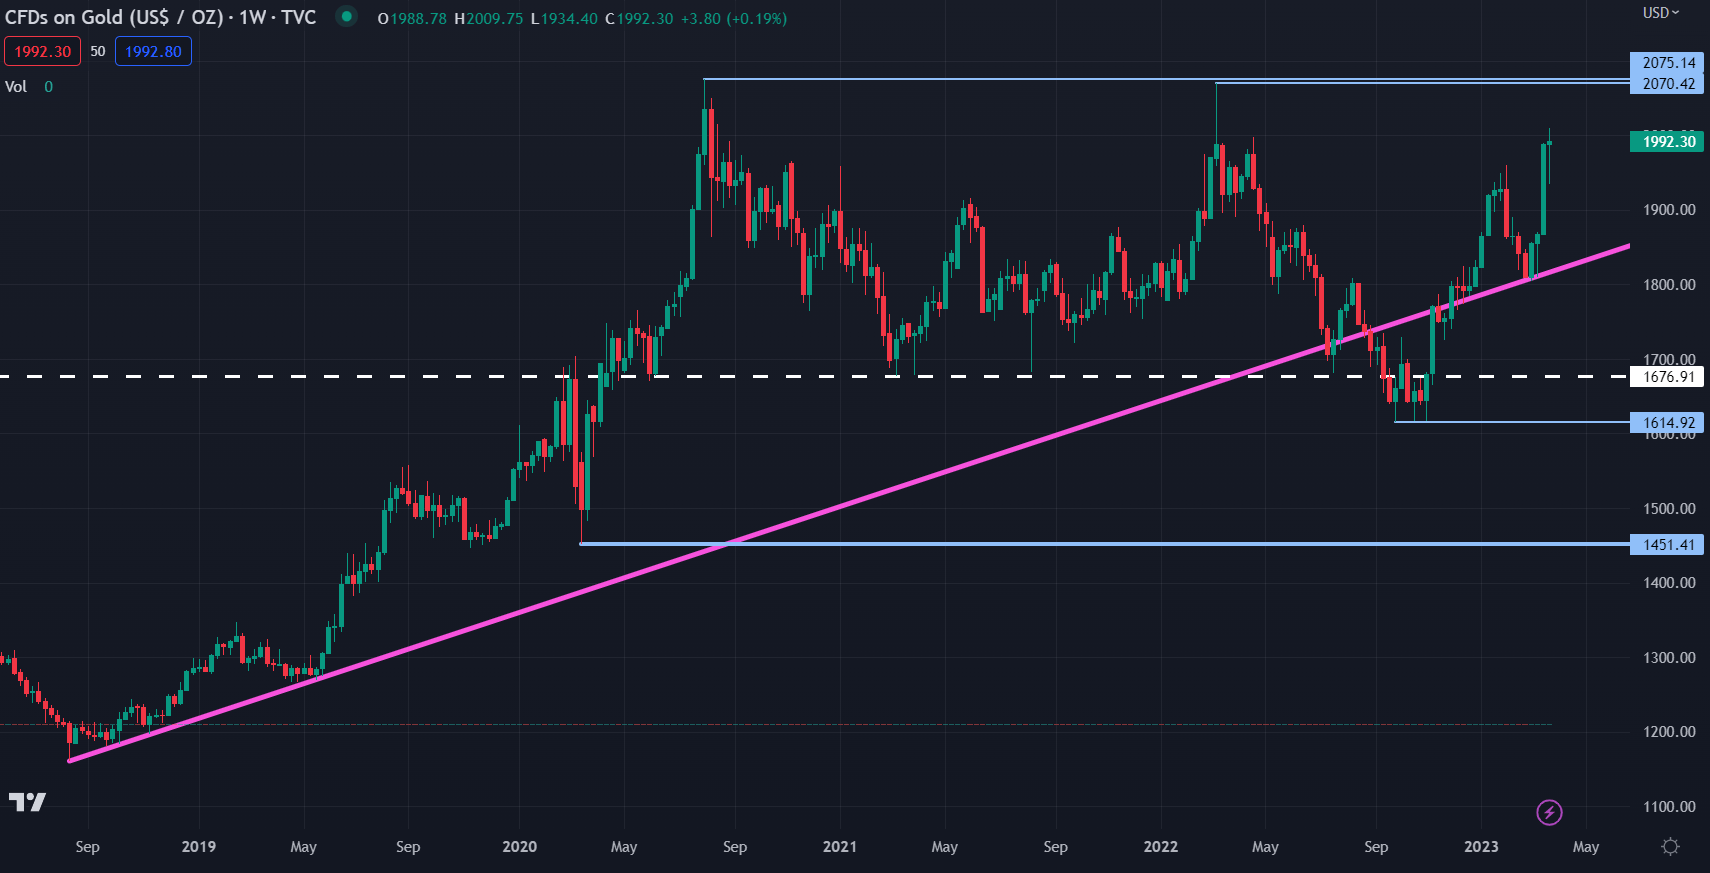
An example of this kind of market is gold. It has been in a wide range of 1,615 – 2,075 for almost 3 years. It broke below an ascending trend line and then broke below the prior low of the range at 1,677. It made a new low at 1,615 In September last year before rallying back inside the range.

This price action is difficult to trade as many stop losses were cleaned out to the downside and it was unclear if a new range was being established or not.

Looking at the topside, the peak in August 2020 of 2,075 was unable to be eclipsed in the rally of March 2022. This made a double-top formation.

The current price is heading toward that high and this may present an opportunity. If selling near the prior peaks. A small position size may allow for a higher stop loss level in the event of a false break.

It should be noted though that past performance is not indicative of future results.

GOLD CHART

image1.png

Chart created in TradingView

US CPI to guide Fed’s next move

US CPI to guide Fed’s next move

After the “goldilocks” US jobs data on Friday (resilient job gains and benign wage growth ie. not too hot, not too cold), the “will they, wont they” debate around the Fed raising rates at its next meeting at the start of next month will be further informed by fresh US CPI data released on Wednesday. The headline number has fallen for the last eight reports and more declines are expected. But the core month-on-month number will be key. Economists reckon the forecast 0.4% remains more than double the rate required over time to bring inflation back to the Fed’s 2% target.

Markets have been a lot more sensitive to soft data recently as growth and recession concerns have increased. Central banks around the globe are either pausing their rate hike cycle or getting close to the end. Those banks like the ECB and BoE who have signalled a readiness to continue have seen their currencies make strong year-to-date gains. This is highlighted by crosses like EUR/AUD and GBP/AUD which pushed to new cycle highs last week.

Focus will turn to the Bank of Canada meeting on Wednesday where policymakers are also expected to stand pat. Elevated wage data will likely bother the BoC who have noted previously that high earnings growth is inconsistent with regaining control of inflation. But the downside risks to global growth after the banking stress means interest cuts could be on the horizon. Guidance around the banking turmoil could inform on the BoC’s next move. The recent drop in USD/CAD stalled around key trend support in the low 1.34s. Resistance sits at 1.3526.

Major risk events of the week

12 April 2023, Wednesday:

-US CPI: The market median forecast for headline CPI is 0.3% in March, down one-tenth from the previous month. The annual reading is expected to remain unchanged at 6%. Analysts say shelter remains the key component with the gap between market measures and the CPI index continuing to widen.

-Bank of Canada Meeting After signalling a “conditional pause” at its meeting in March, the bank is expected to keep the policy rate at 4.5%. The labour market remains tight, with this week’s upside surprise in job gains while wage growth is still around 4-5%. But inflation fell more than expected due to lower energy costs.

-FOMC Minutes: The Fed voted unanimously to lift rates by 25bps. But policymakers softened their forward guidance and Powell said a tightening of credit conditions could weigh on activity. Any new insights into this shifting assessment of the economic backdrop will be crucial for the May Fed rate decision.

13 April 2023, Thursday:

–UK GDP: Analysts expect an expansion of 0.1% m/m in February after the 0.3% increase in January.  Economists say weaker construction and manufacturing growth weighed, but surveys picked up and retail sales rose robustly. That means many no longer expect a recession. In fact, some have recently raised their GDP forecasts for 2023. GBP has been the best performing major this year. But cable is battling with the 12.5 barrier with the December and January highs around 1.2446/47 adding to the resistance.

–ECB Meeting Minutes: The bank hiked rates by 50bps at its March meeting, amid the banking sector turmoil. It emphasised a data dependent approach but said inflation was projected to remain too high for too long. Focus will be on the path for future policy tightening and the debate between the hawks and doves. EUR/USD has been strong since the mid-March low at 10516. Dips are being bought but 1.10 is the key level to beat for bulls.

14 April 2023, Friday:

–US Retail Sales: Consensus forecasts a second straight fall of 0.4% in March, with core also seen falling. Last month’s decline was led by vehicles and furniture stores, while the sole services category also dipped. But spending is still being supported by the tight labour market which is seeing solid wage growth.

Yen sinks as rates outlook diverges; NZ dollar tumbles

Yen sinks as rates outlook diverges; NZ dollar tumbles

TOKYO: The yen sank against major peers on Monday after US payrolls data bolstered the case for further Federal Reserve rate hikes, highlighting a growing disparity with Japan where the central bank continues to pin the benchmark yield near zero.

Meanwhile, the risk-sensitive New Zealand and Australian dollars weakened amid heightened US-China tensions over Taiwan, with Beijing a key trading partner for the Antipodean nations.

The yen slipped 0.4% against the US dollar to 132.70, extending its decline from Friday, when data showed the US economy continued to add jobs at a brisk pace in March.

Ten-year Treasury yields reached 3.413% in shortened trading on Friday for the Easter holiday.

The yield remained elevated at 3.3719% in Tokyo on Monday, when many markets in Asia as well as Europe will remain closed.

Against the euro, the yen slumped over 0.5% to 144.635. It fell roughly 0.3% versus sterling.

The dollar strengthened against the yen because of the continued strong growth in the US labour market despite inflation and sharp interest rate rises, Mizuho analysts Masafumi Yamamoto and Masayoshi Mihara wrote in a client note.

“Yields in places like the euro area, Britain and Australia will follow US yields higher, so there won’t be a big widening of the yield gap,” they said.

“Relative to them, yield spreads will see a much bigger impact in Japan.”

However, the increase in jobs was less than the prior month and the rise in average hourly wages was less than economists forecast, which the Mizuho analysts said was not consistent with a sustained rise in US yields.

Barring an upside surprise in US consumer price data on Wednesday, the dollar has limited room to rise against the yen from current levels, they added.

Dollar on the defensive as banking fears ebb; yen drops

New Bank of Japan Governor Kazuo Ueda takes over from Haruhiko Kuroda on Monday, and is widely expected to keep massive stimulus in place for the time being.

He will give an inauguration speech at 7:30 p.m.

JST (1030 GMT). Meanwhile, the New Zealand dollar slumped about 0.7% to $0.62325, and the Aussie slipped 0.13% to $0.6665. Stock and bond markets in both countries are closed for the Easter Monday holiday.

The dollar edged 0.05% higher to 6.8784 yuan in offshore trading.

China began three days of military drills on Saturday simulating precision strikes against Taiwan, the day after Taiwan President Tsai Ing-wen returned from a brief visit to the United States.

In other currencies, sterling slipped 0.02% to $1.2410, while the euro gained 0.02% to $1.0899.

USD/JPY Bulls to Target 133 on Hawkish Fed Bets

USD/JPY Bulls to Target 133 on Hawkish Fed Bets

It was a relatively quiet morning for the USD/JPY. February current account figures from Japan drew interest this morning. However, trading volumes are on the light side, with several markets closed for Easter Monday.

The current account balance rose from a ¥1.989 trillion deficit to a ¥2.197 trillion surplus in February. Economists forecast a ¥2.536 trillion surplus. However, the adjusted current account surplus jumped from ¥20.360 trillion to ¥108.920 trillion versus a forecasted ¥1.430 trillion.

Trading Derivatives carries a high level of risk to your capital and you should only trade with money you can afford to lose. Trading Derivatives may not be suitable for all investors, so please ensure that you fully understand the risks involved, and seek independent advice if necessary. A Product Disclosure Statement (PDS) can be obtained either from this website or on request from our offices and should be considered before entering into a transaction with us. Raw Spread accounts offer spreads from 0.0 pips with a commission charge of USD $3.50 per 100k traded. Standard account offer spreads from 1 pips with no additional commission charges. Spreads on CFD indices start at 0.4 points. The information on this site is not directed at residents in any country or jurisdiction where such distribution or use would be contrary to local law or regulation.

While the stats drew interest, further market reaction to the US Jobs Report and increased bets of a 25-basis point Fed interest rate hike supported a USD/JPY breakout this morning.

Later this morning, consumer confidence figures from Japan will also be in focus. However, the numbers are unlikely to force a dollar retreat.

USD/JPY Price Action

This morning, the USD/JPY was up 0.39% to 132.646. A mixed start to the day saw the USD/JPY fall to an early low of 131.832 before rising to a high of 132.649. The USD/JPY broke through the First Major Resistance Level (R1) at 132.501.

USD/JPY on the move.
USDJPY 100423 Daily Chart

Technical Indicators

The USD/JPY needs to avoid a fall through R1 (132.501) and the 132.012 pivot to target the Second Major Resistance Level (R2) at 132.865. A move through the morning high of 132.649 would signal a bullish USD/JPY session. However, Fed chatter must support an extended USD/JPY breakout.

In the case of an extended rally, the bulls would likely test resistance at 133.00 but fall short of the Third Major Resistance Level (R3) at 133.718.

A fall through R1 and the pivot would bring the First Major Support Level (S1) at 131.648 into play. However, barring a dollar sell-off, the USD/JPY pair should avoid sub-131.5 and the Second Major Support Level (S2) at 131.159. The Third Major Support Level (S3) sits at 130.306.

USD/JPY resistance levels in play.
USDJPY 100423 Hourly ChartLooking at the EMAs and the 4-hourly chart, the EMAs send a bullish signal. The USD/JPY sits below the 200-day EMA (132.770). The 50-day EMA closed in on the 100-day EMA, with the 100-day EMA narrowing to the 200-day EMA, delivering bullish signals.

A USD/JPY move through the 200-day EMA (132.770) would support a breakout from R2 (132.865) to give the bulls a run at 133. However, a fall through the 100-day (132.335) and 50-day (132.017) would bring S1 (131.648) into view. A fall through the 50-day EMA would send a bearish signal.

EMAs are bullish.
USDJPY 100423 4 Hourly Chart

The US Session

Looking ahead to the US session, it is a quiet day on the US economic calendar. There are no US economic indicators for investors to consider.

The lack of stats will leave the US Jobs Report and hawkish Fed bets to deliver USD/JPY support. However, investors should track Fed chatter throughout the session.