EUR/USD edges lower on Good Friday, United States Nonfarm Payrolls eyed

EUR/USD edges lower on Good Friday, United States Nonfarm Payrolls eyed

Euro bulls take a breather as the EUR/USD pair sits around 1.0920, awaiting the key United States employment numbers during early Friday. In doing so, the Euro pair also bears the burden of the Good Friday holidays in the major Western markets, including Europe.

It’s worth noting, however, that the comparatively more hawkish bias for the European Central Bank (ECB) than the Federal Reserve (Fed) keeps the EUR/USD on the way to posting the third consecutive weekly gain, despite recent recession woes.

Euro cheers upbeat data

EUR/USD remains firmer overall as the latest data from Germany and the Eurozone appear to keep the European Central Bank (ECB) hawks on the table, unlike their US counterparts.

That said, Germany’s Industrial Production (IP) rose 0.6% YoY in February versus -2.7% market forecasts and -1.6% previous readings. The monthly figures also came in firmer than 0.1% expected, to 2.0% versus 3.7% prior. On Wednesday, Germany Factory Orders improved to -5.7% YoY for February from -12.0 revised down prior and -10.5% market forecasts while the MoM growth came in at 4.8% compared to 0.3% expected and 0.5% previous readings.

On a broader front, Eurozone S&P Global Composite PMI eased to 53.7 in March versus 54.1 first readings whereas Services PMI also declined to 55.0 during the stated month from 55.6 preliminary forecasts.

Elsewhere, the US Initial Jobless Claims improved to 228K for the week ended on March 31 versus 200K expected and upwardly revised 246K prior. It’s worth noting that the Challenger Job Cuts for the said month rose to 89.703K from 77.77K prior. Previously, US JOLTS Job Openings dropped to the 19-month low in February while the ADP Employment Change for March also disappointed markets with 145K figures. Further, the US ISM Services PMI for March also amplified pessimism as it dropped to 51.2 versus 54.5 expected and 55.1 prior.

European Central Bank policymakers appear more hawkish than Federal Reserve talks

Considering the upbeat data, European Central Bank (ECB) Chief Economist Philip Lane signaled in a university lecture in Cyprus that the May decision depends on three factors, namely inflation outlook, underlying dynamic and how quickly these interest rate increases are restricting the economy and bringing down inflation.” The policymaker also said that due to these reasons they haven’t indicated or pre-announced what the expectation is for the next meeting or the upcoming meetings.

On the other hand, St. Louis Federal Reserve President James Bullard said on Thursday he thinks inflation is going to be sticky going forward.

With the comparatively more hawkish ECB policymaker’s tone, the EUR/USD remains firmer ahead of the key data.

Recession woes challenge Euro buyers

It should be noted that the Federal Reserve’s (Fed) preferred gauge of economic health cited the recession woes and put a floor under the EUR/USD prices. “Research from the Fed has argued that the ‘near-term forward spread’ comparing the forward rate on Treasury bills 18 months from now with the current yield on a three-month Treasury bill was the most reliable bond market signal of an imminent economic contraction,” per Reuters.

On the same line are comments from International Monetary Fund (IMF) Managing Director Kristalina Georgieva who said in her prepared remarks on Thursday that she expects the global economy to grow by less than 3% in 2023, down from 3.4% in 2022, per Reuters.

All eyes on United States employment numbers

Given the recently downbeat US employment clues, as well as the hopes of no rate hikes from the Federal Reserve (Fed), today’s US jobs report for March becomes crucial even as the Good Friday holiday is expected to limit the EUR/USD pair’s reaction to data.

Market forecasts suggest a softer print of the headline Nonfarm Payrolls (NFP), to 240K from 311K prior, as well as no change in the Unemployment Rate of 3.6%. However, the mixed expectations for the Average Hourly Earnings make the outcome even more interesting.

EUR/USD technical analysis

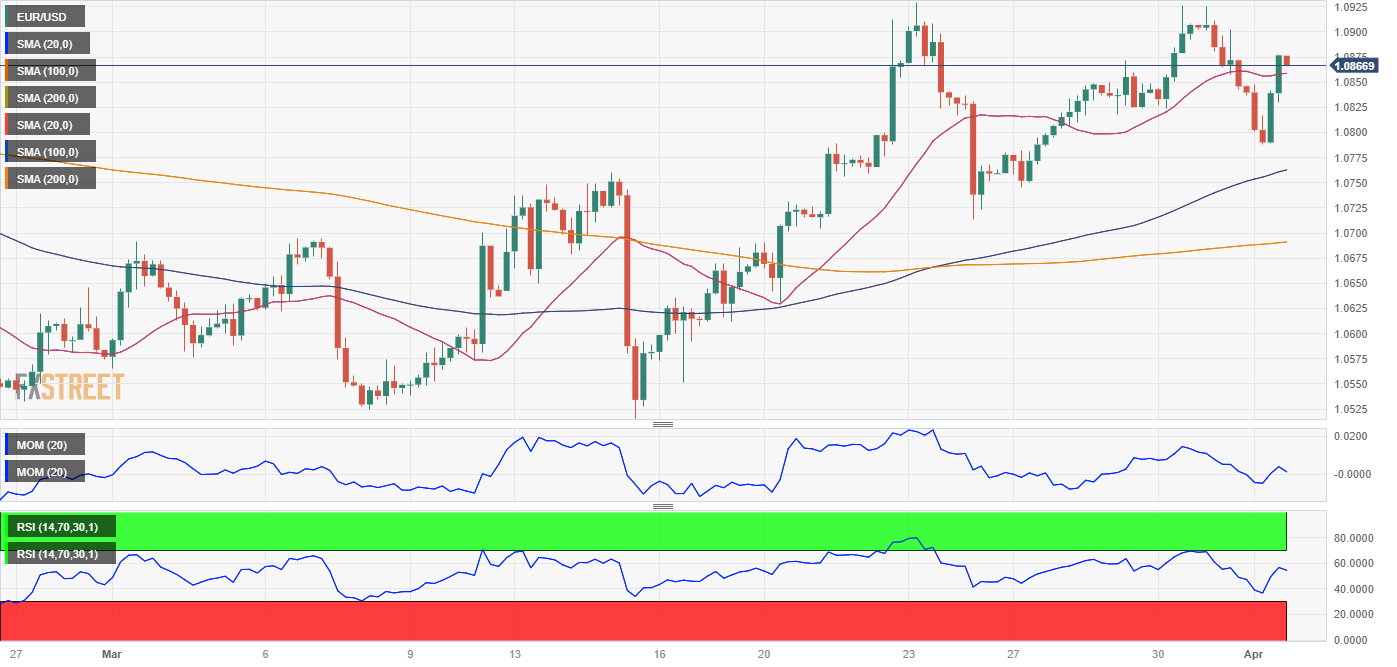
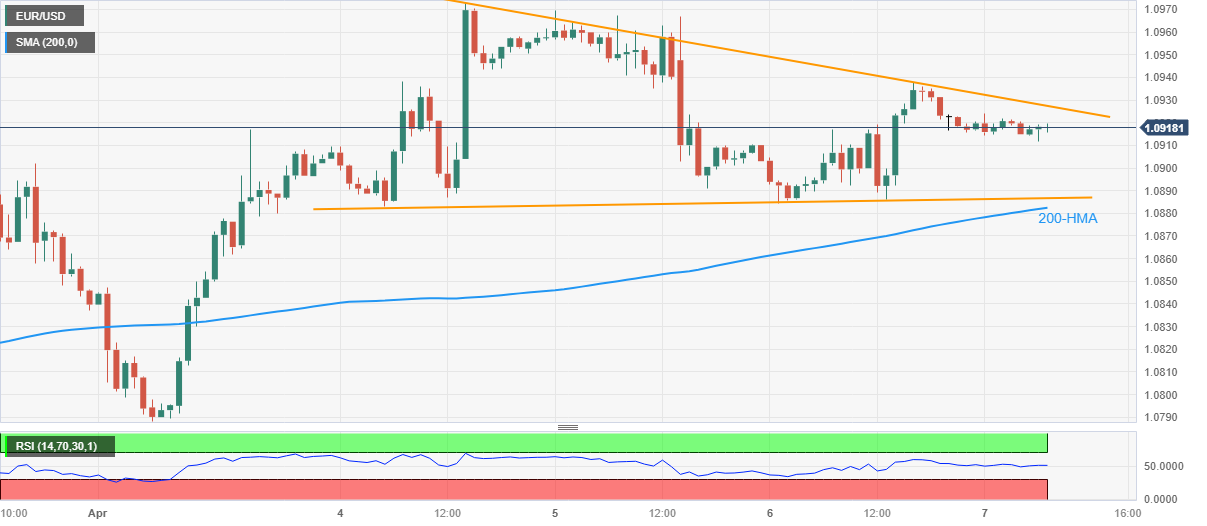
EUR/USD stays within a three-day-old descending triangle chart pattern, suggesting further upside on the bullish breakout.

Adding strength to the hopes of witnessing further Euro gains is the steady Relative Strength Index (RSI) line, placed at 14, not to forget the quote’s successful trading above the 200-Hour Moving Average (HMA).

That said, the EUR/USD bulls need validation from 1.0930 to retake control.

Following that, the latest peak of 1.0973 and the yearly high of around 1.1035 can test the Euro buyers ahead of directing them to the March 2022 high of near 1.1185.

Meanwhile, a downside break of the 1.0885 level comprising the triangle’s lower line will defy the bullish chart pattern and can lure the EUR/USD bears. Even so, the 200-HMA level of 1.0880 can act as an extra filter towards the south before delivering the quote to the bear’s door.

EUR/USD: Hourly chart
Trend: Further upside expected

Week ahead: The Big three – TDS

Week ahead: The Big three – TDS

Analysts at TD Securities (TDS) offer a sneak peek of the top three market-moving events due on the cards next week.

Key quotes

“US CPI: Core prices likely cooled off modestly in March, with the index still rising a strong 0.4% m/m, as we look for recent relief from goods deflation to turn into inflation this month. Shelter prices likely remained the key wildcard, while slowing gas prices and softer food-price gains will likely dent non-core inflation. Our m/m forecasts imply 5.1%/5.6% y/y for total/core prices.”

“BoC rate decision: We look for the BoC to hold at 4.50% in what should be an easy decision, with recent banking stress removing some pressure after the rebound in Q1 GDP. The more interesting element will be how the Bank incorporates banking stress in the April MPR. Balancing stronger growth and a more ominous outlook should result in a mixed tone, but one that supports the conditional pause.”

“FOMC Minutes: The rate hike at the March FOMC meeting was widely viewed as dovish. The distribution of the March dot plot for 2023, however, suggested a more hawkish sentiment across the FOMC. With banking stress now appearing to be somewhat contained, the minutes for this meeting might emphasize this hawkish sentiment given continued elevated inflationary pressures.”

Reserve Bank of India: A surprise pause, but not a pivot – ANZ

Reserve Bank of India: A surprise pause, but not a pivot – ANZ

Economists at Australia and New Zealand bnaking group (ANZ) provide their afterthoughts on the Reserve Bank of India’s (RBI) surprise policy move on Thursday.

Key quotes

“The monetary policy committee (MPC) delivered a surprise pause against expectations of a 25bp hike, citing a need to assess the impact of previous hikes amid an uncertain economic environment.”

“For FY24, the growth forecast was nudged up by 10bps to 6.5% and the inflation projection trimmed by 10bps to 5.2%. Lower oil price assumption was cited as the reason for the improved growth-inflation outlook.”

“We believe that India’s rate hike cycle is over for now. However, by maintaining its “withdrawal of accommodation” stance, the MPC has preserved the scope for further hikes, if needed. Upside inflation risks from a surge in oil prices and poor monsoon will be on our radar.”

EUR/USD sidelined above 1.0900 ahead of US NFP

EUR/USD sidelined above 1.0900 ahead of US NFP

EUR/USD is treading water above 1.0900, capped by the 1.0930 key hurdle on Good Friday. The pair is sidelined by holiday-thinned market conditions while the US Dollar clings to gains amid pre-US Nonfarm Payrolls anxiety.

The EUR/USD managed to remain above 1.0880 and climbed to 1.0930, showing that the bullish outlook holds. However, the pair faces strong resistance ahead and the momentum is fading. The daily chart shows the Euro firm above bullish key Simple Moving Averages (SMA) and still looking at 1.1000.

The 4-hour chart shows technical indicators offering no clear clues as the pair stays in a consolidation phase that will likely continue during Asian hours. A slide below 1.0880 should set the stage for an extension of the downward correction, probably to the 1.0840 zone. On the upside, gains above 1.0950 seem unlikely over the next session.

The EUR/USD rose on a quiet day, retaking 1.0900 and even reaching 1.0935  before Nonfarm Payrolls and ahead of the Easter holiday. The Euro outperformed while the DXY moved sideways.

On Thursday, Germany reported a 2% increase in Industrial Production in February, in line with the 4.8% gain in Factory Orders released on Wednesday. In addition, data released in the US showed a decline in Initial Jobless Claims to 228,000 after seasonal adjustments, adding to figures that point to a looser labor market.

Friday’s NFP data will be critical and the only game in town until Tuesday. Market consensus is for a 240,000 increase and for the Unemployment rate to stay at 3.6% in March. Expectations of another rate hike from the Federal Reserve (Fed) at the next meeting continue to fall. The employment numbers could be critical for bonds, the US Dollar, and also the equity market.

Price consolidation across the FX board seems likely ahead, considering the Easter holiday. NFP could trigger some volatility, including erratic swings. Impulses in EUR/USD could be short-lived, but a weekly close above 1.1000 could have consequences.

GBP/USD sees pullback from 9-month high as US jobs data deteriorated

GBP/USD sees pullback from 9-month high as US jobs data deteriorated

The Pound Sterling (GBP) pullback from a 9-month high against the US Dollar (USD) on Tuesday dropped below the 1.2500 figure due to the buck’s renewed strength. The labor market in the United States (US) continues to deteriorate, painting a gloomy scenario for the US economy. The GBP/USD is trading at 1.2422 after hitting a high of 1.2486

GBP/USD drops as bad US jobs data underpin the greenback

Wall Street is trading with losses. The US Bureau of Labor Statistics (BLS) showed that Initial Jobless Claims for the week ending on April 1 exceeded forecasts of 200K, with data hitting 228K. Data linked to the labor market, namely the JOLTs job opening, ADP Employment Change, and the ISM Manufacturing PMI employment subcomponent, portrayed the labor market easing. That spurred an investor reaction, meaning that recessionary fears are the main reasons for the risk-off impulse seen in the last three days.

GBP/USD traders bought the US Dollar, with the pair diving from around daily highs of 1.2480, toward the lows at 1.2412. US Treasury bond yields, particularly the most sensitive to interest rates, the 2-year, dropped to 3.674% before reversing its course and is up at 3.789%.

Although the US 2-year Treasury bond yield has recovered, money market futures estimate that the Federal Reserve (Fed) would pause its tightening cycle at the May meeting. The odds of keeping rates unchanged are at 56.1%. In addition, some investors speculate that the Fed could cut rates as soon as July.

On Wednesday, the Cleveland Fed President Loretta Mester commented that rates need to rise “a little bit higher” and then hold them there for some time. She estimates that inflation will get to the Fed’s target by 2025.

The US Dollar Index (DXY), a gauge for the greenback value against a basket of six currencies, posts back-to-back bullish candles and rises 0.22%, up at 102.104.

On the UK front, the economy in the United Kingdom (UK) has fared well, contrasting the catastrophic economic projections by the Bank of England (BoE) and the UK’s Office for Budget Responsibility (OBR). Projections foresaw an 18-month recession, though the economy has avoided a recession and even posted more robust growth numbers in January. In the meantime, expectations for a 25 bps rate hike by the BoE stay at 63% at the May meeting.

GBP/USD Technical Analysis

GBP/USD Daily chart

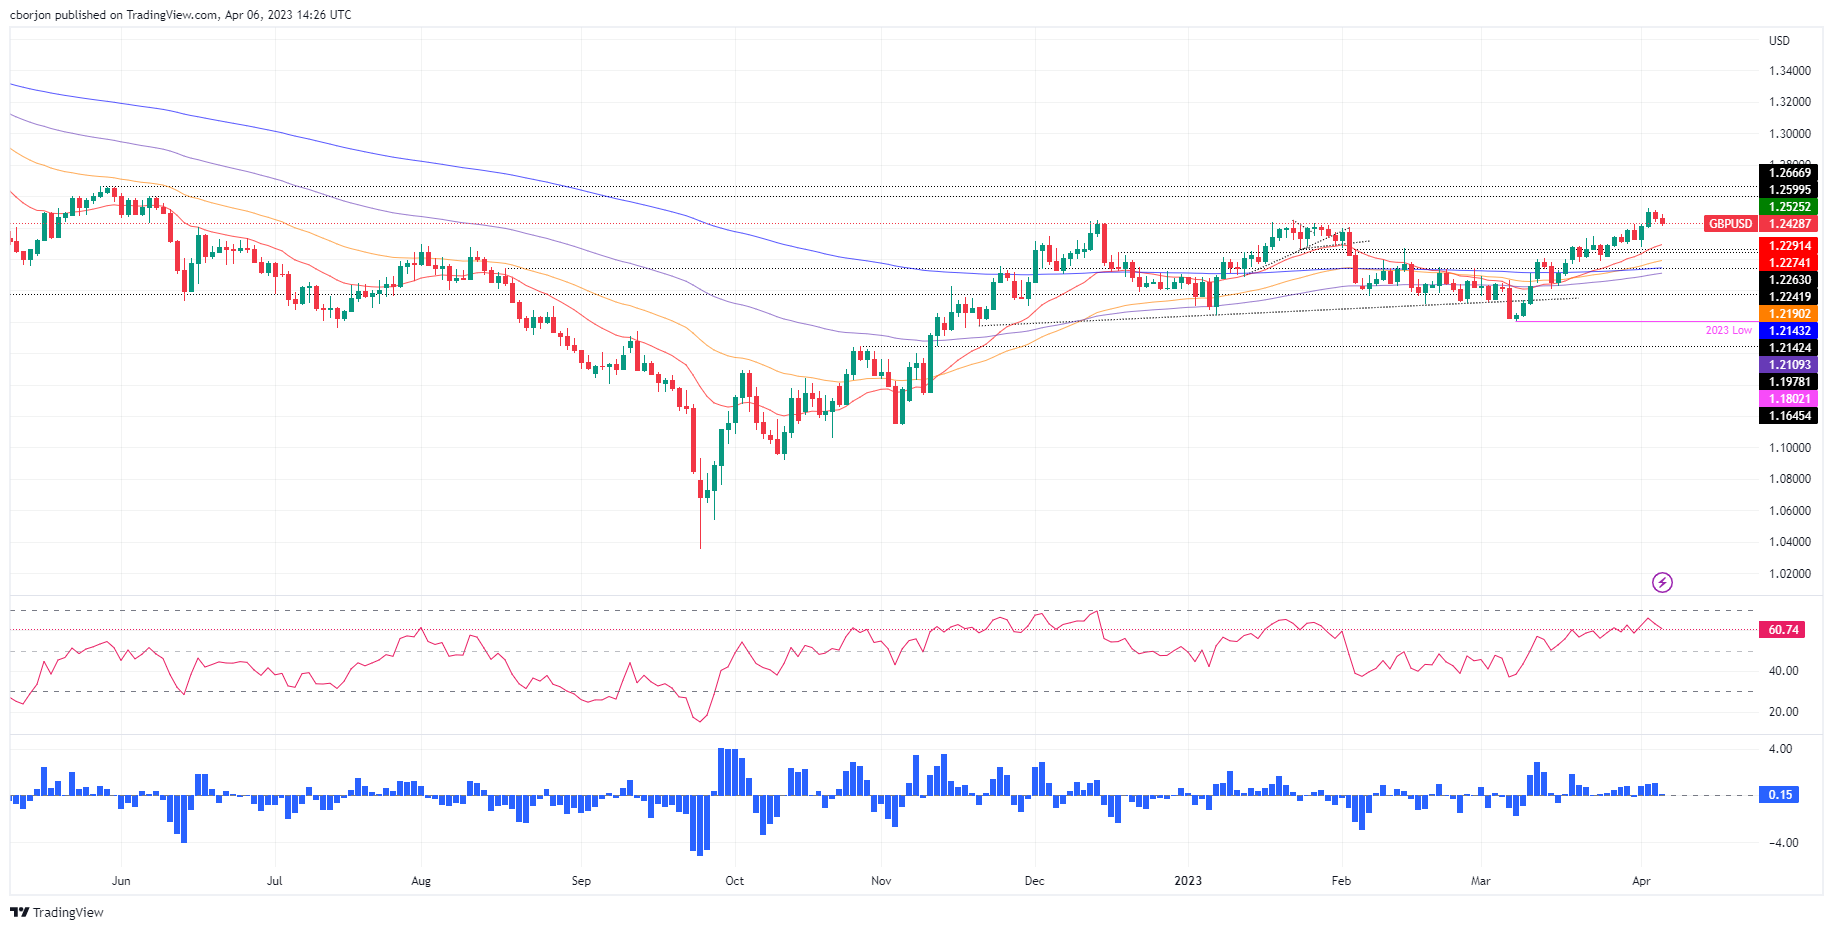
After two straight sessions of registering losses, the GBP/USD stayed short of breaking to fresh three-day lows, below 1.2394, Tuesday’s low. If GBP/USD holds the spot price above the latter, it will keep buyers hopeful of breaking to new YTD highs above 1.2525. Upside risks lie at June 7 high at 1.2599, followed by May 27 pivot high at 1.2667. Contrarily, if GBP/USD drops past 1.2394, that would pave the way for a test of the 20-day EMA at 1.2290, below the 1.2300 psychological level.

Gold Price Forecast: XAU/USD Echoes Uncertain Global Sentiment

Gold Price Forecast: XAU/USD Echoes Uncertain Global Sentiment

XAU/USD FUNDAMENTAL BACKDROP

Gold markets seem hesitant after Monday’s rally above the $2000 level and with a large disconnect between Federal Reserve speakers and money markets, further guidance is needed; possibly in the form of economic data. Speaking of implied Fed interest rate probabilities, the table below shows market expectations of close to 100bps of rate cuts by year end while some Fed officials are calling for further rate hikes above the 5% rate after which these levels should be maintained to keep downward pressure on inflation.

FEDERAL RESERVE INTEREST RATE PROBABILITIES

image1.png

Furthermore, recent misses on US economic data including labor (JOLTs and ADP report) and the US ISM non-manufacturing PMI release have supported market expectations over Fed guidance but the focal point for the week will be the Non-Farm Payroll (NFP) statistic that could pushback against the current data. If the NFP print beats estimates this will result in the 12th consecutive print above forecasts and may give the USD additional support leaving spot gold vulnerable. Later today, jobless claims data will be the first port of call from a US perspective and markets will look to see whether or not this metric provisions the “US economic slowdown” rhetoric or not. The Fed’s Bullard will then close off the trading day where interest will be around consistency of Fed speak (maintaining the hawkish narrative).

ECONOMIC CALENDAR

image2.png

Real yields continue to fall but an NFP beat could increase interest rate projections and increase the opportunity cost of holding the yellow metal, exposing XAU/USD to the downside.

U.S. 10-YEAR TIPS – REAL INTEREST RATE

image3.png

TECHNICAL ANALYSIS

XAU/USD DAILY CHART

image4.png

Price action on the daily spot gold chart above exhibits some bearish divergence whereby the Relative Strength Index (RSI) reading and XAU/USD price action opposes one another. While there is still room short-term for gold appreciation, generally this signal points to impending downside. The resistance zone (green) marks the region between the August 2020 and March 2022 swing highs that will be the next market for gold bulls.

Resistance levels:

  • 2050.00 – 2080.00

Support levels:

  • 2009.75
  • 2000.00
  • 1950.00

IG CLIENT SENTIMENT: CAUTIOUS

IGCS shows retail traders are currently distinctly LONG on gold, with 52% of traders currently holding long positions (as of this writing). At DailyFX we typically take a contrarian view to crowd sentiment; however, due to recent changes in long and short positioning, we arrive at a short-term mixed bias.

US Dollar Gains on Soft Data that May Signal a Shift in Market Perception for USD

US Dollar Gains on Soft Data that May Signal a Shift in Market Perception for USD

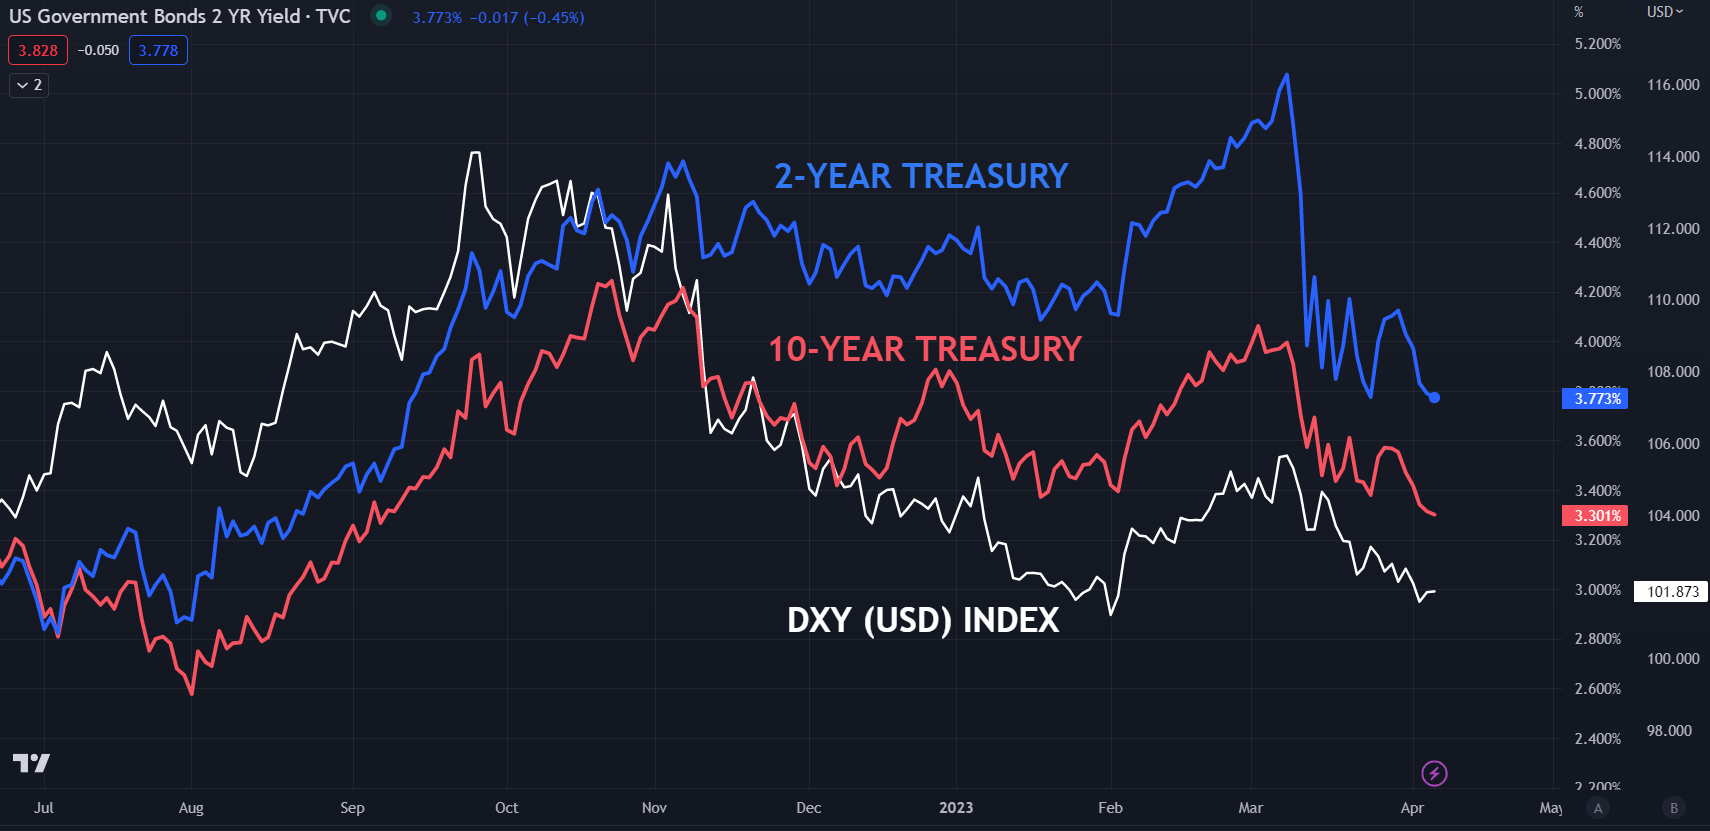
The US Dollar ticked up overnight in a move that goes against the grain of recent price action. Treasury yields dipped again on soft US data and equity markets also lost ground on the news. The data can be viewed here.

The trend of late has seen bad news being interpreted as good news for equities in hopes that it might lead to the Federal Reserve taking its foot off the tightening pedal.

Treasury yields reflected this perspective of a less hawkish Fed to some degree, but the US Dollar found some support. Recent trading sessions have typically seen the greenback loosely track Treasury yields up or down.

This disconnection might be saying about a broader shift in the response mechanism for markets. There is potential that FX markets might be returning to a more traditional view around bad news boosting perceived safe-haven currencies.

The only currency to outperform the US Dollar in the last session was the Japanese Yen, a currency that is often interpreted by markets to outperform in tough economic conditions and underperform in times of economic expansion.

This inter-market price action might be worth paying attention to for positioning in markets. US payrolls data on Friday might provide the impetus for significant market movement.

US DOLLAR (DXY), US 2- AND 10-YEAR YIELDS

image1.png

Chart Created in TradingView

DXY (USD) INDEX TECHNICAL ANALYSIS

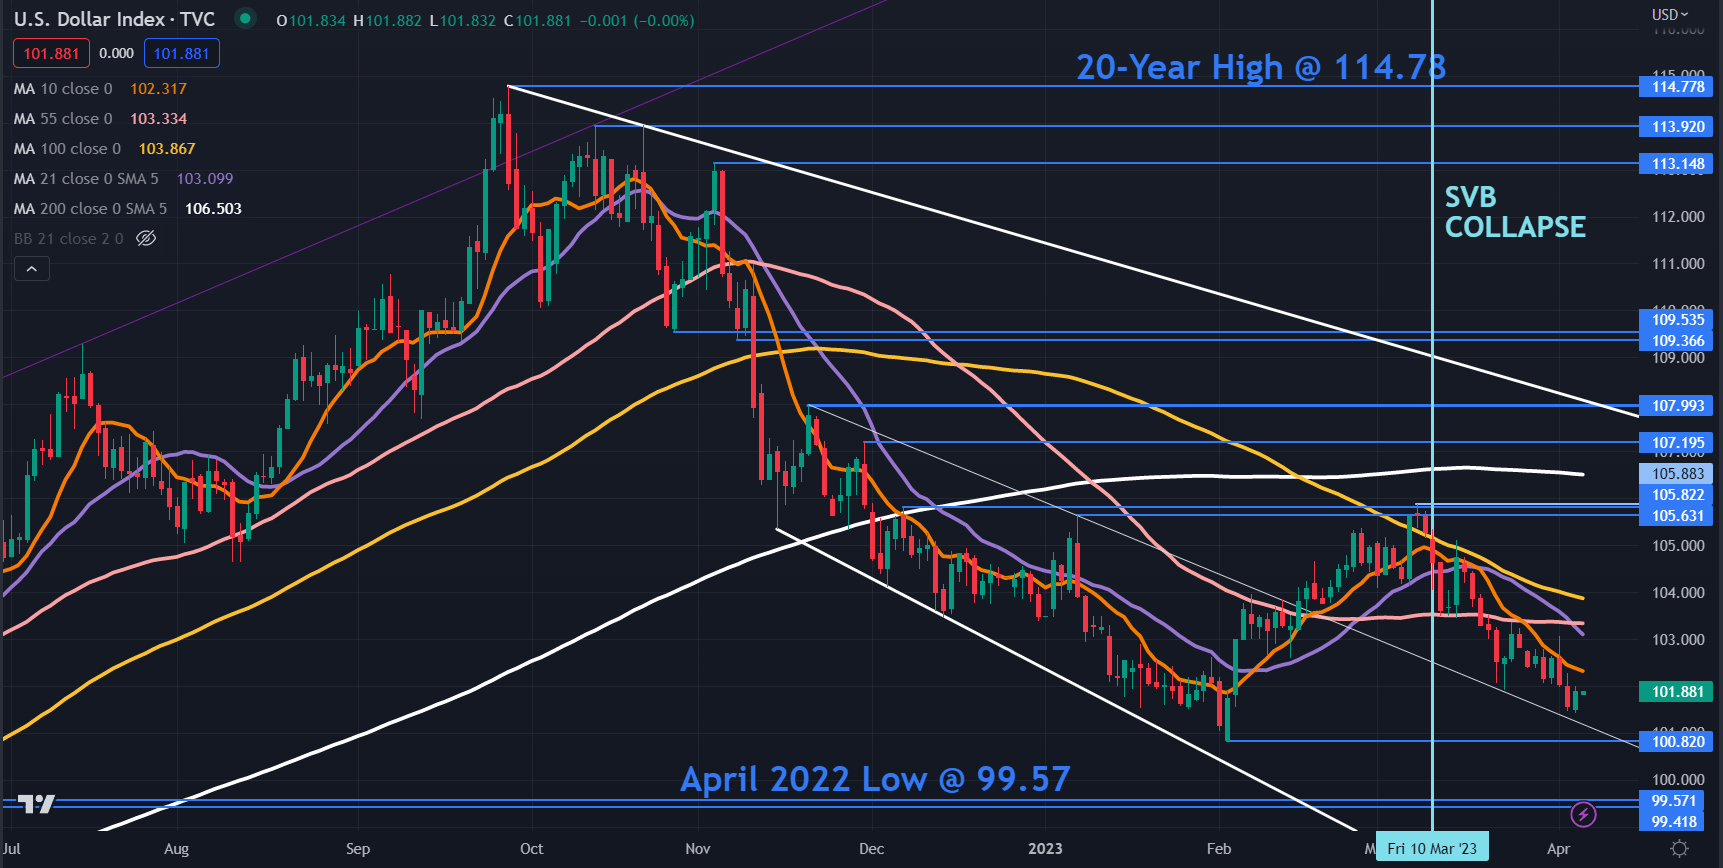
The DXY index remains in descending trend channel despite a rally yesterday. The price is below all period daily Simple Moving Averages (SMA) and this may suggest that bearish momentum is unfolding.

Since the collapse of SVB Financial, the DXY index has been moving lower and support might be at the recent low of 102.59 ahead of the prior lows of 100.82 and 99.57.

On the topside, the triple tops seen in the 105.63 – 105.88 area may provide a resistance zone. The previous peaks 107.70 and 1.08.00 could offer resistance ahead of the breakpoints at 109.37 and 109.54.

image2.png


EUR/USD battles 1.0900 amid US Dollar rebound

EUR/USD battles 1.0900 amid US Dollar rebound

EUR/USD is trading close to 1.0900 early Thursday, consolidating a short series of daily bullish closes. Risk-aversion is underpinning the US Dollar recovery, despite a run of weak US data. Upbeat German Industrial Output data fails to impress.

The EUR/USD retreated on Wednesday, falling from the highest daily close in two months, making it all the way to sub-1.0900 levels. The slide took place despite weaker-than-expected US data and amid a rally in government bonds.

US and European yields dropped on Wednesday. The slide in Europe was more significant and weighed on the Euro. The German 10-year yield fell from 2.28% to 2.18%; the lowest since March 27. The 10-year Treasury Bond yield dropped to 3.26%, the lowest since September.

The US Dollar appreciated against European currencies on Wednesday, despite US data. The ADP Employment report showed private payrolls rose by 145K in March, below the 200K of markets consensus. The ISM Service PMI fell to 51.2 versus estimates of 54.5 in the same period. More US data is coming on Thursday with Jobless Claims ahead of Friday’s Nonfarm Payrolls. However, subdued trade is expected ahead of the Easter holidays.

The final Eurozone March S&P Global Service PMI was revised lower from the preliminary 55.6 to 55.0. German reported that Factory Orders rose 4.8% in February, well above expectations of a 0.3% increase. Germany will report Industrial Production on Thursday and could surprise again to the upside.

“The biggest part of the cycle of rate raises is behind us” mentioned European Central Bank’s Boris Vujcic and later explained, that if core inflation remains above 4%, more hikes can be expected. ECB Philip Lane said that inflation is at its most intense in food. Despite comments and the global outlook, markets continue to see a rate hike at the next ECB meeting on May 4.

Federal Reserve’s Loretta Mester said on Wednesday that they should move the key rate above 5% and hold in restrictive territory for some time to quell inflation. While the bond market continues to point to rate cuts later in 2023, central banks are not considering that scenario, and continue to talk about the need for a tight policy until inflation is back under control.

EUR/USD Forecast: Bulls fight back aim to regain 1.0900

Can Unlucky Traders Still be Profitable? Finding Optimal Risk Management

Can Unlucky Traders Still be Profitable? Finding Optimal Risk Management

Risk Management, Trading Luck, Risk/Reward Ratio Curve – Talking Points

Not Quite Being Lucky

Often, there is an element of luck when it comes to trading. Even if your analysis is spot on, the timing is very difficult. A famous example from the real world can be found in Michael Burry, the storied US investor who correctly predicted the 2008 housing bubble from Michael Lewis’ bestseller “The Big Short”. He had to face down a revolt among his investors that nearly chased him out of the very trades that would land him in the history books. Burry’s financial backers balked at a steady stream of expensive payments made to keep his trades in play as the markets dithered.

There is a way for traders to compensate for luck – risk management. Overlooking this essential component of the strategy is how an incredibly lucky trader – someone who can frequently call trades correctly – may still lose money in the aggregate. Conversely, using risk management effectively is how a poor win rate can still translate into profitability.

How is it that a lucky trader can lose money overall? Consider a person who profited on 8 trades out of 10, making 10 dollars per trade. On the two remaining trades, however, 50 dollars were lost each time. On net, this will leave the trader 20 dollars poorer. In this special report, we will show how an unlucky trader can still be profitable, and what you can do to optimize risk management.

The First Random Walk – Understanding the Sequence

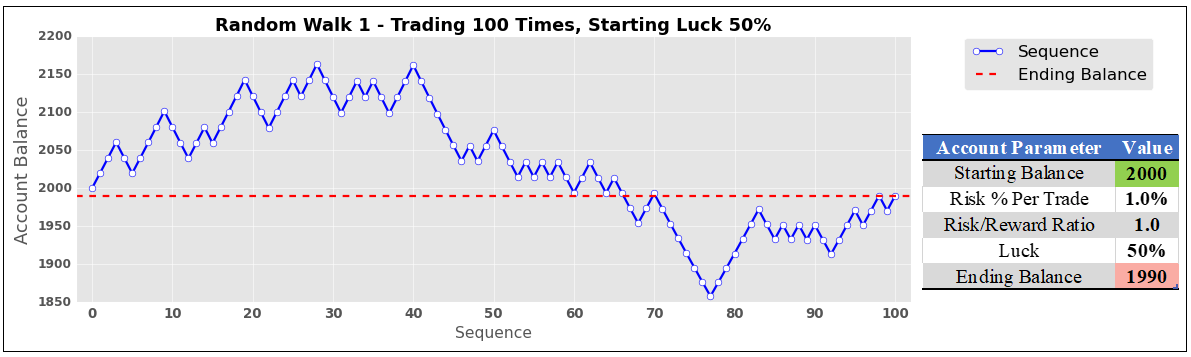
A random walk simulation was used to mimic someone trading 100 times in a row. Each random walk has a few parameters: starting account balance, the maximum risk a person is willing to take per trade as a percentage of the account balance (which stays the same as the trader makes or losses money), the risk-reward ratio (how much the trader wants to make relative to how much is put at risk), and finally the trader’s luck (the chance that a given trade in the sequence is profitable).

The first random walk is shown on the chart below. It simulates a trader that starts with a $2k account, risks 1% per trade, has a risk/reward (RR) ratio of 1:1 (meaning that the first trade risks losing $20 to make a profit of $20), and has 50% luck. Being lucky about half of the time had a predictable outcome. The ending balance ($1990) was nearly identical to where it started ($2000) after one hundred trades.

The First Random Walk – Understanding the Sequence

Study Limitations

It should be noted that this is a study computed with code and has no margin of error or human emotion factored into it. This means that no matter what, it assumes the trader being modeled always sticks to the game plan perfectly. It also assumes that trades can be seamlessly closed – with a profit or loss – at the designated settings with absolute precision. In the real world, stops may not always be executed at the specified price, resulting in some slippage. These simulations also assume 100 trades were taken, which will not match everyone’s level of activity. With that in mind, this is more of a demonstration of the importance of risk management rather than a one-size-fits-all trading system.

The Second Random Walk – Reducing Luck

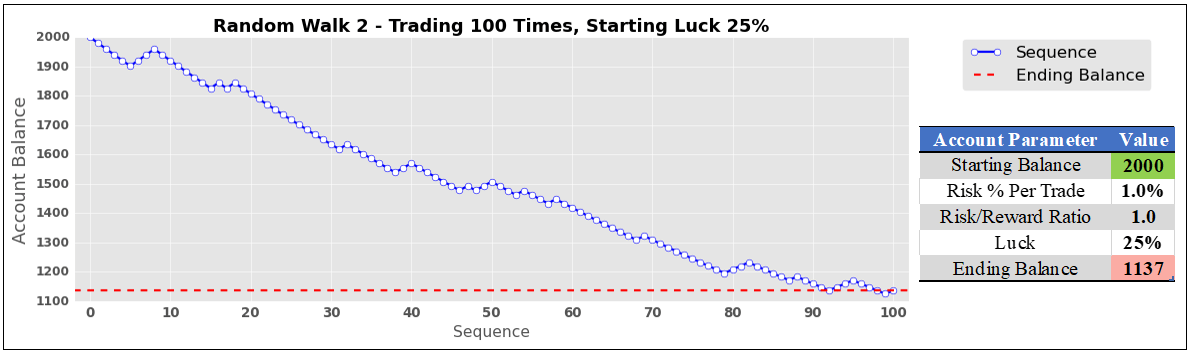
What happens when we take the same sequence but make our hypothetical trader unlucky, leaving everything else unchanged? With 25% luck, disaster strikes. Someone with a risk/reward ratio of just 1:1 would see their account balance cut almost in half after 100 trades ($1137). As we will find at the end of this journey, however, an increase in the risk/reward ratio can compensate for worse luck.

image2.png

Simulating Hundreds of Thousands of Trades to Find Optimal Risk/Reward Ratios

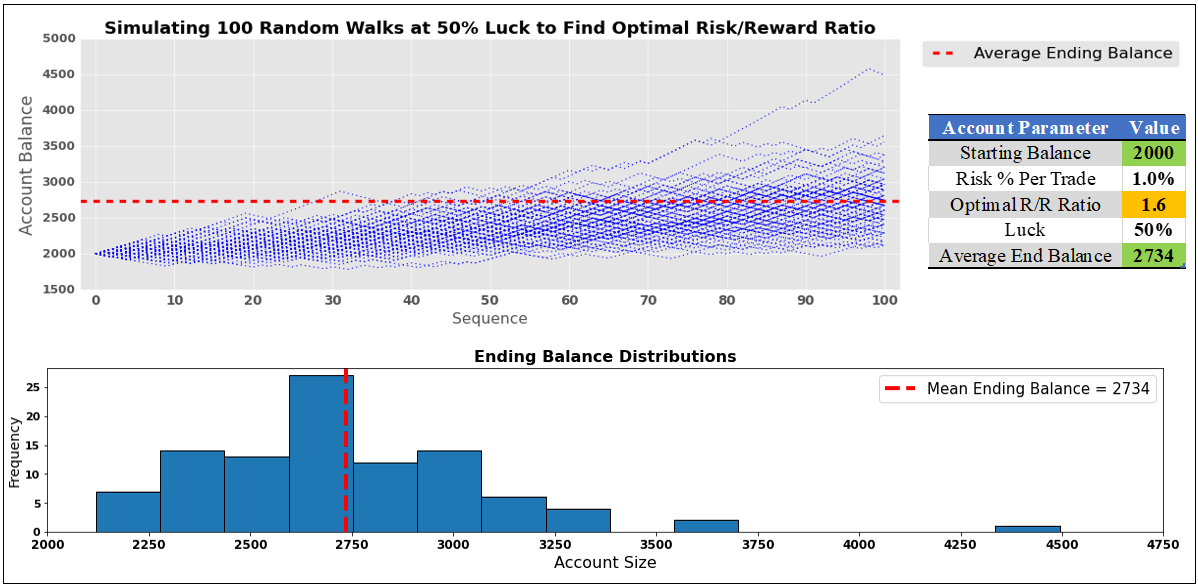
To find ideal risk/reward ratios for given levels of luck, these random walks were run many times to find statistically meaningful interpretations. In this study, one cycle constituted 100 trades conducted 100 times. That is a total of 10,000 trades per cycle! With each cycle, the risk/reward ratio automatically rose by 0.05, starting at 1. The program is coded to keep doing this until 100% of the trades are finished at or above the starting account balance.

So, what does this look like for someone lucky about half of the time? Well, in the image below, we can see that the optimal risk-reward ratio is on average 1.6 (meaning that with a starting balance of $2k the strategy aims to make $32 in profit while risking $20 on the first trade). The latter two will adjust alongside the evolving account balance to maintain a 1.6 RR ratio, making sure the risk remains at 1% per trade.

The code ended up increasing the risk/reward ratio 6 times. Including the starting point, the cycle ran 7 times. In other words, 70k trades were conducted to find the optimal RR ratio. To further optimize this study, another 10 rounds of random sequences were used. This means that roughly 770,000 trades were placed to find the optimal risk/reward ratio for 50% luck! It is not exactly 770,000 because sometimes the RR ratio was above/under 1.6.

When someone is lucky half of the time, and they use a 1.6 risk-reward ratio, we can expect an average ending balance of $2734 (36.7% return, which remains constant no matter what the starting account balance size is) after 100 trades. In the lower half of the image, there is a normal distribution of outcomes. There were a couple of outliers, with an account topping $4.5k. A few others were above $3.5k.

Simulating Hundreds of Thousands of Trades to Find Optimal Risk/Reward Ratios

The Optimal Risk/Reward Ratio Curve

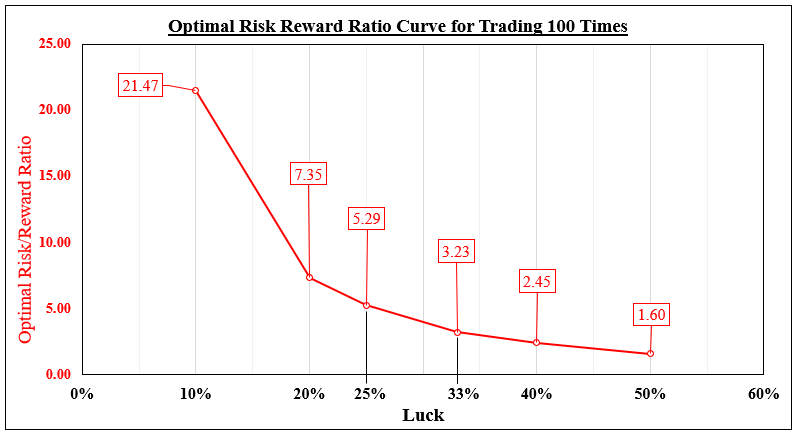
What about other levels of luck? In this study, I used the following: 50%, 40%, 33%, 25%, 20% and 10%. Optimal RR ratios are displayed in the chart below for a given luck level. As expected, lower levels of luck required higher risk/reward ratios to compensate. When you are lucky 40% of the time, an ideal RR ratio for a sequence of 100 trades seems to be 2.45.

At 2.45, a total of 30 cycles were simulated for a given random sequence. Just like before, an additional 10 were performed to help optimize this study. Combining all these sequences, roughly 3,300,000 trades were placed to find the optimal risk/reward ratio for 40% luck.

Someone lucky just 10% of the time can still make a profit. However, this would demand the daunting task of maintaining a 21.47 risk/reward ratio.

The Optimal Risk/Reward Ratio Curve

Is Trading Success Based on Luck?

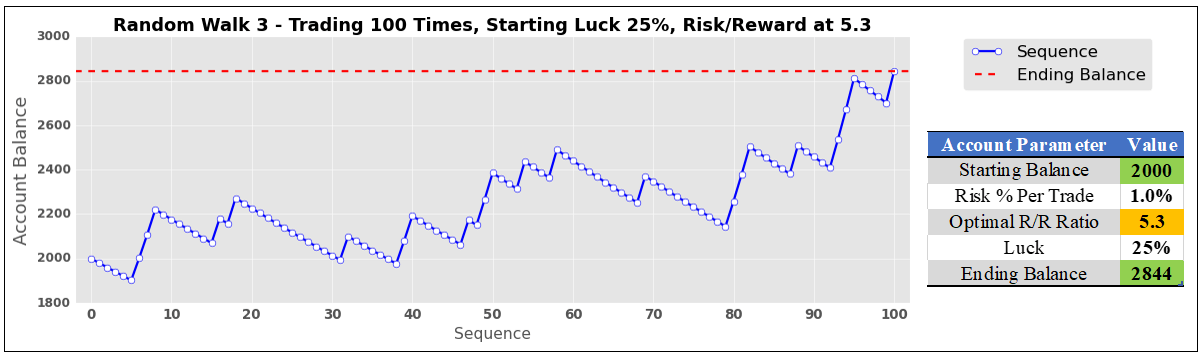
Now, let us revisit the earlier scenario of a trader that is lucky just 25% of the time. Using a 1:1 risk-reward ratio, they lost almost half of their account. Using the optimal risk/reward ratio of 5.3 suggested in our analysis, their ending balance becomes $2844, a 42.2% return. Do traders have to be lucky to be profitable? Absolutely not. Success comes down to risk management.

Is Trading Success Based on Luck?

Economic Woes Aid Japanese Yen; More Downside in USD/JPY, AUD/JPY, EUR/JPY?

Economic Woes Aid Japanese Yen; More Downside in USD/JPY, AUD/JPY, EUR/JPY?

The Japanese yen could maintain a firm tone against the US dollar and some of its peers amid concerns about a slowing global economy following a spate of underwhelming macro data.

The G10 Economic surprise index has fallen sharply since the end of March to the lowest level since early February, raising the risk that the multi-month run of upbeat data may have run its course. For the US, data since the end of last month (from GDP personal consumption last week to Wednesday’s ADP employment change and ISM services), have sparked concerns that the economy is losing momentum as the effect of Fed rate hikes spills over.

USD/JPY Daily Chart

image1.png

Chart Created by Manish Jaradi Using TradingView

Recent underwhelming US data means some of the optimism with regard to the economic growth outlook could be reassessed – until the end of last month, consensus forecasts implied just one-quarter of negative US economic growth (that is, no technical recession). Markets are now pricing in over 60% chance that US rates will be lower following its July meeting, down from pricing in one more rate hike as soon as in May.

USD/JPY – Soft bias

Ashighlighted in the previous update, USD/JPY remains in a downtrend (see colour-coded charts). The rebound in February was corrective, which ran out of steam around the 200-day moving average (DMA). This was reaffirmed by the 14-week Relative Strength Index (RSI), which was capped at 53 following the rebound – corrective rallies tend to stall around 50-55 levels of the RSI.

USD/JPY Weekly Chart

image2.png

However, USD/JPY has quite strong converged support at the January low of 127.20, coinciding with the lower edge of the Ichimoku cloud on the weekly charts and the May 2022 low of 126.35. So, while the bias appears to be soft for USD/JPY, the downside could be limited for now. USD/JPY would need a strong catalyst to decisively break below the 126.35-127.20 support area, including a spike in risk aversion or a global weakness in USD. On the upside, last week’s high of 133.75 marks as initial resistance; a stronger barrier is on the 200-DMA (now at about 137.25).

AUD/JPY Weekly Chart

image3.png

AUD/JPY – Looking vulnerable

AUD/JPY is looking vulnerable as it tests crucial converged support: a horizontal trendline from May 2022 (at about 87.40), slightly above another horizontal trendline from early 2021 (at about 85.70). A decisive break below could pave the way toward the 200-week moving average (now at 81.60).

EUR/JPY Weekly Chart

image4.png

EUR/JPY – Range with downward bias

Directional movement indices on the weekly charts suggest (up)trending conditions prevalent since 2020 have run their course for now. EUR/JPY could remain in the recently formed range of 137-146 with a bias toward the lower edge of the range in the near term. Strong support is on the 89-WMA, coinciding with the lower edge of the Ichimoku cloud on the weekly charts (around 135.00).