Crude Oil Slides as US Data Underwhelms Pushing Yields Down. Lower WTI?

Crude Oil Slides as US Data Underwhelms Pushing Yields Down. Lower WTI?

Crude oil dipped today after US data revealed a potentially softening economy, raising the spectre of a possible looming recession in the world’s largest economy. The data can be viewed here.

The US Dollar strengthened into the New York close yesterday and continued to gain so far today. The Japanese Yen is the only currency to make ground against the greenback. Markets appear to have looked for safety in perceived safe haven currencies on the weak numbers.

Treasury yields continued to slip slightly lower through the Asian session while 10-year US real yields made a seven-month low. It touched 1.02% overnight, way down from the 1.72% seen last month. At the same time, gold made a twelve-month peak at USD 2,032 but has pulled back today.

Cleveland Federal Reserve President Loretta Mester was interviewed by Bloomberg and noted that in reference to the Fed’s target rate, “we’re going to have to go a little bit higher.”

The Aussie and Kiwi Dollars are the underperformers today and it might reflect the market’s preference for haven assets overall.

APAC equity indices are a sea of red following a soft lead from Wall Street. Futures are pointing to an unsteady start to the North American session.

Crude has retreated further from Tuesday’s 10-week high as concern for a US recession undermines global growth prospects. The WTI futures contract is trading near US$ 80 bbl while Brent is around US$ 84.50 bbl at the time of going to print.

Later today Canada and the US will get some jobs data. Many markets will be closed on Friday but US non-farm payrolls might prove to be a crucial data point after the moves seen yesterday.

WTI CRUDE OIL TECHNICAL ANALYSIS

WTI crude pierced above the prior peaks at 80.62 and 80.94 but was unable to sustain a close above those levels. This may indicate that the move was a false break.

The market gapped higher on Monday and from a technical perspective, markets sometimes work to fill in gaps. A break below Monday’s low of 79.00 could see this technical event unfold.

Support might lie at the 23.6% and 38.2% Fibonacci Retracement levels at 77.70 and 75.25 respectively ahead of the breakpoints in the 72.25 – 72.45 area.

On the topside, there could be a resistance zone in the 82.50 – 83.30 area where several breakpoints and prior peaks are located.

image1.png


Caixin Services Beats Expectations; Shanghai Composite and Hang Seng to Gain??

Caixin Services Beats Expectations; Shanghai Composite and Hang Seng to Gain??

Stronger-than-expected Caixin services activity data bodes well for China’s growth outlook as the Shanghai Composite index and the Hang Seng index test key resistance.

China Caixin PMI services rose to 57.8 in March, vs 55 expected, up from 55 in February as the economy reopening gathers steam. This follows upbeat official non-manufacturing PMI data published last week. Broadly, China’s macro data have beaten expectations, as reflected in the Economic Surprise Index for China (at the highest level at least since 2014). In addition, hopes of a turnaround in the property cycle and hopes that regulatory crackdown on corporates could be ending suggest the growth spurt could turn out to be more than temporary.

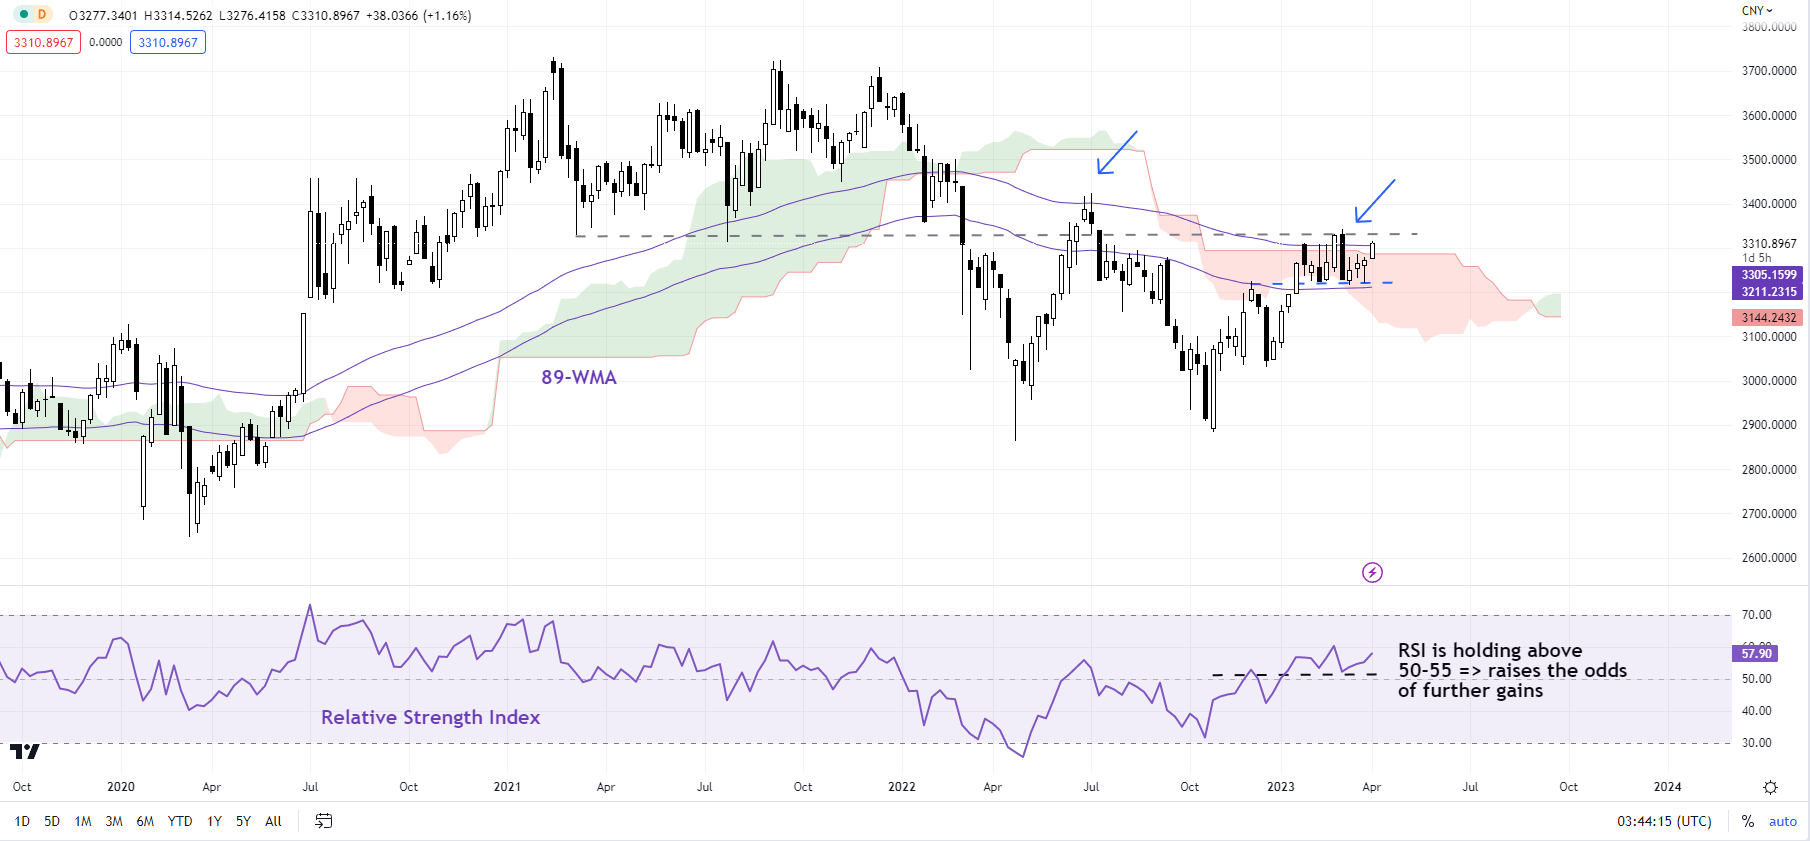
Shanghai Composite Index Weekly Chart

image1.png

Upbeat data has translated into sharp upward revisions to China’s economic growth outlook since the beginning of the year – consensus now expects about 5.3% on-year growth for China for the year 2023, up sharply from around 4.3% in January.

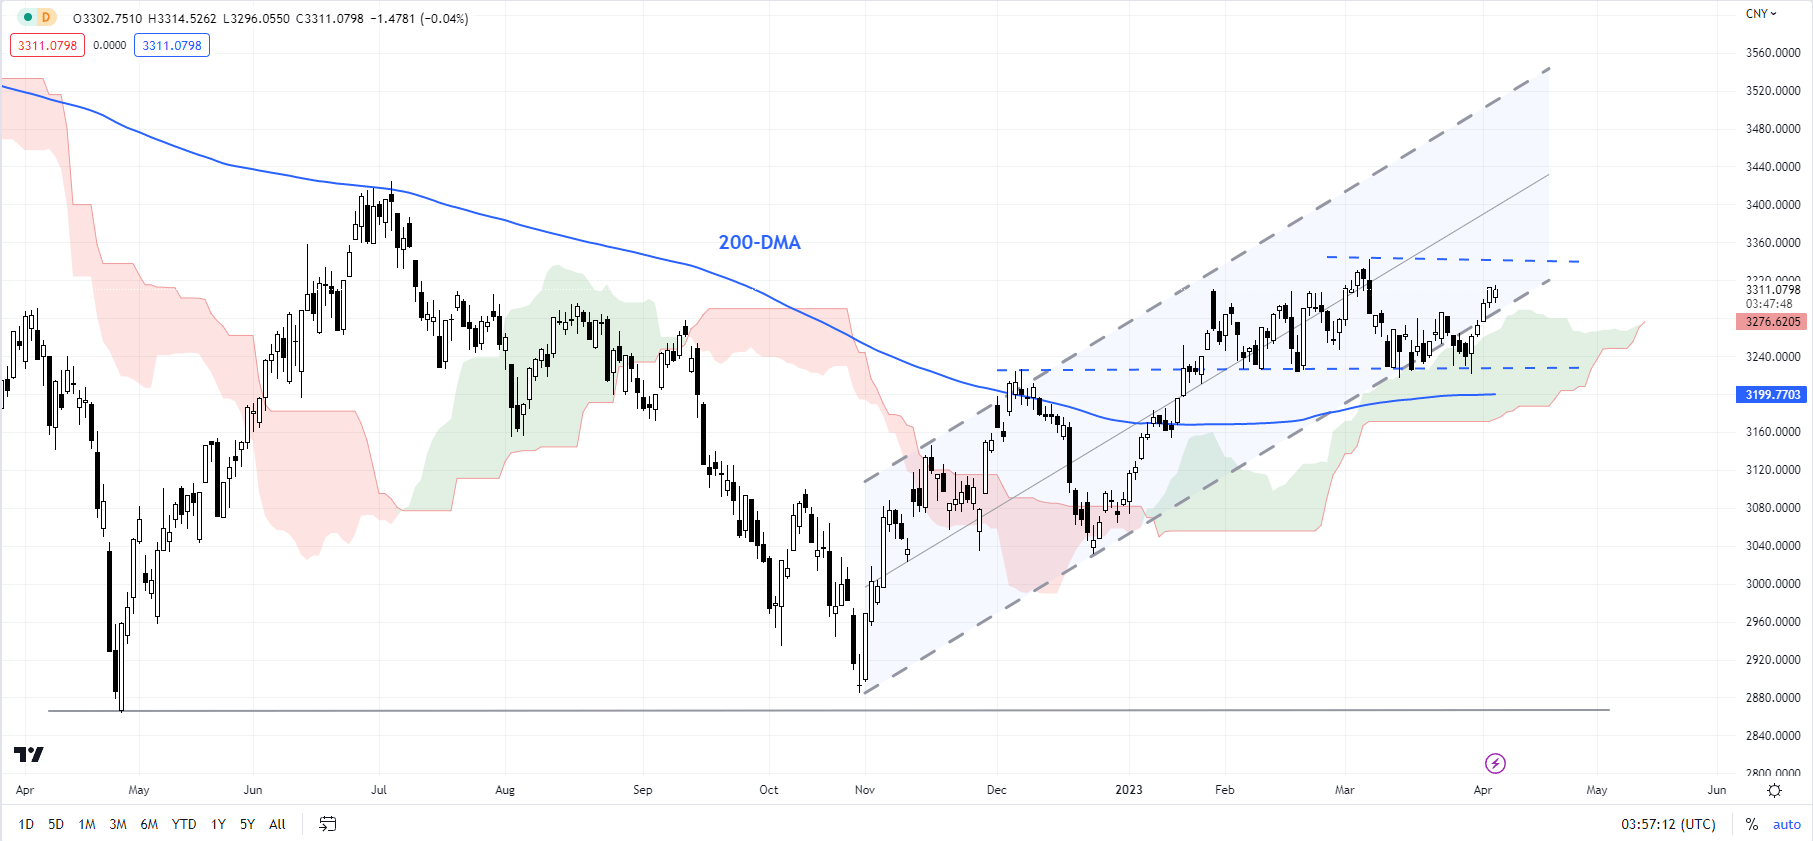
Shanghai Composite Index Daily Chart

image2.png

Shanghai Composite Index: Tests a vital barrier

The Shanghai Composite Index has been in a narrow range since the start of the year. The lower edge of the range is defined by a horizontal line from February (at about 3215), while the upper end of the range is around the early-March high of 3343. Any break above 3343 could initially open the door for a rise toward the mid-2022 high of 3425. On the other hand, there is plenty of support on the downside below 3215, including the 89-day moving average, the 200-DMA, and the lower edge of the Ichimoku cloud on the daily charts.

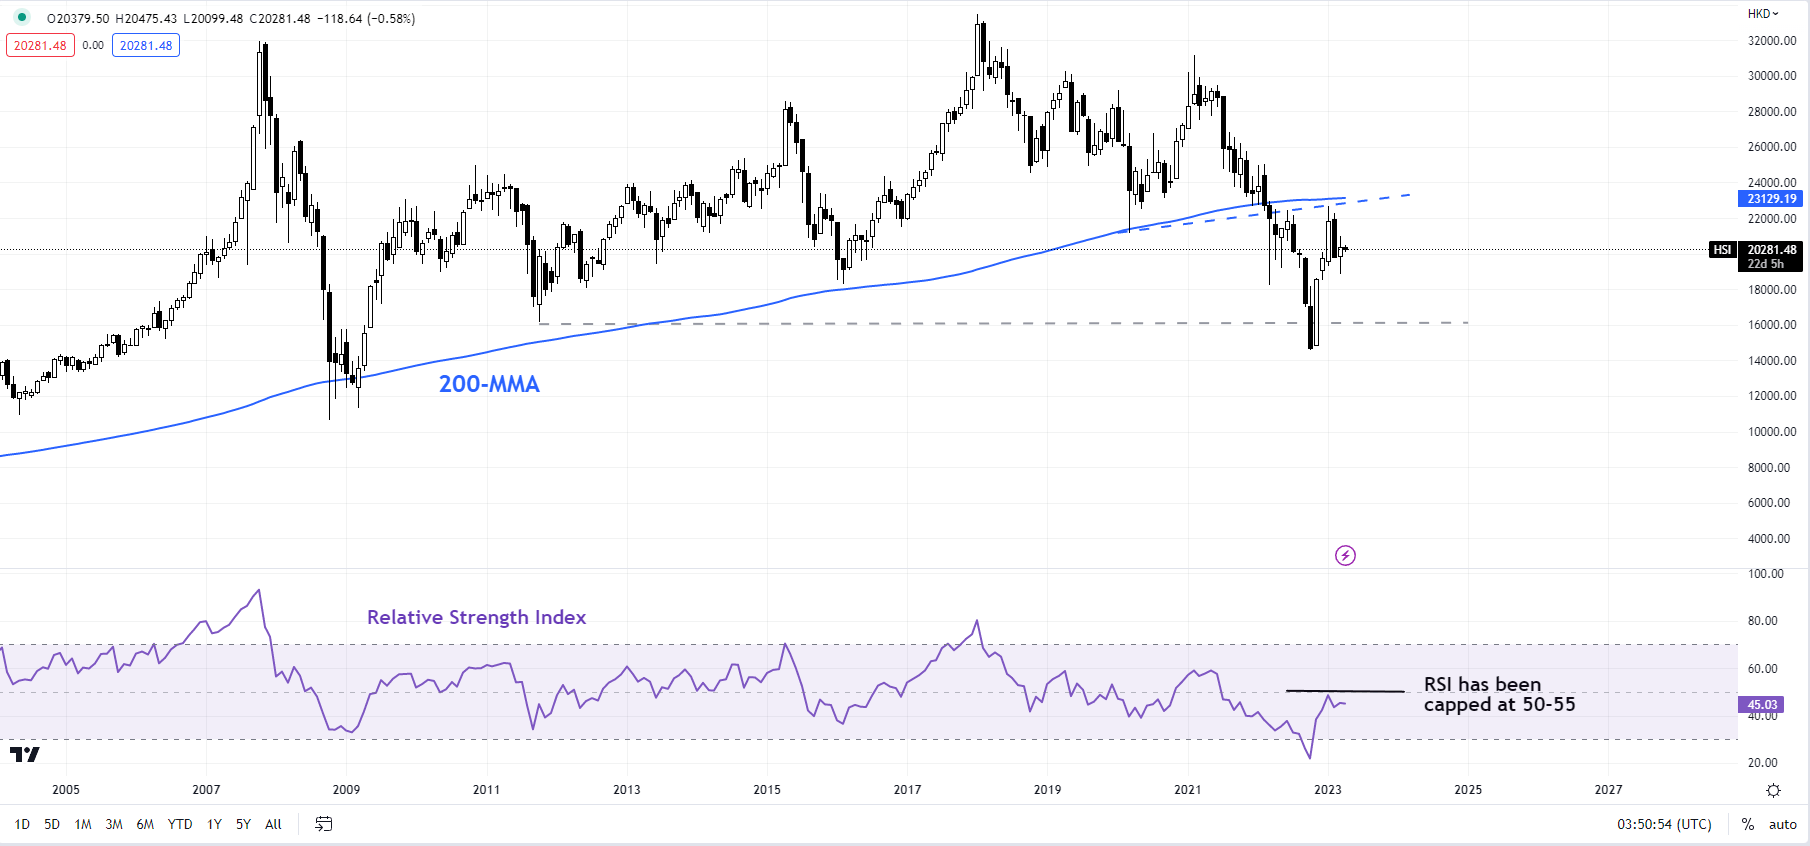
Hang Seng Index Weekly Chart

image3.png

Hang Seng: Range likely

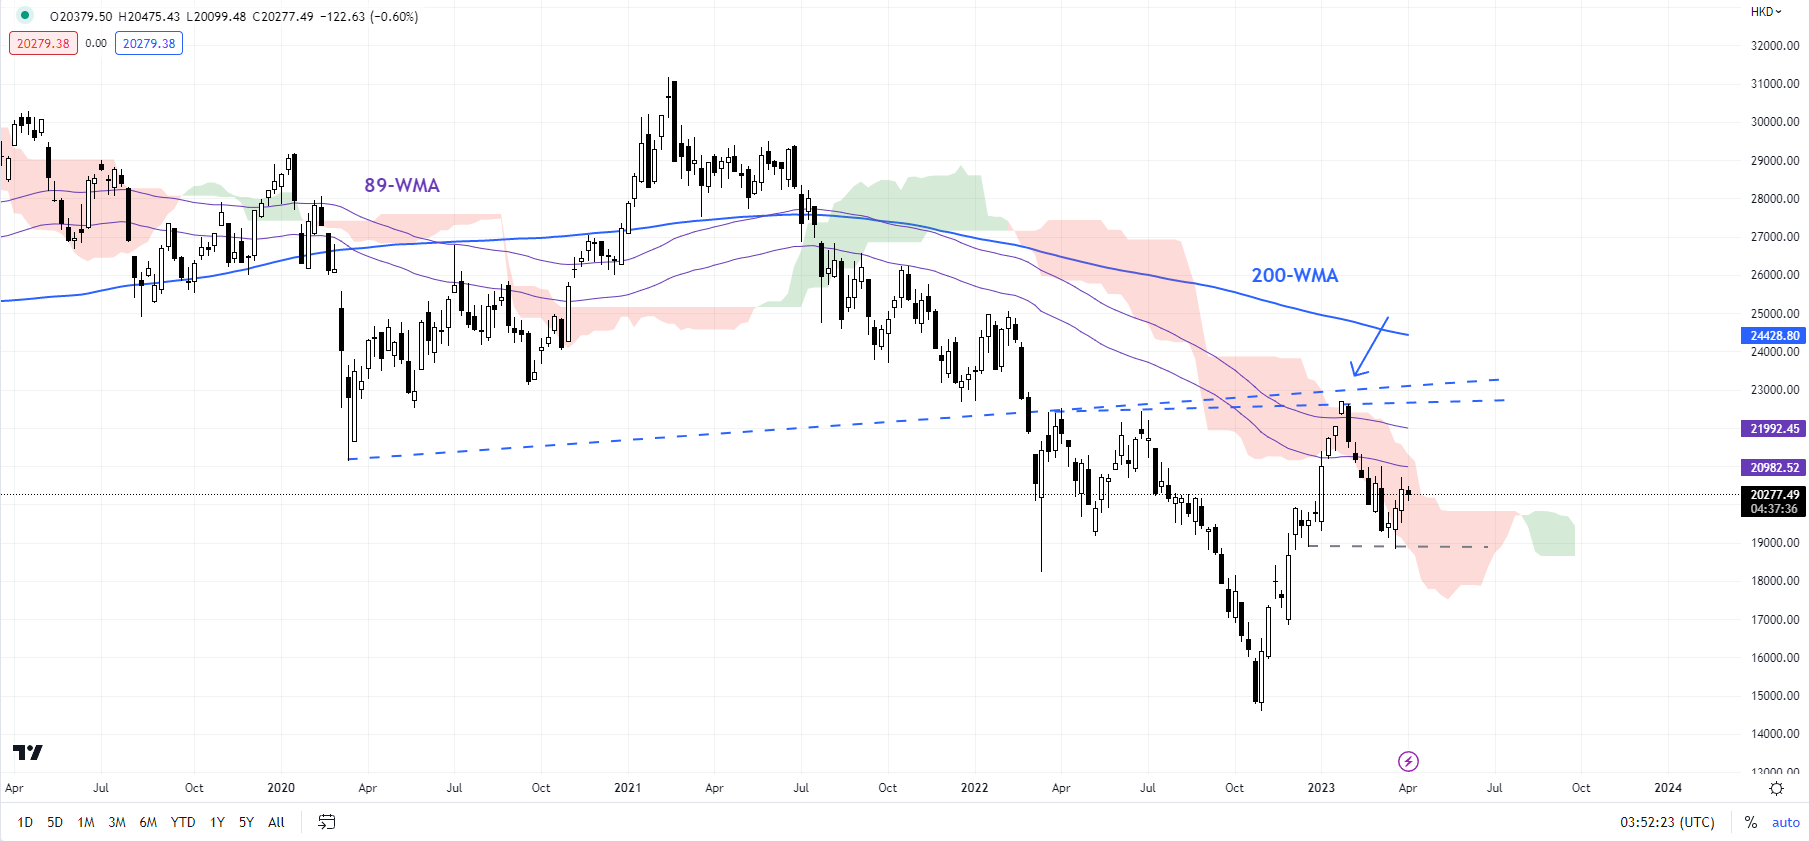
The Hang Seng Index’s hold above vital support at the December low of 18885 confirms that the higher-top-higher-bottom sequence from the end of 2022 remains in place. It is now approaching a key ceiling at the early-March high of 21005. However, given the overhang of the big bear market since 2018, the index may not turn unambiguously bullish soon. That is, it could settle in a range in the interim. The lower end of the range is 18400-18900 (including the mid-November high of 18415), while the upper end of the range would likely be by the January high of 22700.

Hang Seng Index Daily Chart

image4.png

US Dollar selloff picks up steam after dismal US data

US Dollar selloff picks up steam after dismal US data

The US Dollar (USD) came under heavy selling pressure in the second half of the day on Tuesday following the disappointing macroeconomic data releases. The market pricing suggests that the probability of the US Federal Reserve (Fed) raising its policy rate has dropped below 50% on Tuesday. Although Wall Street’s main indexes trade mixed after the opening bell, the currency is having a hard time attracting investors.

  • The US Bureau of Labor Statistics reported on Tuesday that the number of job openings on the last business day of February declined to 9.9 million from 10.5 million in January.
  • The US Census Bureau announced that Factory Orders declined by 0.7% on a monthly basis in February, compared to the market expectation for a decrease of 0.5%.
  • The US Dollar Index touched its lowest level since early February below 102.00 after weak US data.
  • Bloomberg reported on Tuesday that Chinese Yuan has surpassed the US Dollar as the most traded currency, in monthly trading volume, for the first time in Russia in February. According to the outlet, the gap has continued to widen in March.
  • Last week, Brazil and China have reached an agreement to stop using the US Dollar as an intermediary in trade transactions.
  • On Sunday, Saudi Arabia announced that several producers in OPEC+ will participate in voluntary output cuts from May to the end of the year. The group’s total output will be reduced by more than 1.5 million barrels per day in that period.
  • The barrel of West Texas Intermediate (WTI) started the week with a large bullish gap and touched its highest level since late January above $82. Following a consolidation phase, WTI holds comfortably above $80.
  • Federal Reserve Bank of St. Louis President James Bullard said on Monday that the unexpected decision by OPEC to lower output could make the Fed’s jobs of bringing inflation down back to 2% target more challenging.
  • ISM’s Report on Business revealed on Monday that the headline Manufacturing PMI declined to 46.3 in March from 47.7 in February, revealing a contraction at an accelerating pace in the manufacturing sector’s economic activity.
  • The Prices Paid Index of the PMI survey, the inflation component, dropped to 49.2 from 51.3. This reading suggests that input inflation in the sector softened in March.
  • Fueled by the upbeat performance of energy shares, the S&P 500 closed in positive territory on Monday.
  • Later in the week, the ISM Services PMI survey, ADP private sector employment data and the US Bureau of Labor Statistics’ March jobs report could influence the US Dollar valuation.

Technical analysis: US Dollar set to weaken further against Euro

Despite the modest retreat seen at the beginning of the week, EUR/USD has managed to gather bullish momentum. The Relative Strength Index (RSI) indicator on the daily chart rose above 60 and the 20-day Simple Moving Average (SMA) made a bullish cross with the 50-day SMA. Both of these technical developments suggest that the pair’s bullish bias remains intact and there is more room on the upside before it turns technically overbought.

EUR/USD trades above 1.0900 (psychological level, static level) and it could target 1.1000 (end-point of the latest uptrend, psychological level) and 1.1035 (multi-month high set in early February) as long as that support holds.

On the downside, 1.0800 (psychological level, static level) aligns as first important support level before 1.0730/1.0750 area (20-day SMA, 50-day SMA) and 1.0660 (100-day SMA).

How is US Dollar correlated with US stock markets?

Stock markets in the US are likely to turn bearish if the Federal Reserve goes into a tightening cycle to battle rising inflation. Higher interest rates will ramp up the cost of borrowing and weigh on business investment. In that scenario, investors are likely to refrain from taking on high-risk, high-return positions. As a result of risk aversion and tight monetary policy, the US Dollar Index (DXY) should rise while the broad S&P 500 Index declines, revealing an inverse correlation.

During times of monetary loosening via lower interest rates and quantitative easing to ramp up economic activity, investors are likely to bet on assets that are expected to deliver higher returns, such as shares of technology companies. The Nasdaq Composite is a technology-heavy index and it is expected to outperform other major equity indexes in such a period. On the other hand, the US Dollar Index should turn bearish due to the rising money supply and the weakening safe-haven demand.

Crude Oil Price Steady After Stunning Run Higher on OPEC+ News. Where to for WTI?

Crude Oil Price Steady After Stunning Run Higher on OPEC+ News. Where to for WTI?

Crude oil has held the high ground after making a 2-month high on Monday following on from gains of over 9% last week.

The announcement over the weekend of OPEC+ cutting production by 1.1 million barrels per day saw the energy commodity reclaim levels that were lost in the collapse of SVB Financial last month.

Market perceptions around global growth prospects remain in flux with the Federal Reserve maintaining its hawkish mantra and China yet to ignite economic activity to pre-pandemic levels.

In an interview with Bloomberg television overnight, St Louis Fed President James Bullard said that the higher oil price will make the Fed’s job of lowering inflation more difficult.

Although he did say that he had expected the oil price to rise anyway, citing China re-opening and ‘Europe skiting recession’.

Yesterday’s ISM manufacturing index came in below forecasts at 46.3 rather than 47.5 anticipated according to a Bloomberg survey of economists. It may hint toward a US economy that is starting to feel the impact of the Fed’s tightening cycle.

Elsewhere, it has been reported that Chinese authorities warned top bankers there last Friday that the crackdown on corruption was far from over.

There had been increased hopes of a more flexible approach from the communist party toward business after the successful announcement of the split up of the Alibaba group last week.

Looking at the underlying structure of the WTI market, some of the indicators might be turning neutral. The OVX volatility index has eased lower, potentially suggesting that the market could be comfortable with the current price.

The front two futures contract are neither in backwardation or contango, possibly saying that there is a degree of equilibrium between supply and demand.

Finally, the RBOB crack spread might have rolled over, having risen ahead of the rally in the oil price. The crack spread bifurcates the difference in price between WTI crude oil and refined RBOB gasoline.

WTI CRUDE OIL, CRACK SPREAD, BACKWARDATION/CONTANGO, VOLATILITY (OVX)

image1.png

Gold Jumps After ISM Data; Can it Rise Above the Key $2000 Level?

Gold Jumps After ISM Data; Can it Rise Above the Key $2000 Level?

GOLD TECHNICAL OUTLOOK – NEUTRAL

Gold is once again flirting with the psychological 2000-mark after it rebounded strongly on Monday following dismal US factory data. What are the chances for it to rise above the key resistance?

The yellow metal bounced on softer US Treasury yields after US manufacturing activity slowed faster than expected in March, falling to the lowest level in three years. The vital new orders component fell to 44.

XAU/USD Daily Chart

image1.png

Chart Created Using TradingView

Still, headwinds persist for XAU/USD. The output cut by major oil producers could put a floor for oil prices and prevent inflation and yields from falling much. This could reduce the appeal of the non-yielding asset. Markets are now pricing in a 65% chance of one more Fed rate hike in May, up from 55% on Thursday. Hence it appears that gold would need a strong cyclical/structural catalyst for a sustainable uptrend to unfold.

XAU/USD 240-minute Chart

image2.png

Chart Created Using TradingView

On technical charts, the most recent price action seems to suggest that XAU/USD is consolidating in a flag-type consolidation pattern. However, developments on higher timeframe charts warrant some attention.

On the weekly charts, negative divergence (rising price associated with a stalling in momentum) persists (see “Gold Could Find it Tough to Crack $2000”, published March 28). On the monthly chart, momentum has been slowing since 2020 even as the price has attempted to crack the psychological 2000 mark. Moreover, momentum isn’t reflective of the most recent rebound from early March, raising the prospect of a ‘last hurrah’ in price.

XAU/USD Monthly Chart

image3.png

Chart Created Using TradingView

Having said that, there is no sign of an imminent reversal of the uptrend, at least yet, and any break above the March highs could open the way toward initially toward the 2020 peak of 2072. But given the dynamics unfolding on longer timeframe charts, it might be prudent to wait for a decisive break above the 2000-2072 area before turning unambiguously bullish.

On the downside, key support is around 1934-1950 (see chart), and gold would need to break below the support area for the immediate upward pressure to fade. Such a break could expose the downside toward 1900. However, until then, the path of least resistance remains sideways to up.

Australian Dollar Dips After RBA Leave Rates Unchanged. Will AUD/USD Top Out?

Australian Dollar Dips After RBA Leave Rates Unchanged. Will AUD/USD Top Out?

The Australian Dollar slipped slightly in the aftermath of the RBA standing still on rates for the first time since May 2022.

The RBA maintained some flexibility and didn’t rule out future hikes. In the accompanying statement on monetary policy, they said, “The Board expects that some further tightening of monetary policy may well be needed to ensure that inflation returns to target.”

Interest rate markets are currently pricing no more hikes and a better-than-even chance of a 25 basis point cut by the end of the year.

Today’s price action comes after a massive rally for the Aussie yesterday. Markets were rattled by the huge surge in crude oil prices after OPEC+ cut its crude oil production target by 1.1 million barrels per day. The move compounded existing tightening supply issues.

This saw Treasury yields slide lower, taking the US Dollar with it. AUD/USD was the largest beneficiary in the aftermath. The yield spread between Treasuries and Australian Commonwealth Government bonds (ACGB) moved back toward favouring AUD which may have played a role in the rally.

The RBA has raised the cash rate by 350 basis points since May 2022. In October 2021 the Australian Prudential Regulation Authority (APRA) released this statement.

“APRA has told lenders it expects they will assess new borrowers’ ability to meet their loan repayments at an interest rate that is at least 3.0 percentage points above the loan product rate.”

Previously, the hurdle was 2.5%. Much has been made of the so-called ‘mortgage cliff’ where borrowers will need to refinance their debt of the last few years at current levels. These debts might be near or exceed the upper end of APRA’s expectation of appropriate lending.

This might go some way to explain why the RBA is hesitating to tighten monetary policy while CPI remains much higher than its target of 2–3% over the business cycle.

Quarterly CPI will be released later this month and it will be only the second time that it can be compared to the new monthly CPI figure that the Australian Bureau of Statistics (ABS) introduced last October.

This new monthly gauge only covers around two-thirds of the basket of goods and services that is counted in the quarterly figure.

The RBA has previously cited the softening in the monthly CPI number as a reason to be less hawkish. Another disparity of 0.6% the wrong way could be a headache for the central bank and could see the monthly read defenestrated.

Looking ahead and across the Tasman Sea, the Reserve Bank of New Zealand (RBNZ) is anticipated to raise its official cash rate (OCR) by 25 basis points to 5.0% tomorrow. The Kiwi made a 7-week high above 63 cents against the US Dollar today.

AUD/USD AGAINST 3- AND 10-YEAR AU-US BOND SPREAD

image1.png


Euro Price Forecast: EUR/USD 1.09 Handle About to Break?

Euro Price Forecast: EUR/USD 1.09 Handle About to Break?

EURO FUNDAMENTAL BACKDROP

The euro has not benefited as many expected after the European Central Bank (ECB)’s Holzmann favored a 50bps interest rate hike for the May meeting yesterday, a miss on US ISM manufacturing PMI and a beat on eurozone PMI data. This leaves the notion of inflationary concerns stemming from the OPEC+ production cut that could be muting the dovish tone of recent. Earlier this morning, positive export data from Germany (see economic calendar below) was not enough to offset the shortfall on the overall balance of trade figure for February and did little in the way of moving the EUR/USD needle.

Later today, the ECB consumer expectations survey will come into focus as well as another Fed Cook speech (likely to follow the hawkish tone from yesterday), followed by the Fed’s Mester.

US CPI report (see the Federal Reserve and repricing has now shifted so significantly that a inflation miss could really conditions are poor, exposing high beta FX currencies to downside risk while the US dollar’s safe-haven allure

EUR/USD ECONOMIC CALENDAR

image1.png

ECB INTEREST RATE PROBABILITIES

Money markets clearly show a preference for a 25bps increment in May but half a basis point may be a possibility as the systemic impact of the banking crisis seems to be waring off. That being said, the primary focus for EUR/USD this week will come from US centric data which if disappoints, could see the 1.10 level back under consideration for the first time since February this year.

image2.png

TECHNICAL ANALYSIS

EUR/USD DAILY CHART

image3.png

Daily EUR/USD price action shows the developing ascending triangle pattern (black) gaining traction by pushing up against triangle resistance at the 1.0900 psychological handle. This traditionally bullish continuation pattern provides ominous signs for bears and a confirmation close above 1.0900 via fundamental data could open up a run at 1.1000.

The Relative Strength Index (RSI) suggests a move up towards 1.1000 may not have the legs to push further with the RSI likely reflecting an overbought signal at that point.

Resistance levels:

  • 1.1000
  • 1.0900/Triangle resistance

Support levels:

  • Triangle support
  • 1.0800

IG CLIENT SENTIMENT DATA: BULLISH

IGCS shows retail traders are currently SHORT on EUR/USD, with 64% of traders currently holding short positions (as of this writing). At DailyFX we typically take a contrarian view to crowd sentiment resulting in a short-term upside disposition.

German DAX and UK FTSE Price Action: Is DAX Turning Bullish? Dead-Cat Bounce in FTSE?

German DAX and UK FTSE Price Action: Is DAX Turning Bullish? Dead-Cat Bounce in FTSE?

DAX TECHNICAL FORECAST – NEUTRAL

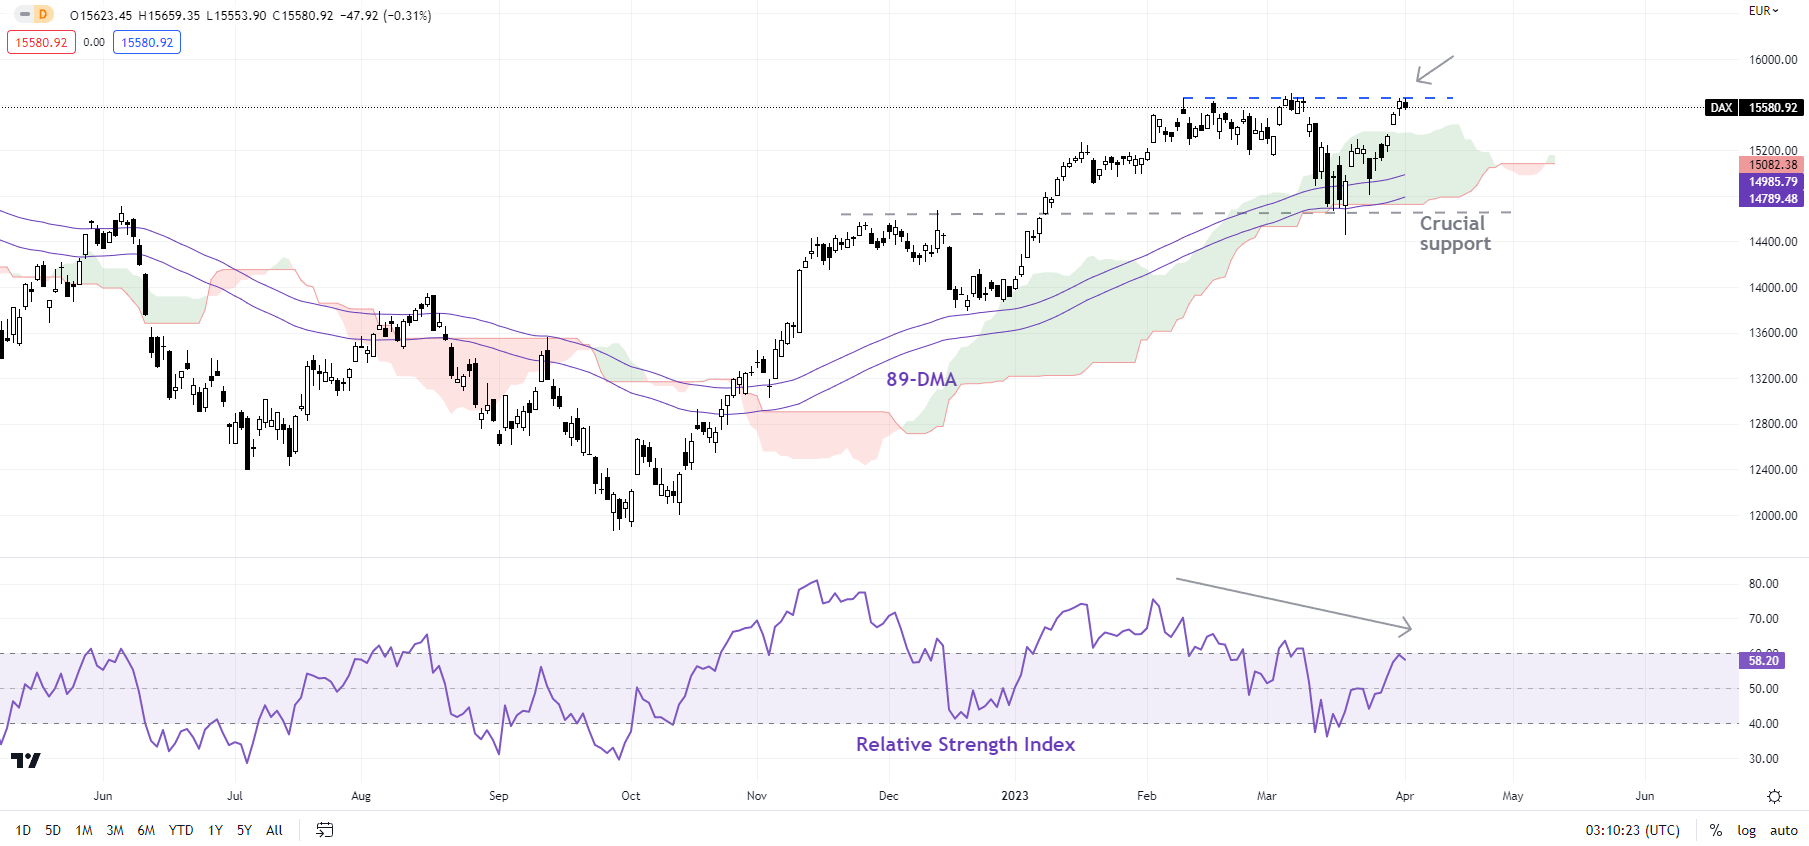
The strong rebound in the German DAX index over the past two weeks may have been an encouraging sign for bulls. However, the index may not be ripe for a bullish break just yet. That is, the recent sideways price action could continue in the interim.

DAX INDEX Daily Chart

image1.png

The index, up nearly 8% since late March, is now testing quite a strong ceiling at the March high of 15706. This follows a rebound last month from a fairly strong converged cushion – the 89-day moving average, the lower edge of the Ichimoku cloud on the daily chart, and the end-2022 highs. However, the colour-coded candlestick charts suggest that the index remains in a consolidation phase that started in late February.

DAX INDEX Daily Chart

image2.png

Moreover, a negative divergence (rising index associated with declining momentum) on the weekly charts indicates that the two-week-long rally is losing steam. This divergence raises the bar for the index to decisively break above the crucial ceiling. While this doesn’t mean that the broader uptrend is reversing, it implies ‘more of the same’ – that is, the recent consolidation/sideway range could continue.

FTSE INDEX Daily Chart

image3.png

As the broader uptrend is in place, the break of the 15706 resistance appears to be a matter of time, but not imminently. On the other hand, only a break below immediate support at 14458 would indicate that the upward pressure had eased.

FTSE TECHNICAL FORECAST – NEUTRAL

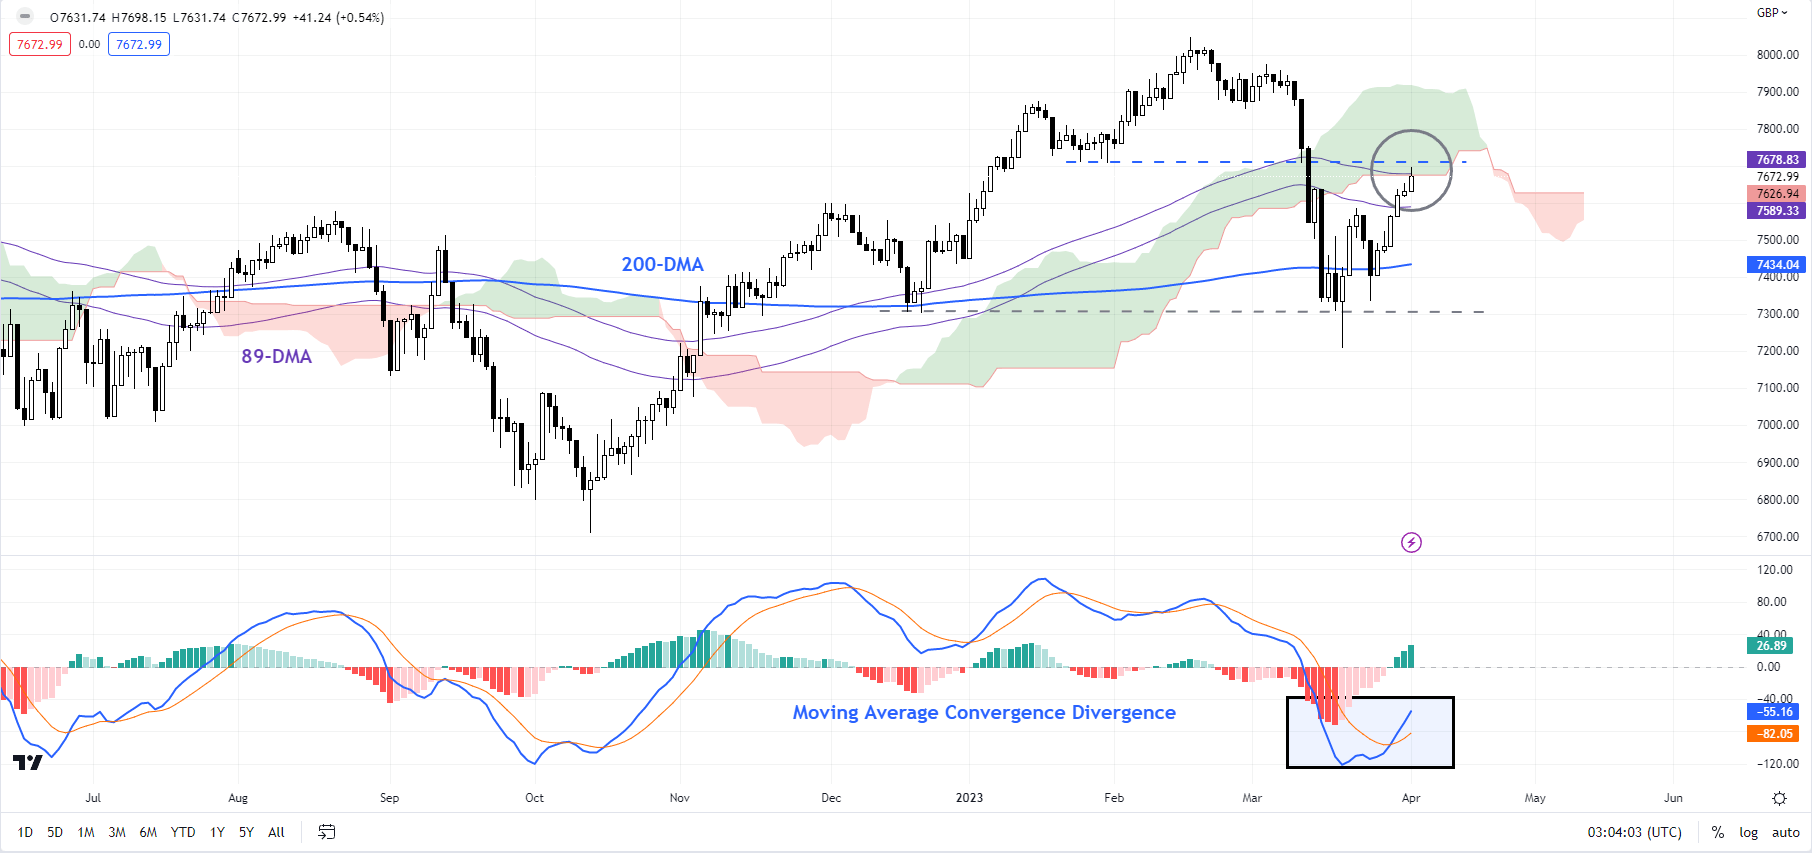
The UK FTSE 100 index is running into a vital cap: the 89-day moving average, the lower edge of the Ichimoku cloud on the daily chart, near the January low of 7708. Importantly, while the upward momentum has seemingly picked up for now, the Moving Average Convergence Divergence indicator remains firmly in bearish territory.

FTSE INDEX Monthly Chart

image4.png

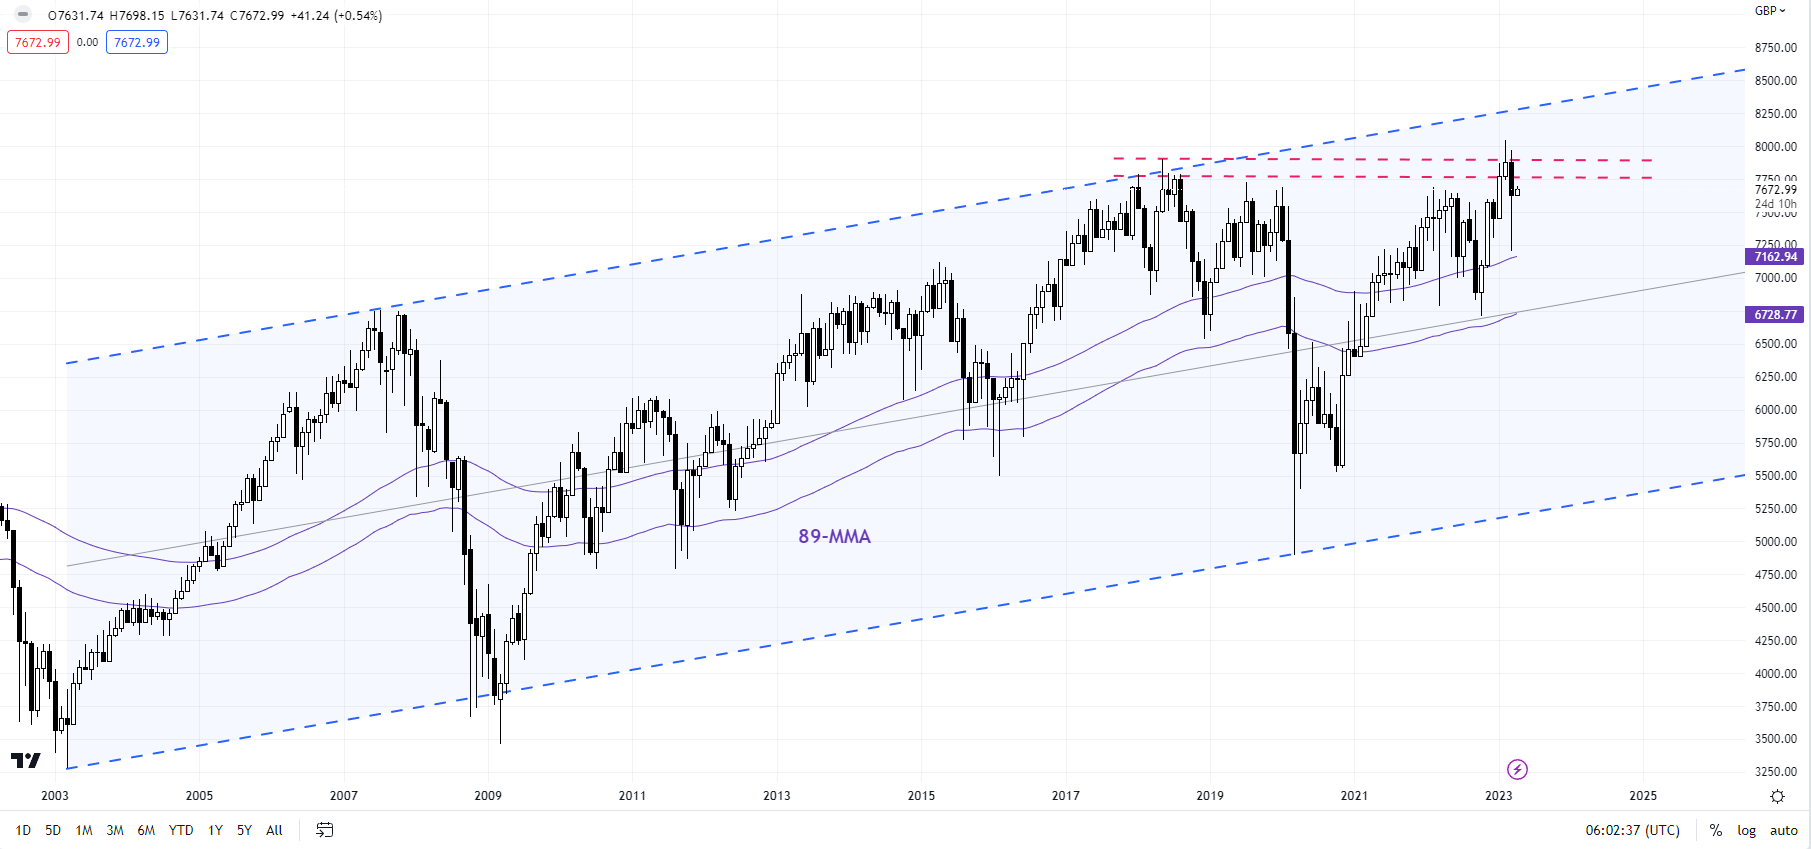
This follows a sharp retreat from near major hurdle at the 2018 high of 7904, pushing the index down toward the 200-day moving average. The rebound since is corrective and FTSE would need to clear the immediate barriers around 7650-7710 for the uptrend to resume. For the moment, though, the bar is rather high for the UK benchmark index to continue its two-week-long rebound.

GBP/USD to struggle to break 1.25 as BoE’s Huw Pill speech could weigh on Sterling – ING

GBP/USD to struggle to break 1.25 as BoE’s Huw Pill speech could weigh on Sterling – ING

Sterling continues to perform well and is certainly taking advantage of a weaker Dollar. Today, a speech from BoE’s Huw Pill could weaken the GBP, economists at ING report.

Look out for a speech from Huw Pill

“GBP/USD is now approaching strong resistance in the 1.2450/2500 area. These levels could be tested today should the US data come in on the soft side.”

“Should Huw Pill choose to play up the welcome signs of easing constraints in the UK labour market, expectations of future BoE tightening may dwindle and Sterling should weaken. For that reason, we are reluctant to call for an early GBP/USD break above 1.25 and equally we think EUR/GBP should stay supported ahead of 0.8750.”

“We continue to target 0.90 later this year for EUR/GBP.”

EUR/USD clings to recovery gains around 1.0900 as US Dollar struggles

EUR/USD clings to recovery gains around 1.0900 as US Dollar struggles

EUR/USD is hovering around 1.0900, as the Euro bulls manage to regain control early Tuesday. The US Dollar struggles to find demand amid a mixed market mood and sluggish US Treasury bond yields. Mid-tier US data, Fedspeak eyed.

The daily chart for the EUR/USD pair shows that technical indicators turned flat within positive levels after a corrective decline, suggesting limited selling interest. At the same time, the pair keeps developing above bullish moving averages, with the 20 Simple Moving Average (SMA) now converging with long-term Fibonacci support, the 61.8% retracement of the 2022 yearly decline at 1.0745.

The 4-hour chart shows that bulls are battling to regain control. Technical indicators changed course after nearing oversold readings and currently head north above their midlines, although with limited strength. Meanwhile, the 100 SMA maintains its bullish slope below the aforementioned daily low, but EUR/USD struggles to overcome a directionless 20 SMA. Buyers could have better chances if the pair breaks through 1.0910, the immediate resistance level.

Support levels: 1.0830 1.0790 1.0750

Resistance levels: 1.0910 1.0950 1.1000