British Pound Q2 2023 Fundamental Forecast: Waiting for Inflation to Fall

British Pound Q2 2023 Fundamental Forecast: Waiting for Inflation to Fall

The British Pound is barely above its Q1 opening level with GBP/USD constrained in a six-point, sideways trading range since the start of the year. And this is not really surprising as the first quarter of 2023 has not delivered any major domestic policy moves or economic shocks to steer Sterling decisively one way or another. Interest rates have followed their expected path higher – currently at 4.25%, the highest level since 2008 – while PM Rishi Sunak and Chancellor Jeremy Hunt continue to steer a steady course and have so far avoided the pitfalls of the previous regime. The relationship between the UK and the European Union is also looking healthier with UK MPs backing PM Sunak’s new Northern Ireland deal, overriding Boris Johnson’s contentious Brexit accord agreed upon in 2019.

Inflation in the UK however remains in double-digits – currently 10.4% – a level that in normal circumstances would continue to require ongoing tightening of monetary policy by the central bank. However, according to the latest Bank of England Monetary Policy Report, inflation ‘is expected to fall significantly in Q2 2023’ due to the extension of the Energy Price Guarantee (EPG) announced in the recent budget and the fall in wholesale energy prices.

image1.png

With price pressures expected to ease sharply, the BoE may not need to hike rates aggressively in the coming months, if at all. The next Bank of England meeting is in mid-May allowing Governor Bailey plenty of time to digest a range of fresh inflation, growth, and jobs data. The latest BoE rate hike probabilities show one 25bp rate hike expected in Q2 before the central bank hits the pause button.

image2.png

Monthly UK GDP is estimated to have increased in January 2023 by 0.3%, according to updated Office for National Statistics (ONS) data, following a 0.5% decline in December. According to the ONS, monthly GDP is now seen at 0.2% below its February 2020, pre-coronavirus levels. With growth edging higher, and inflation expected to fall, the BoE may hold back on further rate hikes if data permits.

image3.png

While domestically the UK may seem to be in a state of calm, external factors could quickly change this. Fears that contagion from recent bank failures in the US may creep over the Atlantic remain, while the emergency bailout and forced purchase of Credit Suisse by peer UBS is also ringing alarm bells at the UK central bank. The BoE’s Financial Policy Committee (FPC) recently said that the UK banking system ‘maintains robust capital and strong liquidity positions’ and that in their assessment, ‘the UK banking system remains resilient’.

Looking ahead, the British Pound may continue to move sideways to gently higher against the US dollar. The greenback is under pressure and weakening as traders continue to price in an end to the Federal Reserve’s rate hiking regime.

Disclaimer

DailyFX Market Opinions

Any opinions, news, research, analyses, prices, or other information contained in this report is provided as general market commentary and does not constitute investment advice. DailyFX will not accept liability for any loss or damage, including without limitation to, any loss of profit, which may arise directly or indirectly from the use of or reliance on such information.

Accuracy of Information

The content in this report is subject to change at any time without notice and is provided for the sole purpose of assisting traders to make independent investment decisions. DailyFX has taken reasonable measures to ensure the accuracy of the information in the report, however, does not guarantee its accuracy, and will not accept liability for any loss or damage which may arise directly or indirectly from the content or your inability to access the website, for any delay in or failure of the transmission or the receipt of any instruction or notifications sent through this website.

Distribution

This report is not intended for distribution, or use by, any person in any country where such distribution or use would be contrary to local law or regulation. None of the services or investments referred to in this report are available to persons residing in any country where the provision of such services or investments would be contrary to local law or regulation. It is the responsibility of visitors to this website to ascertain the terms of and comply with any local law or regulation to which they are subject.

High-Risk Investment

Trading in financial markets, foreign exchange, indices, and commodities on margin carries a high level of risk and may not be suitable for all investors. The high degree of leverage can work against you as well as for you. Before deciding to trade in financial markets, foreign exchange, indices, and commodities, you should carefully consider your investment objectives, level of experience, and risk appetite. The possibility exists that you could sustain losses in excess of your initial investment. You should be aware of all the risks associated with financial markets, foreign exchange, indices, and commodities trading and seek advice from an independent financial advisor if you have any doubt

Bitcoin Technical Outlook: Candlestick Patterns Suggest Bullish Continuation is Possible in Q2

Bitcoin Technical Outlook: Candlestick Patterns Suggest Bullish Continuation is Possible in Q2

Bitcoin Technical Outlook: Candlestick Patterns Suggest Bullish Continuation is Possible in Q2

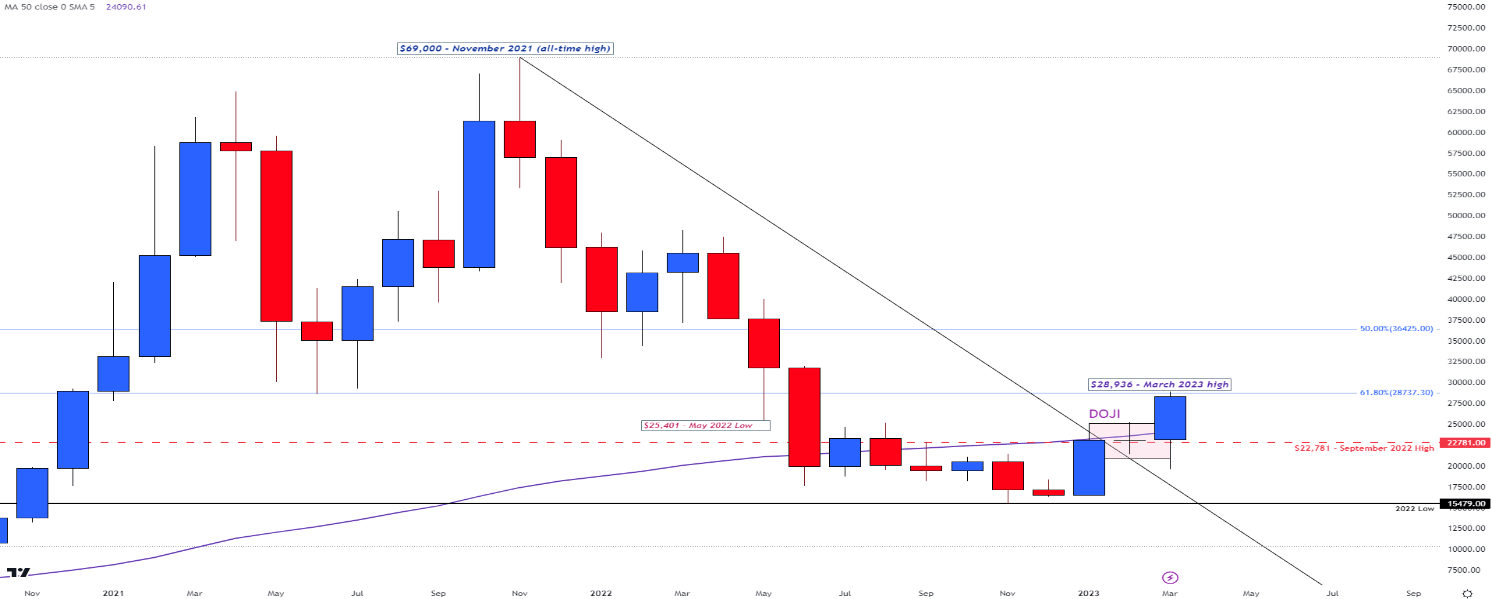
In the first quarter of 2023, Bitcoin (BTC/USD) benefited from a reduction in rate expectations and other fundamental catalysts that resulted in a leap in price action, gaining over 70%. Question is, will bulls hold onto control and drive prices to pre-war levels?

From a technical standpoint, the last three candlesticks on the monthly chart represent the first quarter’s price action.

Although this article focuses on the technical drivers of price action, our fresh Q2 guide provides an in-depth overview of fundamental factors that could contribute to determining the underlying trend.

Summary of Q1 Price Action:

  • January (long, full-bodied candle) – Bitcoin prices surge, rising by nearly 40% before running into a barrier of resistance around the September 2022 high of $22,781.
  • February (prices open and close around the same level, just above the September 2022 high) – In technical analysis, the doji is a single-candlestick pattern that develops when a narrow-body forms in the middle of the monthly range (Feb high and low). As bulls and bears fail to gain traction, prices settle around the monthly open, suggestive of indecision.
  • March (full-body candle with long lower-wick) – With the failure of the above-mentioned banks boosting the demand for Bitcoin, prices pushed through another big level of prior resistance now holding as support at the 50-month MA (moving average).

Bitcoin (BTC/USD) Monthly Chart

image1.png

Source: TradingView

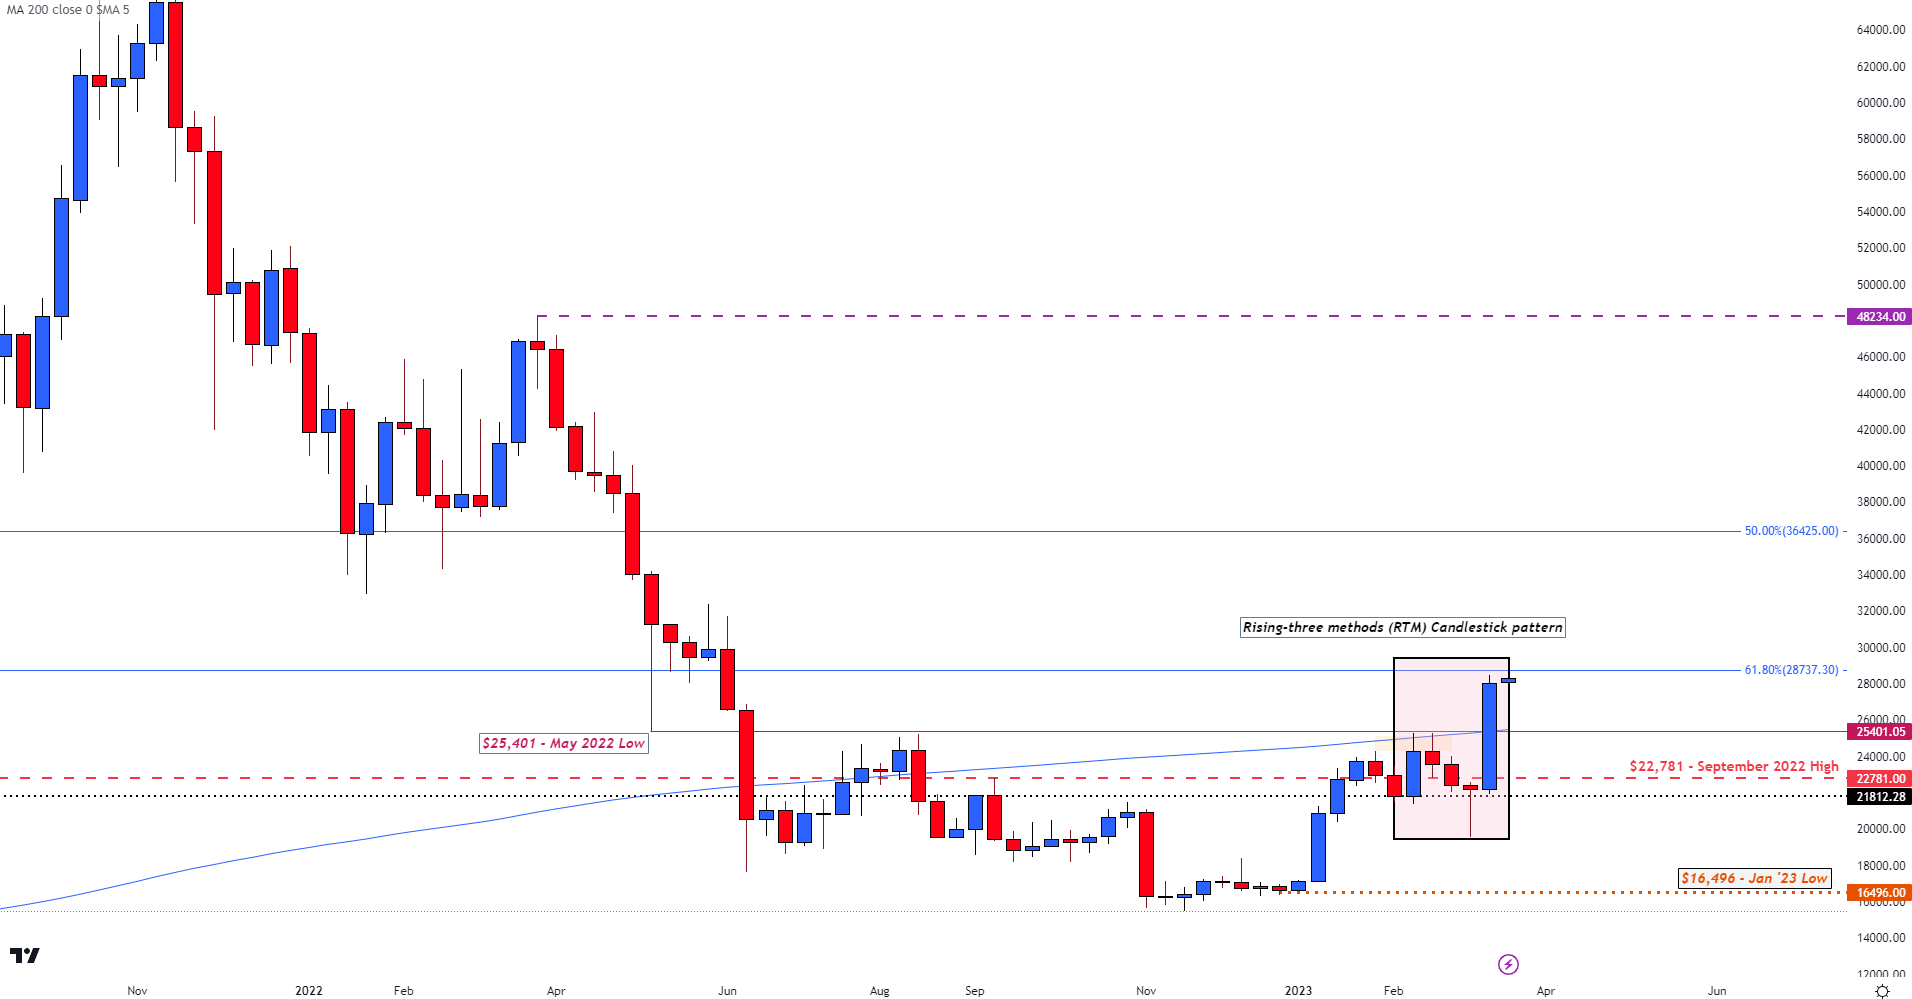
By homing in on the medium-term fluctuations in prices, the weekly chart can assist in highlighting additional levels of support and resistance. After a brief retest of the 200-day MA (just above the psychological level of $25,000) prices suffered a mild pullback, forcing BTC lower. However, with the failure of SVB triggering another rally, Bitcoin ripped higher before setting a new 2023 high of $28,936.

Recommended by Tammy Da Costa
Get Your Free Introduction To Cryptocurrency Trading
Get My Guide

This resulted in what is known as the rising three methods pattern (a five-candlestick pattern that indicates a continuation of the existing uptrend).

Bitcoin (BTC/USD) Weekly Chart

image2.png

Source: TradingView

Bitcoin (BTC/USD) – Looking Ahead: Technical Levels to Watch in Q2, 2023

Over the next 12 weeks, changes in sentiment could drive Bitcoin prices in either direction. With prices currently trading around the 61.8% retracement of the 2020 – 2021 move ($28,737), bulls will need to hold above this level to remain in control of the short and longer-term trend. Above that lies another key level of historical resistance at the psychological level of $32,000 and then the mid-point of the above-mentioned move at $36,425.

However, if fundamental factors weigh on price action, BTC could fall back to $27,000 before plunging to the next level of support at the 200-week MA (currently at $25,460). Below that is the September 2022 high, a break of which could drive prices back to the December 2017 high at $19,666.

Euro Breaking News: Core Inflation Reaches New High, Validating ECB Hawks

Euro Breaking News: Core Inflation Reaches New High, Validating ECB Hawks

Euro Zone Inflation Rises in March

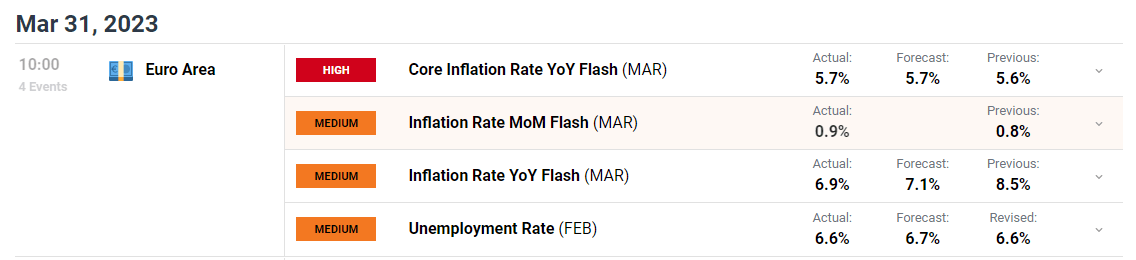
The year-on -year headline measure of EU inflation posted a massive decline, coming in at 6.9% vs a forecast of 7.1%, but the real kicker reveals a drop from last month’s (YoY) reading of 8.5%. Despite the rapid YoY decline, March CPI actually rose 0.9% from February, vindicating ECB hawks and their views that markets have been underappreciating the degree to which interest rates can climb.

However, everyone remains focused on core CPI as it is a better measure of how wide-spread inflation has proven to be. As such, the reading strips out more volatile items such as fuel, energy, alcohol, and tobacco. Core inflation reached a new high of 5.7% in March and it is this measure that carries the most weight from a monetary policy perspective.

image1.png

Customize and filter live economic data via our DailyFX economic calendar

Immediate Market Reaction

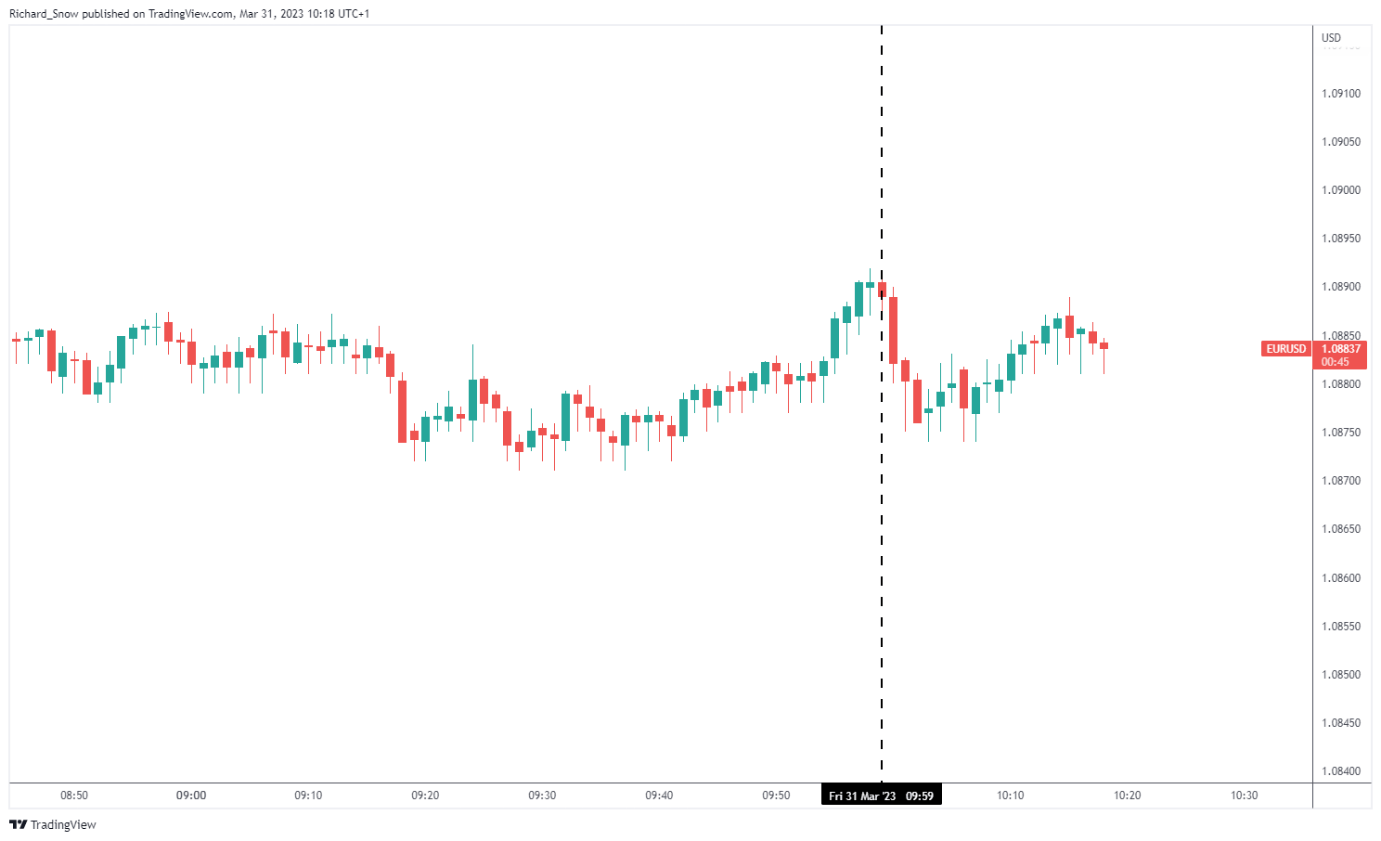
EUR/USD dipped slightly after the data release but has somewhat recovered to levels prevailing in the moments before.

EUR/USD 1-Min Chart

image2.png

Fundamental Factors Align, Highlighting EUR/USD Upside Potential

General risk sentiment has turned positive this week, as more news of enhanced regulations on smaller US banks makes the rounds. This comes after a string of supportive actions form major central banks and the Fed in particular to shore up confidence in the global banking system. A greater propensity to chase higher returns, given these new safeguards has convinced investors to drift away from safe-havens like the dollar, in search of more attractive alternatives.

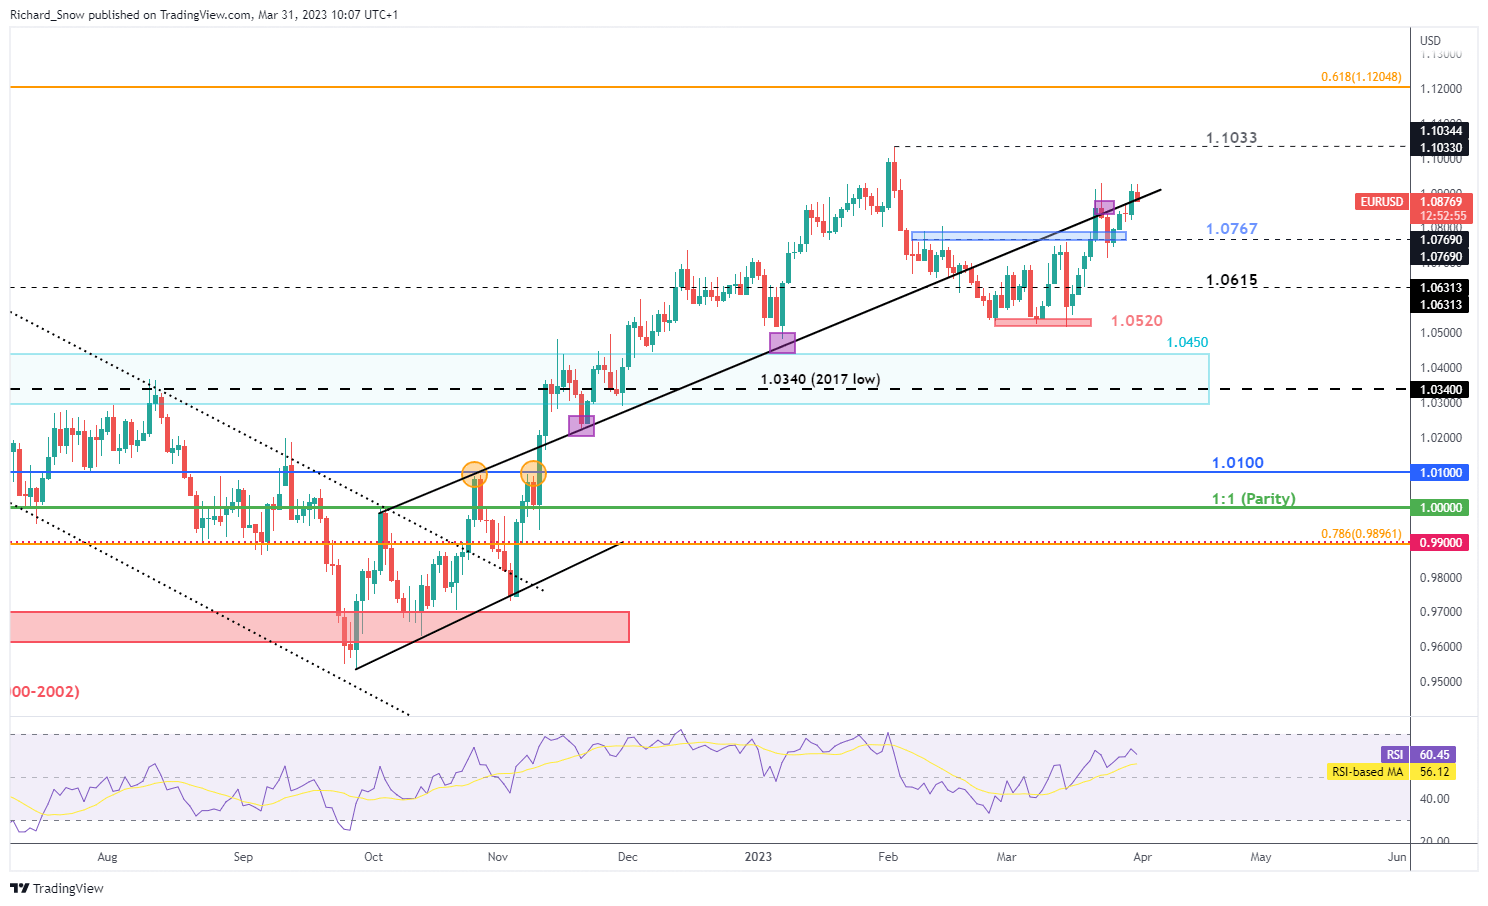
EUR/USD has been a beneficiary of this shift as diverging interest rate expectations have helped the pair trade higher. In the absence of further news of distressed US banks, the pair could be eying 1.10 but risks to the downside can not be ruled out.

EUR/USD Daily Chart

image3.png


Breaking UK News: UK Growth Revised Higher, GBP/USD Nears A Multi-Week High

Breaking UK News: UK Growth Revised Higher, GBP/USD Nears A Multi-Week High

The UK economy expanded by 0.1% in Q4 2022, and data released by the Office for National Statistics (ONS) showed delayed, one-tenth of a percentage above expectations. The Q3 data was also revised higher by the same amount to -0.1%.

image1.png

For all market-moving data releases and events, see the DailyFX Economic Calendar

According to the ONS,

‘The level of quarterly GDP in Quarter 4 2022 is now 0.6% below its pre-coronavirus (COVID-19) level (Quarter 4 2019), revised up from the previous estimate of 0.8% below. GDP is now estimated to have increased by 4.1% in 2022, revised up from the previous estimate of 4.0%. Compared with the same quarter a year ago, real GDP increased by 0.6%.’

UK GDP Quarterly National Accounts – October to December 2022

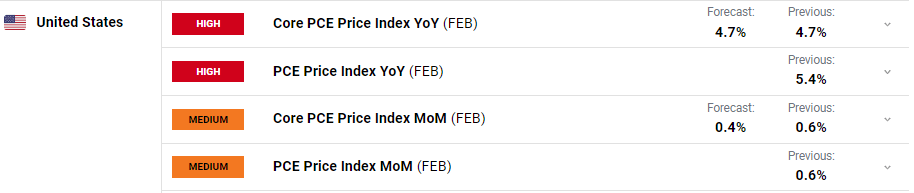
Cable (GBP/USD) pushed marginally higher on the ONS release and back above 1.2400 for the first time in a month. Sterling has been slightly better bid over the last few weeks against the US dollar. The greenback remains under pressure from ongoing market expectations that the Fed may finally have finished their aggressive rate hiking cycle with expectations also building that the US central bank may start cutting rates at the end of Q3/start of Q4. This afternoon (13:30 UK) we get the latest look at US price pressures with the release of the closely monitored US core PCE data. If inflation is the US remains stubbornly high and sticky, these rate-cut expectations will disappear, boosting the value of the US dollar.

image2.png

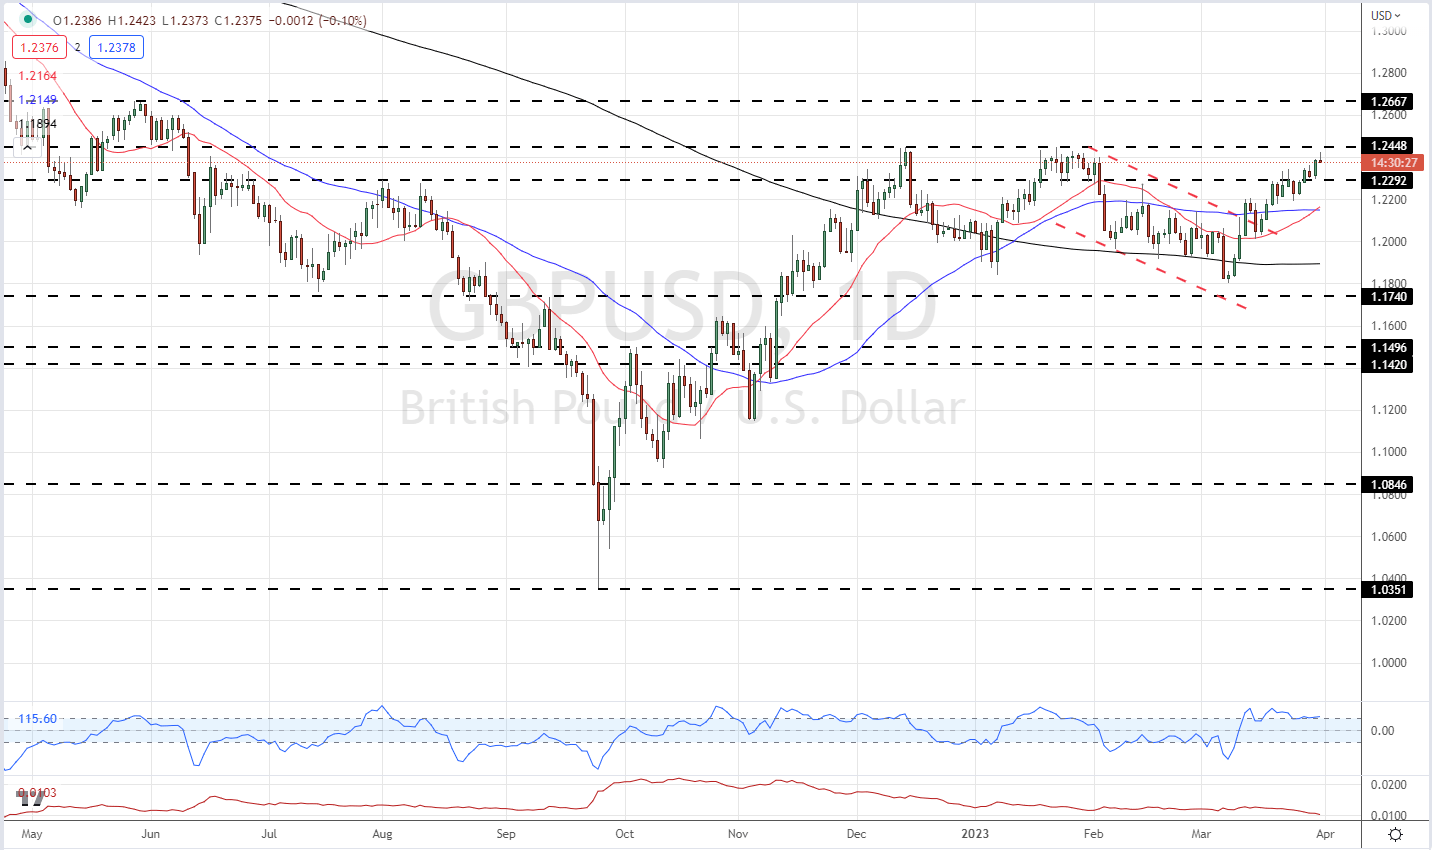
Looking at the daily GBP/USD chart, while the pair may start to look expensive, using the CCI indicator, the rest of the set-up remains positive. Cable trades above all three moving averages, which are now in a positive order, while recent resistance turned support around the 1.2292 level continues to hold. The recent double top around 1.2448 is looking vulnerable to any move higher and a confirmed break above this level would leave 1.2667 as the next point of resistance.

GBP/USD Daily Price Chart – March 31, 2023

image3.png

Chart via TradingView

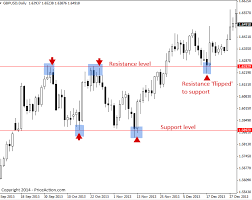
Support & Resistance lines – make or break price points

Support & Resistance lines – make or break price points

From a strategic point of view, support and resistance levels represent smart places to anticipate a reaction in the price of an asset, and therefore represent a basic tool in technical analysis.
Numerous traders use them, but the diversity in application and integration tell us that charting is definitely not an exact science and more of an art.

One of the most common mistakes that new traders make is buying too close to a line of resistance or selling too close to a line of support. In this page we provide enough set-ups and real-time examples, to make sure you thoroughly understand this simple yet important dynamic.

EUR/USD drops below 1.0900 after dismal German data, EU/ US inflation eyed

EUR/USD drops below 1.0900 after dismal German data, EU/ US inflation eyed

EUR/USD is extending the pullback below 1.0900 after Germany’s Retail Sales disappointed by a wide margin early Friday. The pair retreats from weekly highs amid a broad US Dollar rebound, as investors turn cautious ahead of the Eurozone and US inflation data.

From a technical perspective, nothing seems to have changed for the major and the near-term bias still seems tilted firmly in favour of bullish traders. Hence, any meaningful slide below the 1.0900 mark is more likely to find decent support near the 1.0855-1.0850 region. This is followed by the overnight low, around the 1.0825 area, and the 1.0800 round figure.

A convincing break below the latter might prompt some technical selling and drag the EUR/USD pair towards the 50-day Simple Moving Average (SMA) resistance breakpoint, currently around the 1.0730 zone. Some follow-through selling below the 1.0700 mark should pave the way for a slide towards testing the 100-day SMA support near the 1.0640 region.

On the flip side, bulls might now wait for a move beyond the 1.0925 region, or the monthly peak, before placing fresh bets. The EUR/USD pair might then accelerate the momentum towards reclaiming the 1.1000 psychological mark and eventually climb to the 1.1030-1.1035 zone, or a ten-month peak touched in February.

The US Dollar (USD) remains depressed amid the uncertainty over the Federal Reserve’s (Fed) rate hike path and turns out to be a key factor acting as a tailwind for the major. The shared currency, on the other hand, draws support from slightly higher-than-expected German consumer inflation data released on Thursday, which reaffirmed bets for additional interest rate hikes by the European Central Bank (ECB).

It is worth recalling that the Fed had signalled recently that it might soon pause the rate-hiking cycle in the wake of the turmoil in the banking sector. That said, hopes that a widespread banking crisis might have been averted fueled speculations that the US central bank might move back to its inflation-fighting interest rate hikes. Furthermore, three Fed officials on Thursday backed the case for more rate increases to lower high levels of inflation. In fact, Boston Fed President Susan Collins said that raising interest rates by another 25 bps in March was appropriate and that there is more work to do to bring inflation down to the 2% target.

Separately, Minneapolis Fed President Neel Kashkari also noted that the central bank has more work to do to get inflation back to its 2% goal. Adding to this, Richmond Fed President Thomas Barkin said in a speech, “If you back off on inflation too soon, inflation comes back stronger, requiring the Fed to do even more, with even more damage.” Policymakers, meanwhile, added a note of caution about the uncertainty of what lies ahead, with two acknowledging that banking sector problems could generate enough headwinds on the economy to help cool price pressures faster than expected. This, along with slightly higher-than-expected US Jobless Claims and the prevalent risk-on environment, continues to weigh on the safe-haven buck.

The US Department of Labor (DOL) reported that the number of Americans filing for unemployment insurance for the first time rose to 198K during the week ended March 25 from the 191K previous. Meanwhile, the preliminary estimates for Germany indicated an increase in consumer prices by 0.8% in March and a 7.4% YoY pace. This sparks speculation of a potential upside surprise in the Eurozone CPI due this Friday. Investors will further take cues from the US Core PCE Price Index – the Fed’s preferred inflation gauge – due later during the early North American session. Apart from this, a scheduled speech by ECB President  Christine Lagarde should provide some meaningful impetus to the EUR/USD pair on the last day of the week.

China PMIs beat expectations, supporting AUD/USD into resistance

China PMIs beat expectations, supporting AUD/USD into resistance

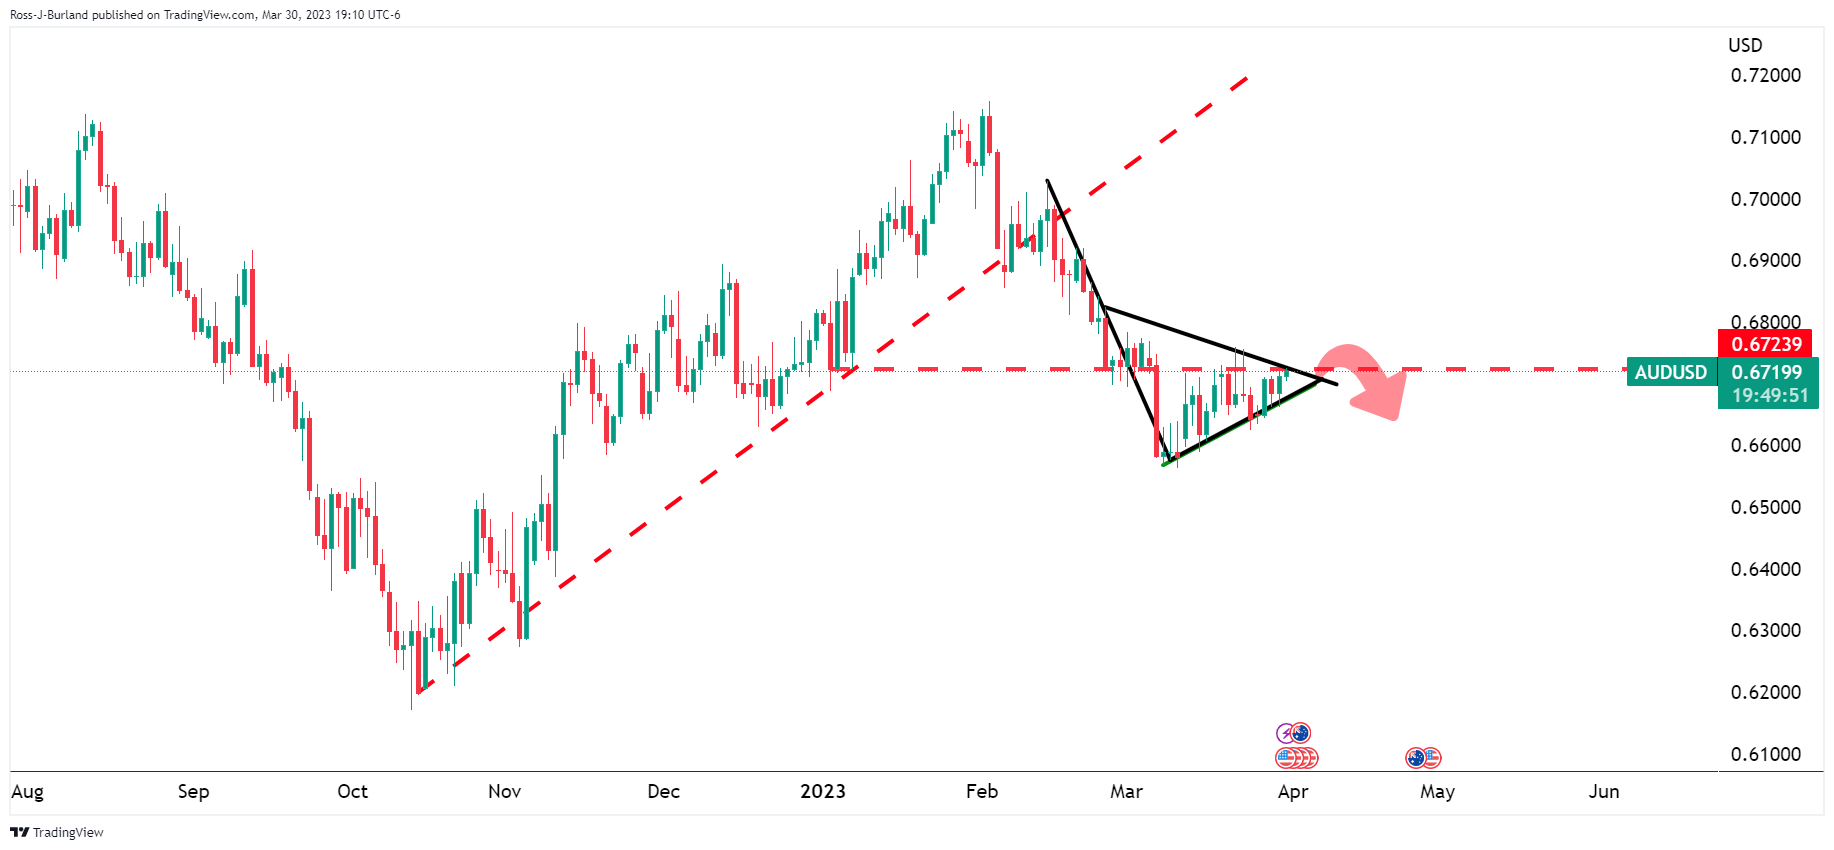
AUD/USD is a touch higher as China’s March Official PMI Manufacturing arrived at 51.9 vs. the expected 51.5 while Services came in at 58.2 vs. the expected 54.3.

AUD/USD update

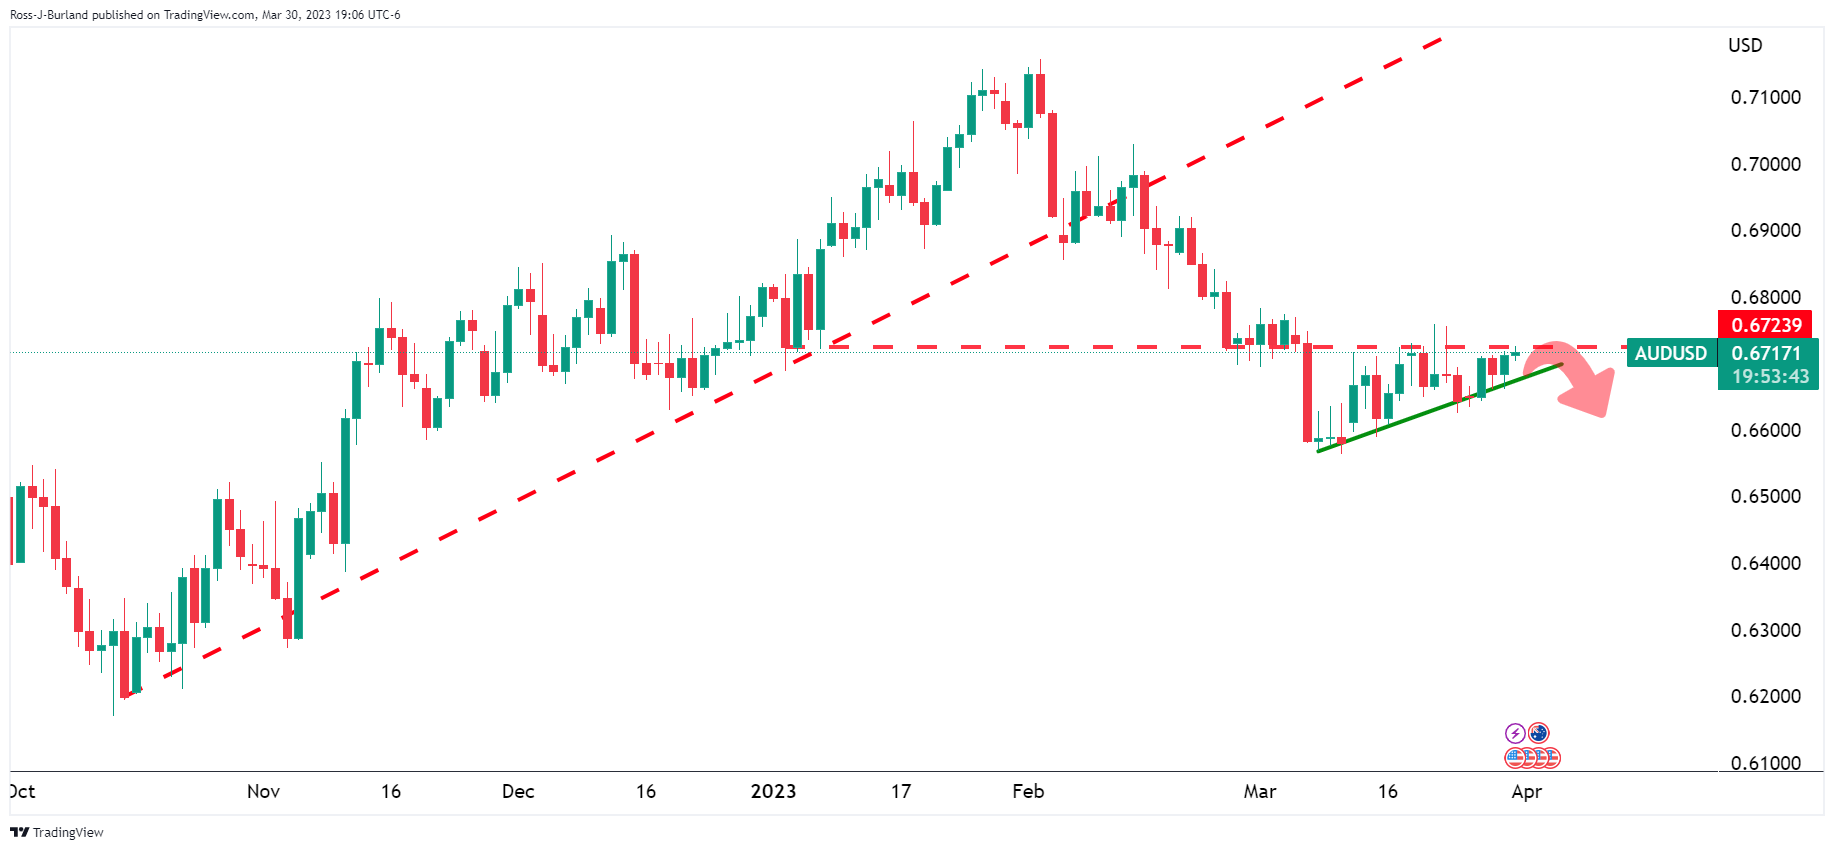
The Australian Dollar edged higher on Friday as banking fears calmed a little, while bonds were boasting their best month in a decade after expectations for rate hikes were reined in. The Chinese data has helped to keep the bid alive and the price is moving firmer into resistance as the following illustrates:

AUD/USD daily chart

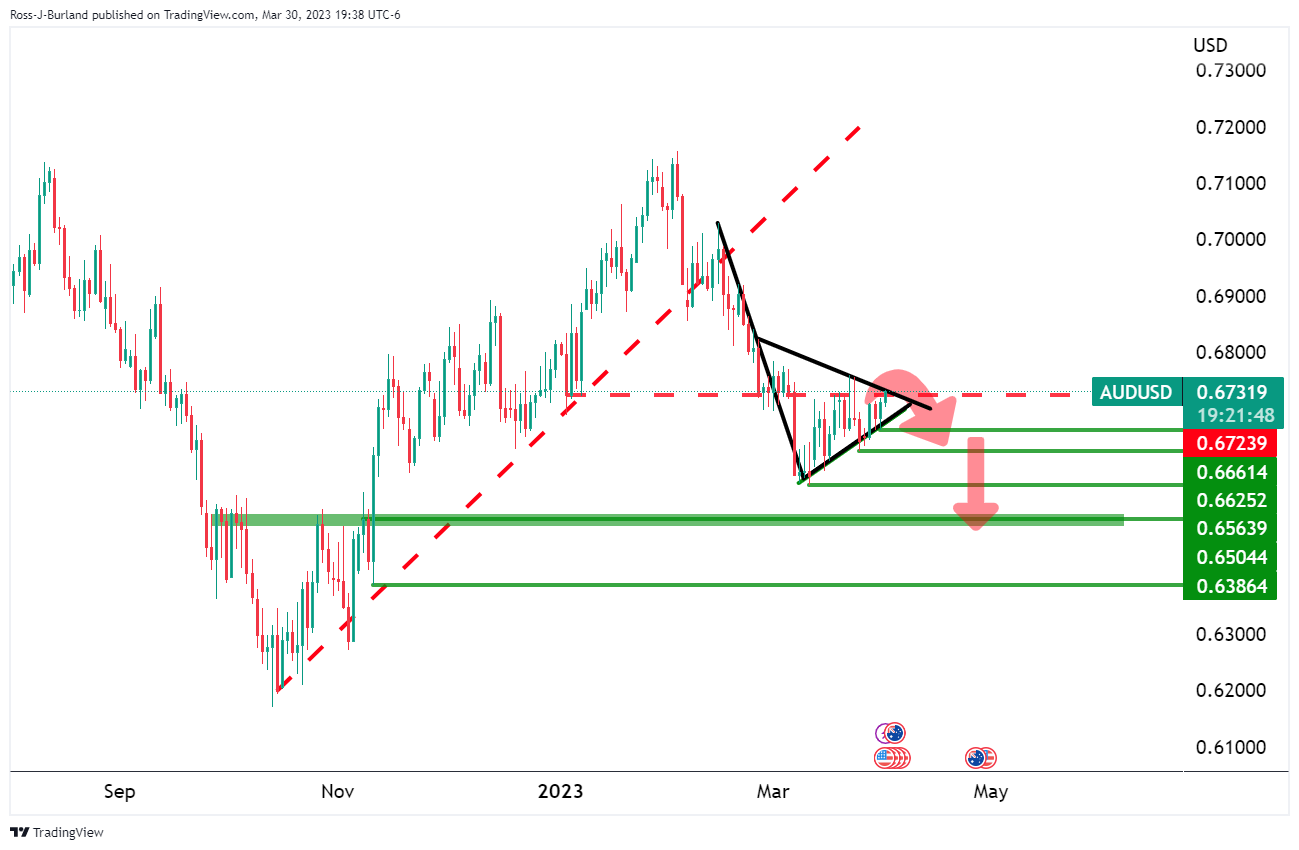
However, overall, the bears are in the market near a structure point that was broken earlier in the month that has been acting as resistance ever since. As a result, a bearish pennant has been carved out on the daily chart and traders are on the lookout for an explosive breakout of the coiled market conditions with 0.65 eyed:

About the data

The monthly manufacturing PMI is released by China Federation of Logistics and Purchasing (CFLP) on the last day of every month. The official PMI is released before the Caixin Manufacturing PMI, which makes it even more of a leading indicator, highlighting the health of the manufacturing sector, considered as the backbone of the Chinese economy. The data is of high relevance for the financial markets throughout several asset classes, given China’s influence on the global economy.

China Federation of Logistics and Purchasing (CFLP) publishes the non-manufacturing PMI on a monthly basis. The gauge highlights the performance of China’s service sector, which has a significant impact on the global FX market, given the size of the Chinese economy. An expansion in the Chinese service sector activity points to signs of economic improvement and vice-versa.

USD/CAD Mauled as Canadian Dollar Bulls Pounce, Key Support at Risk of Cracking

USD/CAD Mauled as Canadian Dollar Bulls Pounce, Key Support at Risk of Cracking

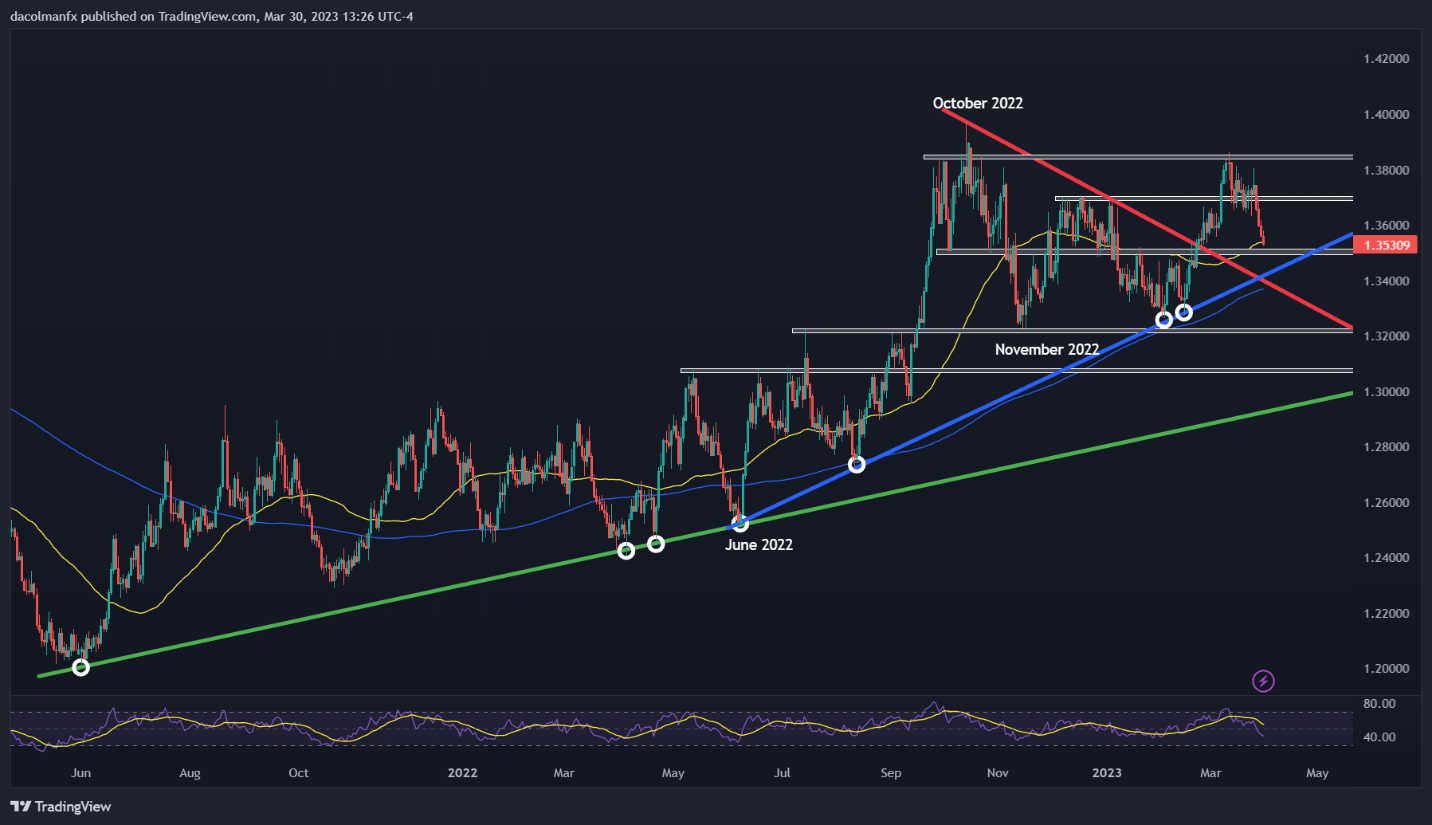
The Canadian dollar, colloquially known as the loonie by forex traders, continued to appreciate on Thursday, supported by widespread U.S. dollar weakness, risk-on sentiment on Wall Street and rising oil prices, with USD/CAD retreating more than 0.2% to 1.3530, the lowest exchange rate in a week.

After falling more than 2.4% from the 2023 highs reached on March 10, the pair is currently sitting above an important technical support zone located near the psychological 1.3500 level and the 50-day simple moving average, as seen on the daily chart below. Traders should keep a close eye on the pair’s behavior in this area for clues on the near-term direction.

For bearish conviction to strengthen, USD/CAD must break below 1.3500 decisively on daily closing prices. With global market sentiment on the mend, this scenario could unfold in short order, paving the way for a drop towards trendline support at 1.3420. On further weakness, the focus shifts to the 200-day simple moving average, followed by 1.3220.

Conversely, if bulls manage to wrestle temporary control and drive prices higher, initial resistance can be seen at 1.3700, a barrier that has halted upside momentum in its tracks on numerous occasions in December 2022 and January this year. In the event of a bullish breakout, a retest of the March swing high cannot be ruled out.

USD/CAD TECHNICAL CHART

Chart, histogram  Description automatically generated


US Dollar Continues Diverging from the Fundamentals, Will PCE Data Realign Traders?

US Dollar Continues Diverging from the Fundamentals, Will PCE Data Realign Traders?

Asia-Pacific Market Briefing – US Dollar Keeps Diverging from the Fundamentals

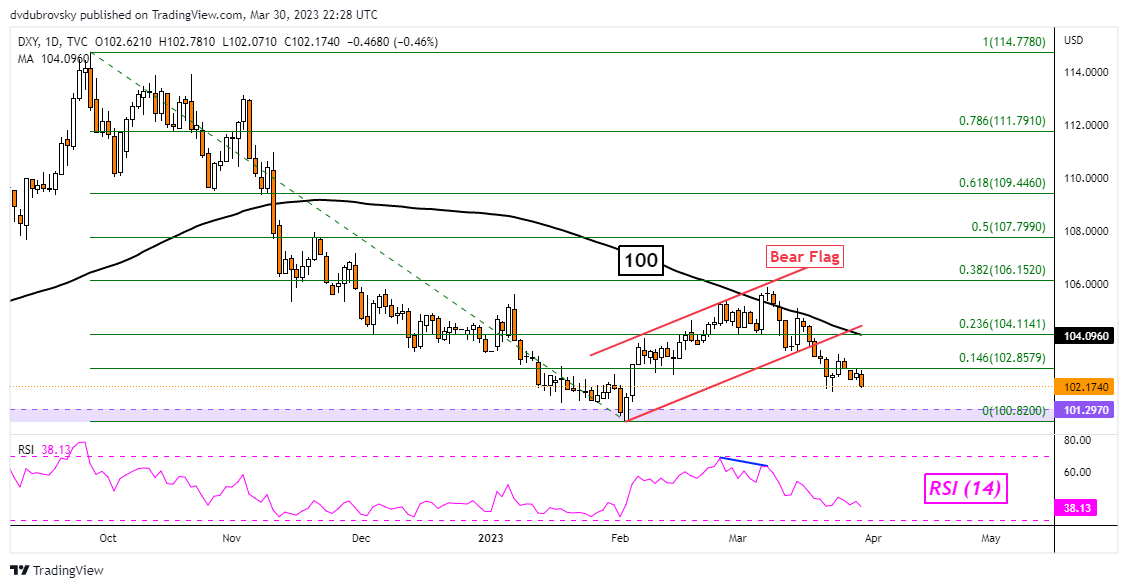
The US Dollar extended lower on Thursday with the DXY Index falling 0.46 percent. As March wraps up, the currency is down about 2.6% and is on course for the worst monthly performance since November.

The haven-linked US Dollar underperformed amidst a general improvement in risk appetite once again. On Wall Street, the tech-heavy Nasdaq 100 rallied 0.9%. This is as the S&P 500 and Dow Jones gained 0.57% and 0.43%, respectively. The VIX market ‘fear gauge’ also fell and is on course for a 12.5% decline this week.

The dollar’s decline occurred despite a lack of dovish commentary from the Federal Reserve. Multiple Fed officials spoke over the past 24 hours. Thomas Barkin, President of the Richmond Fed, noted that he is comfortable with hiking rates by 25-basis point increments. Meanwhile, Susan Collins, President of the Boston Fed, said the central bank needs to hold rates high all year to bring down inflation.

This means that traders have been slowly unwinding rate-cut bets since Silicon Valley Bank’s collapse earlier this month. The 2-year Treasury yield gained on Thursday, further confirming fading Fed rate cut expectations.

Where does this leave the US Dollar going forward? The divergence between USD and Fed policy bets could be setting the stage for a future comeback in the greenback. All eyes turn to PCE data at 12:30 GMT. This is the Fed’s preferred inflation gauge. Stubbornly high inflation could cause markets to focus back on a hawkish Fed, further reducing rate-cut bets. That may benefit USD.

US Dollar Technical Analysis

On the daily chart, the DXY continues to make downside progress after a Bear Flag. This is an increasingly bearish sign. Still, the broader objective for the downside remains the 100.82 – 101.29 support zone, which was established in early February. Clearing this range would open the door to extending the near-term downward bias. Immediate resistance seems to be the 100-day Simple Moving Average (SMA).

US Dollar Technical Analysis

Crude Oil Holds the High Ground as Mood Boosted by China PMI. Higher WTI?

Crude Oil Holds the High Ground as Mood Boosted by China PMI. Higher WTI?

Crude oil has held onto gains made overnight today with the WTI futures contract up over 7% going into the end of the week.

This comes on the back of a 3.5% gain last week as it continues to recover from the 3-month low seen earlier this month. The WTI contract is near US$ 74.50 bbl while the Brent contract is a touch above US$ 79 bbl.

The market was lifted somewhat by Chinese manufacturing PMI coming in at 51.9 against the 51.6 forecasts for March, slightly below February’s 52.6 number. Non-manufacturing PMI was 58.2 against 55 anticipated, up from 56.3 prior.

Gold is steady near USD 1,980 while APAC equities followed Wall Street’s lead into the green today with a buoyant mood across the board.

Japan’s Nikkei 225 has been the outperformer, climbing over 1% at one stage. A weaker Yen appears to be assisting with USD/JPY topping out at 133.50 earlier in the day. That’s almost four big figures from the low of 129.64 seen at this time last week.

Japanese jobs data, Tokyo CPI, retail sales and industrial production all outstripped estimates today. The details can be viewed in detail here.

Futures are pointing to a positive start to the North American equity session. Other currency markets have been relatively quiet so far today.

Comments yesterday from Susan Collins and Neel Kashkari from the Fed appear to have pushed the needle moderately toward a 25 basis point hike at the January Federal Open Market Committee (FOMC) meeting.

They both highlighted the need to tame inflation. Their comments were compounded by US core PCE printing hotter than expected, coming in at 4.4% year-on-year to the end of December rather than 4.3%.

Treasury yields have barely moved today although the 1-year note is back 4.70% and most of the curve is higher over the week.

Looking ahead, after UK GDP, there will a slew of European inflation gauges before Canadian GDP data.

WTI CRUDE OIL MARKET STRUCTURE ANALYSIS

The RBOB crack spread appeared to serve as a harbinger of the recent rally in WTI crude and it remains at a relatively elevated level.

Volatility as measured by the OVX index has eased somewhat with the price appreciation.

The market is fairly neutral when looking at backwardation and contango which may reflect a degree of comfort with the higher oil price.

image1.png