Euro Bounces on Hawkish ECB Ahead of Powell’s Testimony. Higher EUR/USD?

Euro Bounces on Hawkish ECB Ahead of Powell’s Testimony. Higher EUR/USD?

EUR/USD jumped higher to start this week ahead of Federal Reserve Chair Jerome Powell’s testimony to Senate Banking Committee in Washington on Tuesday and Wednesday.

Additional event risk may also lie in the Euro wide GDP figures that will be seen on Wednesday.

Overnight comments from Robert Holzmann boosted the Euro when he said that he could see a 50 basis point lift to rates at the next four European Central Bank (ECB) meetings. Mt Holzmann is a policy maker for the ECB and Governor of Austria’s central bank, the Oesterreichische Nationalbank (OeNB).

Looking forward, it seems that commentary from central bank officials could be the driver for EUR/USD alongside other currency markets and bond markets in general.

The ECB are due to convene on Thursday 16th March ahead of the Fed that will start their gathering the following week on March 22nd.

EUR/USD TECHNICAL ANALYSIS

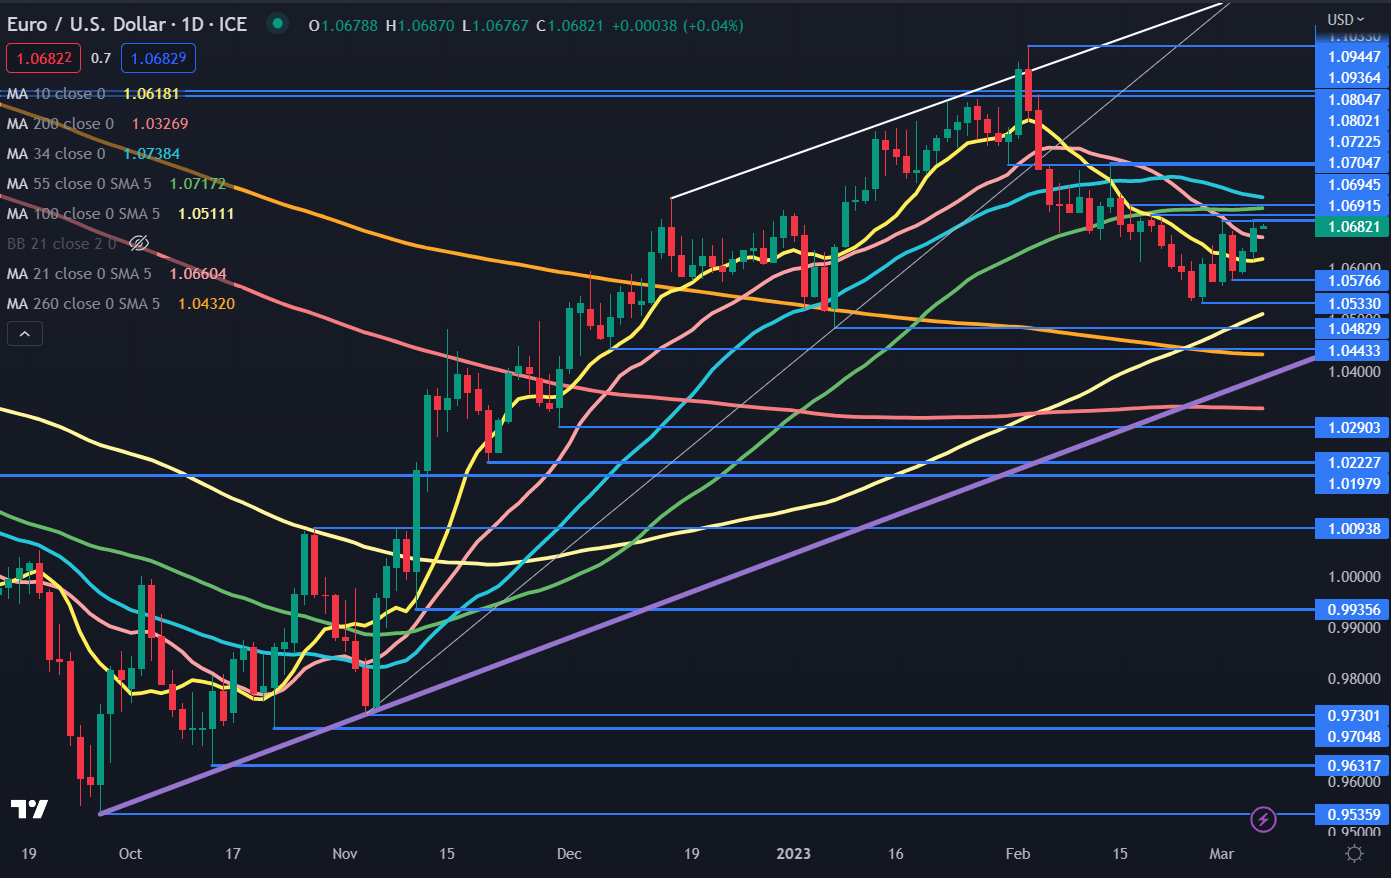
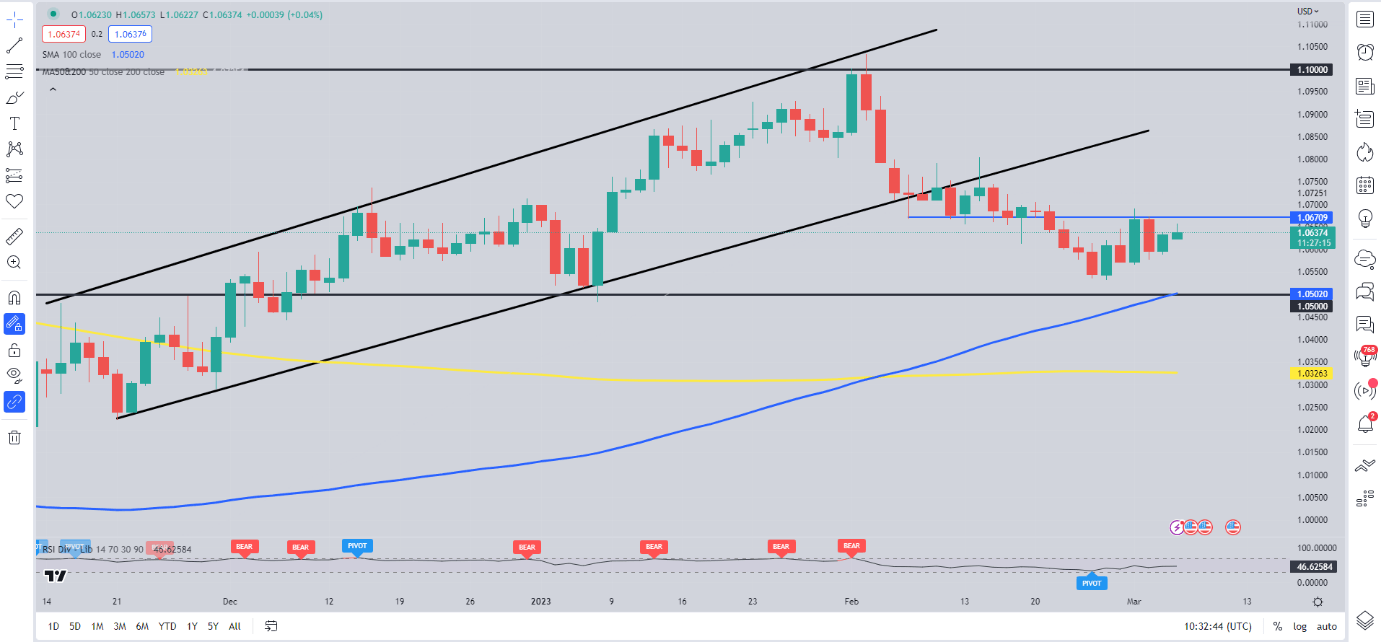
EUR/USD has been in a 1.0533 – 1.0722 range for three weeks despite several attempts to overcome the topside of this range. Those peaks have setup a potential resistance in the 1.0700 – 1.0720 area.

The 55-day simple moving averages (SMA) also currently resides at 1.0717 and may lend possible resistance. The 34-day SMA is also just above there at 1.0738.

The price is currently above the 10-, 100-, 200- and 260 day SMAs and the rally overnight went above the 21-day SMA. If it does move above the 34- and 55-day SMAs, it will be above all short, medium and long-term daily SMAs and might indicate that bullish momentum is evolving.

Resistance could be further up at the breakpoints and prior peaks of 1.0805, 1.0936, 1.0945 and 1.1030.

Overall, EUR/USD remains in an ascending trend channel and support could be at the lower bound of the channel, currently at 1.0390. Ahead of there, the previous lows of 1.0577, 1.0533, 1.0483 and 1.0443 may lend support.

image1.png

Australian Dollar Slides After RBA’s Widely Expected 25-Basis Point Hike

Australian Dollar Slides After RBA’s Widely Expected 25-Basis Point Hike

AUD/USD plunged after the Reserve Bank of Australia hiked the benchmark cash rate by 25 basis points in an attempt to control inflation running at three-decade highs and left the door open for further rate hikes, raising concerns that the central bank could overtighten.

The Reserve Bank of Australia raised the cash rate by a quarter percentage point to 3.60% and said further tightening of monetary policy will be needed. The move was widely expected after inflation rose to a three-decade high last quarter, well above the central bank’s target range of 2%-3%. Last month, the bank abandoned its previous plan to pause at 3.35% and signaled more hikes would be needed. The RBA is not an exception in warning of further tightening. Central bankers, including the US Fed and the European Central Bank, have said more work needs to be done to tackle inflation.

AUD/USD 5-minute Chart

image1.png

Meanwhile, China on Sunday set a growth target of around 5%, below last year’s target of around 5.5% at the annual session of its National People’s Congress. The target was at the lower end of the range expected by analysts, weighing on AUD/USD. However, stronger-than-expected China manufacturing and services activity data last week indicates that the economic reopening is beginning to show in activity data. Given that China is Australia’s biggest export market, any improvement in China’s growth outlook could boost Australia’s growth prospects.

For now, though, the focus is on US Fed Chair Powell’s semi-annual testimony to lawmakers later today and tomorrow. His remarks will be closely watched as financial markets look for further guidance on monetary policy given strong US data in recent weeks. In particular, markets will be watching for cues regarding the Fed’s hiking path, particularly if policymakers are contemplating resorting to aggressive rate hikes. In his previous appearance a month ago, Powell emphasized the ‘disinflation’ theme and stopped short of adopting an aggressive tone following a solid US jobs report. US rate futures are pricing in the Fed’s target rate to peak around 5.48% in September from the current 4.50-4.75%, compared with under 5% at the end of January.

Australia Rates Expectations

Chart, line chart  Description automatically generated

In contrast, Australia’s macro data since the beginning of March have been underwhelming, as reflected in the Economic Surprise Indices (ESI) – the Australian ESI is languishing around the 2020 lows, while its US counterpart is at the highest level in 10 months. The diverging growth outlook has weighed on AUD/USD in recent weeks.

AUD/USD Daily Chart

image3.png

On technical charts, AUD/USD has faced stiff resistance at last week’s high of 0.6780, roughly coinciding with the 89-period moving average and the upper edge of the Ichimoku cloud on the 240-minute charts. Since the decline began in February, AUD/USD hasn’t been able to cross the 89-PMA and the upper edge of the Ichimoku cloud, so a break above would raise the odds that the pair has found an interim floor. Such a break could pave the way toward the late-February high of 0.6920.

On the downside, AUD/USD has quite a strong cushion at the late-November low of 0.6585 – the pair needs to hold above the support for the four-month-long uptrend to remain intact.


Gold Prices Eyeing Bearish Death Cross as Traders Await Jerome Powell

Gold Prices Eyeing Bearish Death Cross as Traders Await Jerome Powell

Gold prices aimed cautiously lower on Monday. The anti-fiat yellow metal inversely tracked Treasury yields. The 2-year government bond rate rallied by 0.6%. XAU/USD can be quite sensitive to Treasuries, which are partly a reflection of monetary policy expectations. This is due to gold’s inherent lack of yield when holding the precious metal. When the return on cash rises, XAU tends to fall and vice versa.

Financial markets are eagerly awaiting testimony from Federal Reserve Chair Jerome Powell before the Senate and House committees, which starts later today. Traders will be tuning in to see if he has more specifics about just how restrictive monetary policy will be in the near term. In recent weeks, markets increased rate hike expectations, bringing the anticipated rate to 5.5% by year-end.

Recent inflation data (both CPI and the Fed’s preferred PCE gauge) surprised higher, hinting at stickier price pressures. That may require a tighter central bank for longer. Such an outcome would likely not bode well for gold. During the early Tuesday Asia trading session, gold was attempting to push higher. But, follow-through might have to wait until we are past the first round of testimony from Jerome Powell.

XAU/USD Daily Chart

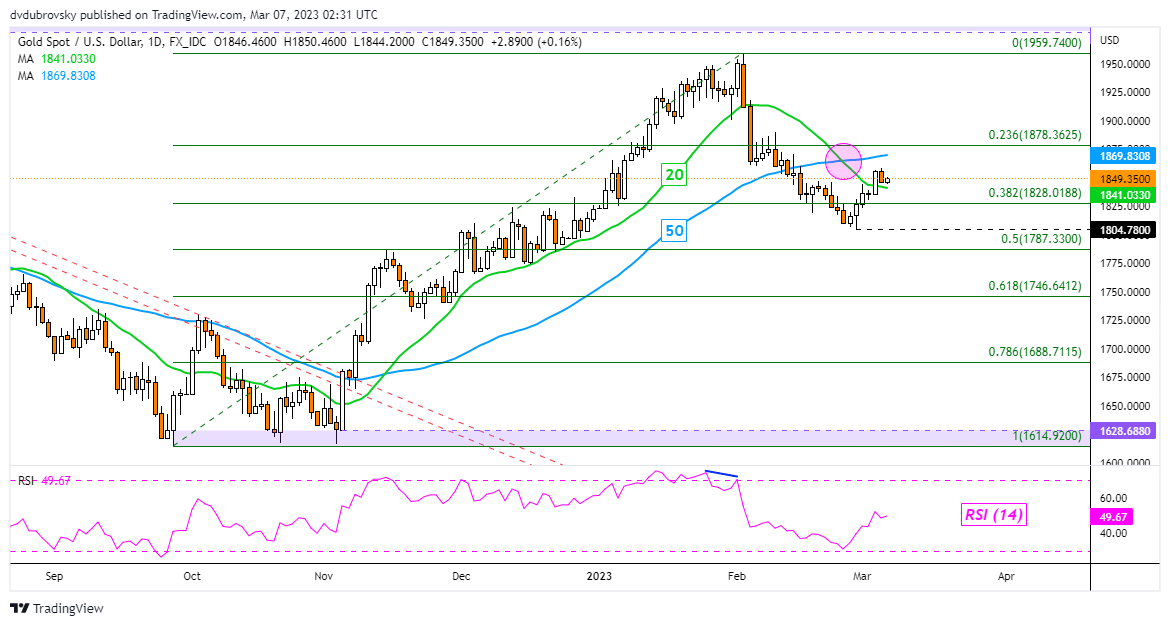
Looking at the daily chart, gold remains above the 20-day Simple Moving Average, but below the 50-day line. In recent days, a bearish Death Cross emerged between these two lines, offering an increasingly downside technical bias. Dropping back under the 20-day SMA exposes the 38.2% Fibonacci retracement level at 1828 before placing the focus on the February low at 1804.78. Immediate resistance is the 23.6% level at 1878.36.

XAU/USD Daily Chart

Hang Seng Index Price Setup: Are We There Yet?

Hang Seng Index Price Setup: Are We There Yet?

HANG SENG INDEX SHORT-TERM TECHNICAL OUTLOOK – NEUTRAL

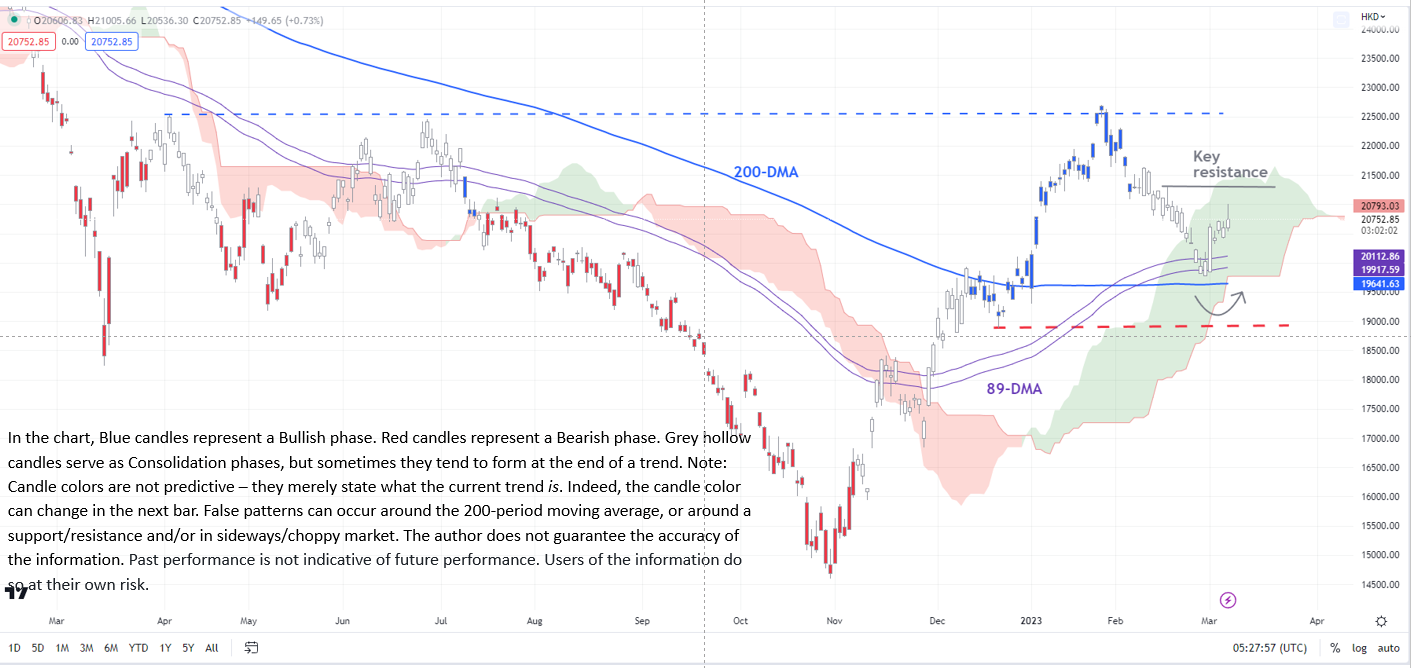
The downward correction that started in the Hang Seng Index (HSI) doesn’t appear to be over just yet. However, within the broader context, the weakness since the end of January appears to be consolidation within an uptrend.

The HSI index appears to have found a temporary floor around the 89-day moving average, near the 200-day moving average, not too far from the lower edge of the Ichimoku cloud on the daily charts. However, the index needs to crack an immediate ceiling at the mid-February high of 21300 for the imminent downside risks to fade. Speaking of the broader trend, the color-coded candlestick charts, based on trending/momentum indicators, suggest the index remains in a consolidation phase (see the daily chart).

Hang Seng Index Daily Chart

image1.png

Hong Kong/Chinese equities have rebounded since the start of the month after data showed activity in China’s manufacturing sector expanded at the fastest pace in more than a decade, while the services sector expanded at the fastest pace in six months in February as the dismantling of strict COVID-19 restrictions revived consumer demand.

Meanwhile, China on Sunday set a growth target of around 5%, below last year’s target of around 5.5% at the annual session of its National People’s Congress. The target was at the lower end of the range expected by analysts, disappointing some after the economy gave one of the weakest performances in decades last year. The reaction in equity markets was muted on the hopes that the economic reopening is beginning to show in activity/real data that could lead to a re-rating higher of China’s economic growth expectations.

Hang Seng Index 240-minute Chart

image2.png

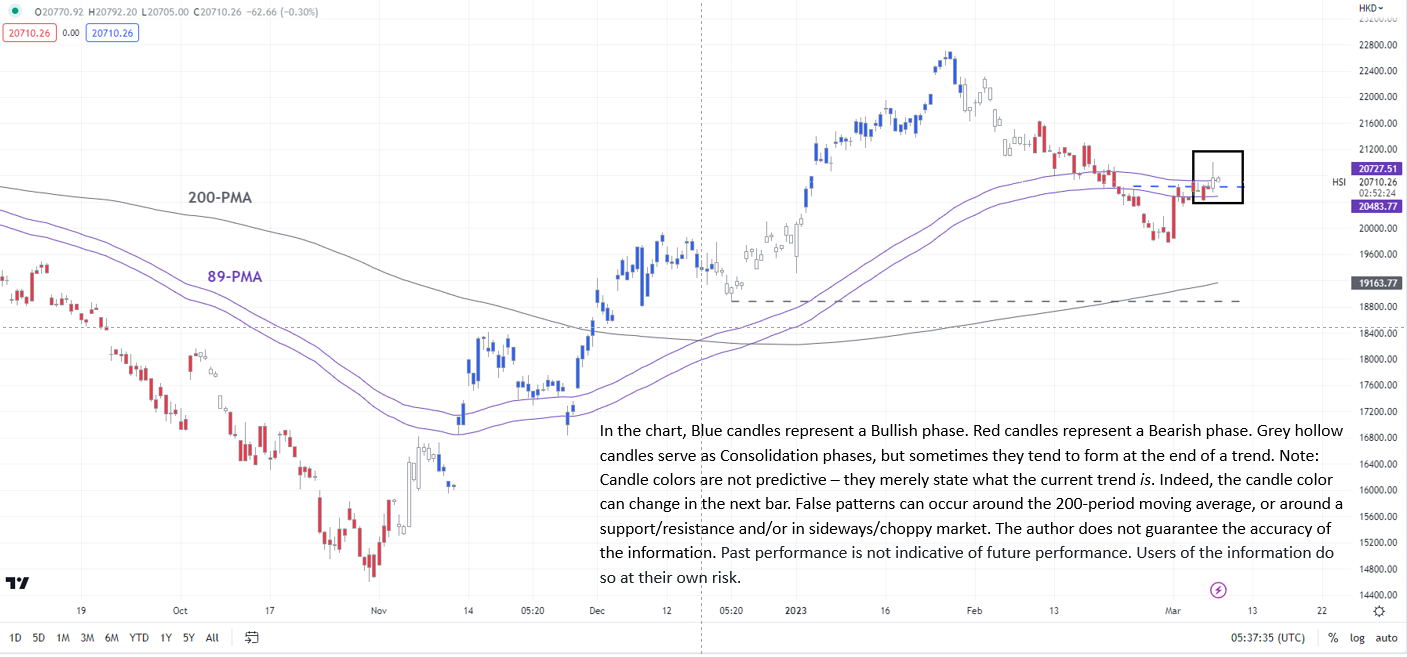
However, the initial optimism is yet to manifest on technical charts. As the 240-minute color-coded candlestick chart shows that even after the rebound from last week, the index is not yet out of the bearish phase (see the 240-minute chart). Still, the index would need to break below the late-December low of 18885 for the four-month-long upward pressure to reverse.

Gold Prices Hold Steady Ahead of Fed Chair Powell and the Latest US Jobs Report

Gold Prices Hold Steady Ahead of Fed Chair Powell and the Latest US Jobs Report

For all market-moving events and data releases, see the real-time DailyFX Calendar

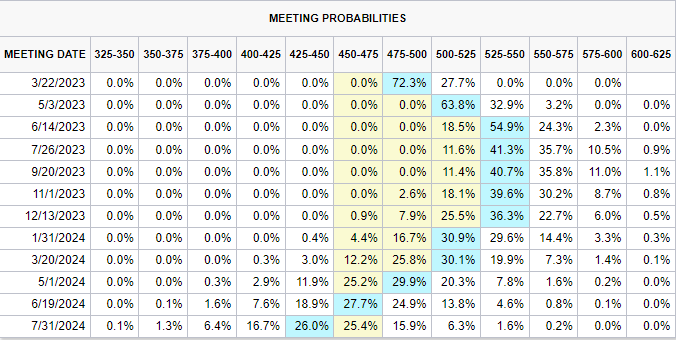
Federal Reserve chairman Jerome Powell will be up before the US Senate on Tuesday and Wednesday this week, and market participants will be closely following his testimony for further clues about how the central bank thinks the fight against inflation is going. The current market thinking, and pricing, is that interest rates are going to hit 525-550 bps by the end of Q2, up three-quarters of a percentage point from the current target rate of 450-475bps. Any deviation from this expected path of rate hikes will add volatility to the US dollar.

image1.png

The end of the week sees the release of the latest US Jobs Report (NFPs), a high-importance market event. Last month’s report saw a sizeable increase in jobs created, 517k compared to forecasts of 185k and a prior month’s 260k, bringing the US unemployment rate down to 3.4%, the lowest level since May 1969. Annual revisions to the survey data are seen behind last month’s sharp move so this week’s report will be closely watched to see if the data reverts back to trend. Current market expectations are for 200k new jobs and an unchanged unemployment rate.

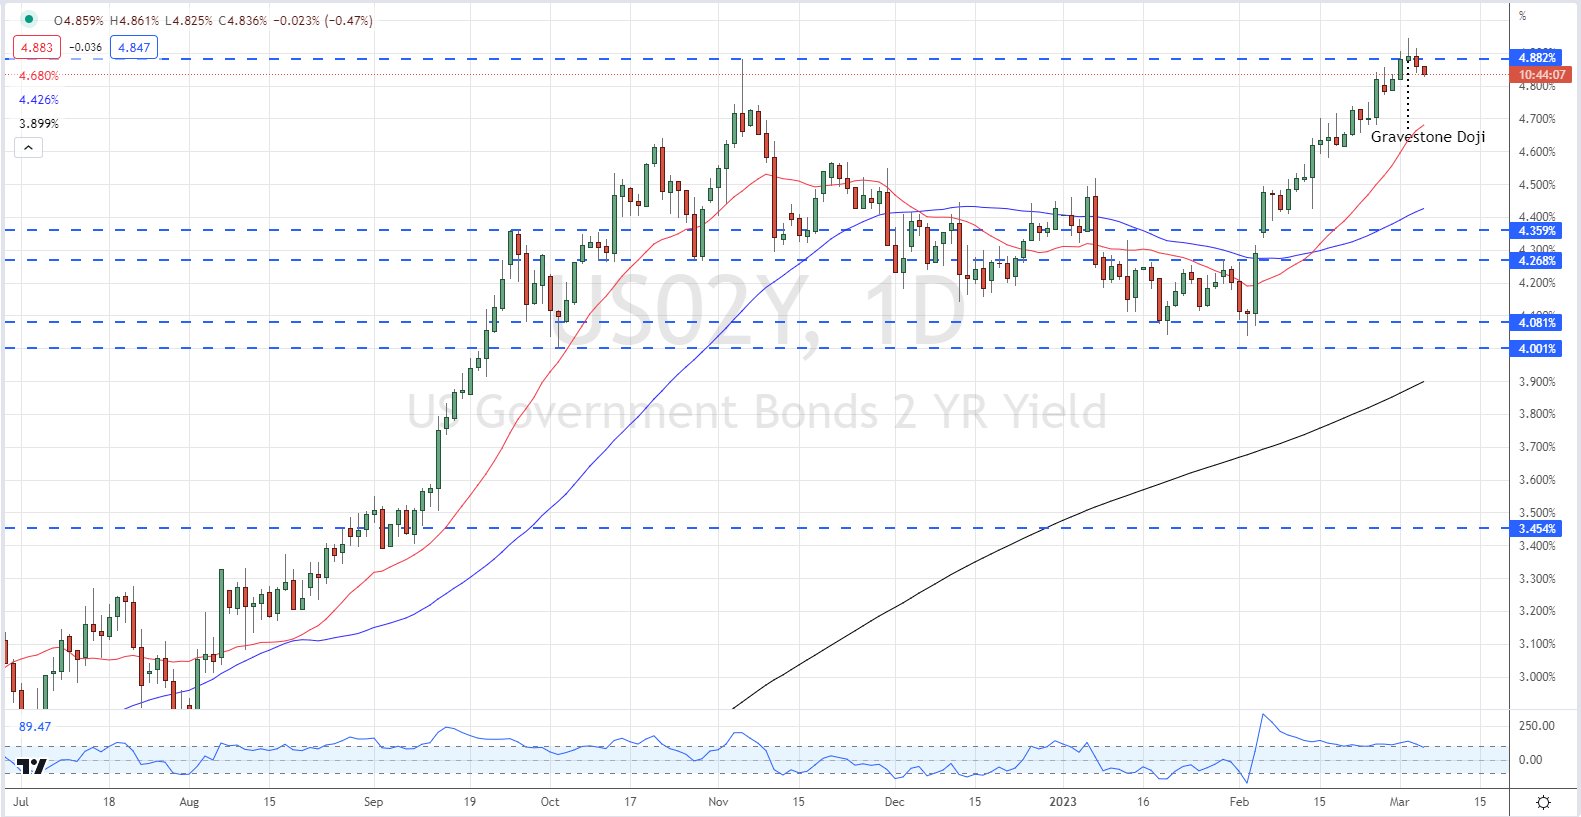
The recent move higher in US Treasury yields has halted in the last few days, allowing gold to move higher. The interest-rate sensitive UST 2-year is now trading with a yield of 4.83%, down from a near 16-year high of 4.95% made last week. One technical signal, a gravestone doji on the daily chart, suggests that short-dated US Treasury yields may fall further.

US Treasury 2-Year Yield

image2.png


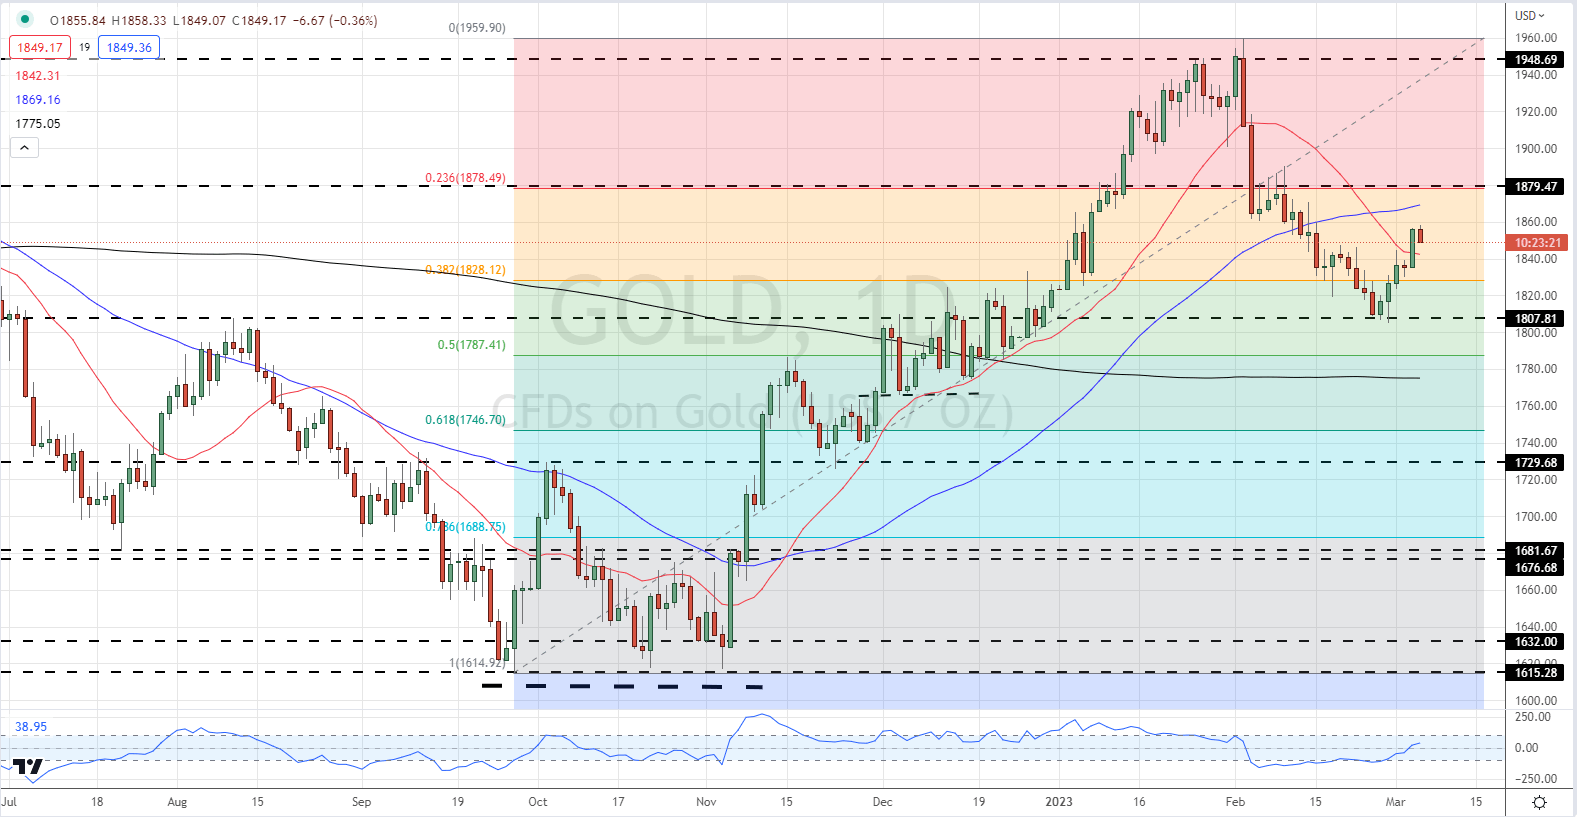
Gold is currently trading on either side of $1,850/oz, in the middle of two Fibonacci retracement levels at $1,828/oz. (38.2%) and $1,878/oz. (23.6%). As discussed earlier, lower US Treasury yields have given gold the room to press higher over the last week and the future path of US rates will decide gold’s next move.

Gold Price Daily Chart – March 6, 2023

image3.png


EUR/USD Unchanged as Euro Area Retail Sales Tick Higher but Miss Estimates

EUR/USD Unchanged as Euro Area Retail Sales Tick Higher but Miss Estimates

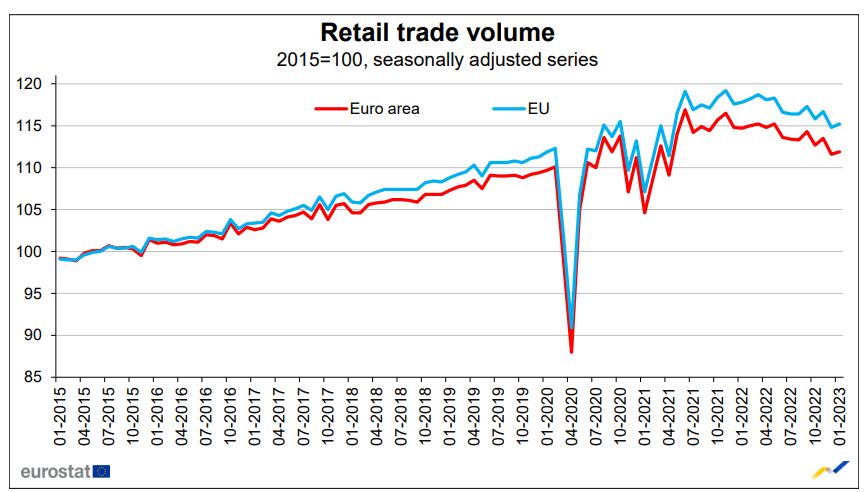
Euro Area retail sales decreased by 2.3 percent from a year earlier in January 2023 coming in worse than estimates of a 1.8% fall. The MoM figure reflected an increase 0.3 percent from a month earlier following a downwardly revised 1.7 percent drop in December and missing market expectations of 1.0 percent growth.

image1.png

Customize and filter live economic data via our DailyFX economic calendar

In the Euro Area in January 2023, compared with December 2022, the volume of retail trade increased by 1.8% for food, drinks and tobacco and by 0.8% for non-food products, while it decreased by 1.5% for automotive fuels. In the EU, the volume of retail trade increased by 1.8% for food, drinks and tobacco and by 1.1% for non-food products, while it decreased by 2.1% for automotive fuels according to Eurostat data.

image2.png

EURO AREA AND ECB POLICY MOVING FORWARD

The ECB has largely continued its hawkish rhetoric of late with the majority of policymakers adamant a 50bps hike at the upcoming meeting remains a necessity. Given last week’s core inflation data as well as comments over the weekend by ECB Presidents Lagarde, who stated that she sees further increases in the core inflation rate over the short term.

The Euro Area has continued to display resilience with today’s S&P Global Eurozone Construction PMI continuing the trend, rising to 47.6 for the month of February 2023 compared to 46.1 in January. Although the print remains in contractionary territory home building activities contracted at its slowest pace in 7 months while commercial building activity was down for the eleventh straight month, with the pace of reduction little-changed from that seen in January. New business received by construction firms declined the least since last June and employment levels rose for the first time in 11 months while input cost inflation did soften with its best print since December 2020.

Today’s Retail Sales data does indicate a slightly weaker start to the year than expected, however looking ahead there are a few positives, notably that the Euro Area has managed to avoid a recession thus far while wages are showing signs of improvement. Business Confidence hit an eight-month high, suggesting a weaker degree of pessimism, yet signs of a potential rebound are yet to fully materialize.

MARKET REACTION

EURUSD

image3.png

Initial reaction was relatively subdued with EURUSD remaining relatively unchanged as the Euro continues to find support from hawkish central bank rhetoric. The floor at 1.0500 continues to hold while immediate resistance rests at the 1.0700 handle with a break and daily candle close needed above if we are to see further upside. Given the current fundamentals in play there is every chance we remain rangebound at least until Fed Chair Powell begins his testimony tomorrow.

Japanese Yen Firms Ahead of Powell and BoJ as US Dollar Pauses. Where to for USD/JPY?

Japanese Yen Firms Ahead of Powell and BoJ as US Dollar Pauses. Where to for USD/JPY?

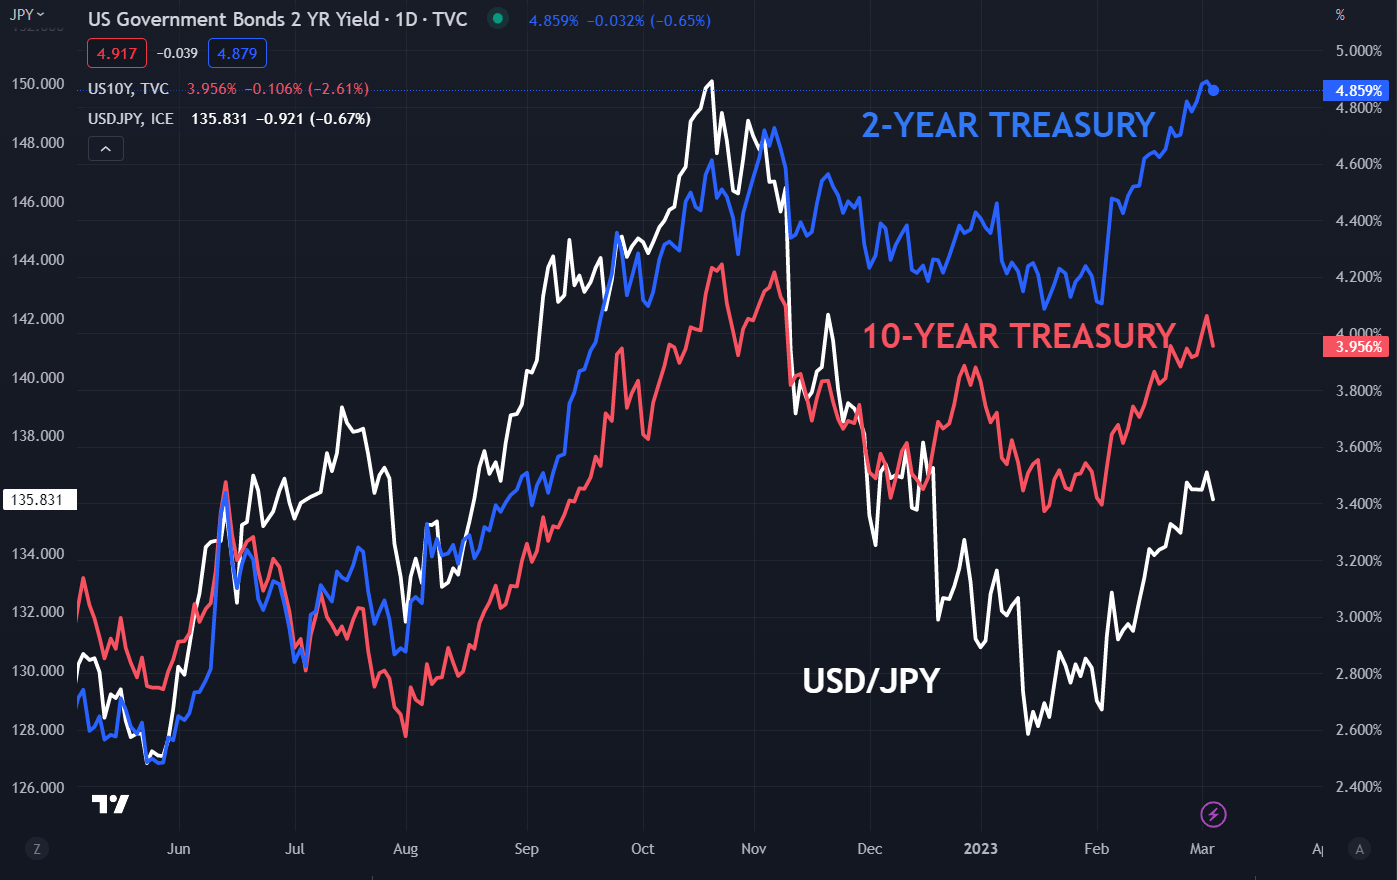
The Japanese Yen has found some strength from easing Treasury yields, and they might be the key for USD/JPY in the week ahead.

Crucially, Federal Reserve Bank Chair Jerome Powell will be testifying in front of the Senate Banking Committee when he delivers his semi-annual Monetary Policy Report on Tuesday and Wednesday, US time.

His comments will go under the microscope for clues on his thinking for the Fed funds target rate going forward.

Any hint that the bank is backing away from its hawkish stance might kick-start markets and may see a further easing of Treasury yields. Of course, if the tightening path is maintained and potentially further emphasised, it could see yields lift.

The futures and swaps markets are pricing in at least a 25 basis point tightening at the March, May and June Federal Open Market Committee (FOMC) meetings.

Also ahead this week, the Bank of Japan’s (BoJ) monetary policy decision will be made on Friday although the market is not expecting any changes there.

The BoJ has a policy rate of -0.10% and is maintaining yield curve control (YCC) by targeting a band of +/- 0.50% around zero for Japanese Government Bonds (JGBs) out to 10 years. The 10-year JGB is persistently trading near the upper bound of 0.50%.

The incoming Governor of the Bank of Japan (BoJ) Kazuo Ueda made it clear last week that he will be maintaining the same stance as outgoing Governor Haruhiko Kuroda.

At least for now, that is. There is growing speculation that the policy could be adjusted in the second or third quarter in a similar move as last December when the YCC band was widened from +/- 0.25% to +/- 0.50%

So, with the BoJ’s policy on hold, the Fed’s active stance might remain the driver for USD/JPY for now.

Besides Powell’s testimony and the BoJ meeting, US jobs data and Japanese GDP figures are due out this week and could trigger market volatility.

USD/JPY AGAINST 2- AND 10-YEAR TREASURY YIELDS

image1.png


AUD Price Analysis: Aussie Dollar Hampered by Chinese GDP Expectations

AUD Price Analysis: Aussie Dollar Hampered by Chinese GDP Expectations

AUSTRALIAN DOLLAR FUNDAMENTAL BACKDROP

The Australian dollar gave up some of its gains this Monday morning after China’s National People’s Congress (NPC) delivered a more conservative outlook for 2023 GDP. Forecasts now point to 5% as opposed to the anticipated 5.5-6% range which may be disappointing for commodity export heavy nations like Australia but the lower base could allow for the greater chance of an upside surprise.

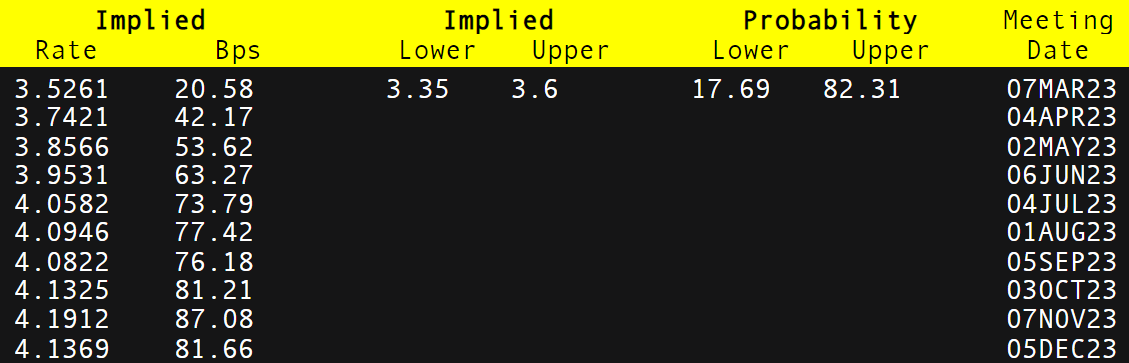
Looking ahead, the Reserve Bank of Australia (RBA) will be in focus tomorrow morning (see economic calendar below) with their interest rate decision. Consensus is for another 25bps increment which will be the 10th consecutive rate hike by the central bank. This could see the Aussie dollar find some support against the U.S. dollar ahead of Fed Chair Jerome Powell’s testimony later in the day. Mr. Powell will be under the spotlight as market participants look to uncover any possible clues as to the Fed’s March meeting and whether there is a chance of a reversion to 50bps or not as money market pricing currently exhibits indecision at roughly 30bps.

RBA INTEREST RATE PROBABILITIES

image1.png

ECONOMIC CALENDAR

image2.png

TECHNICAL ANALYSIS

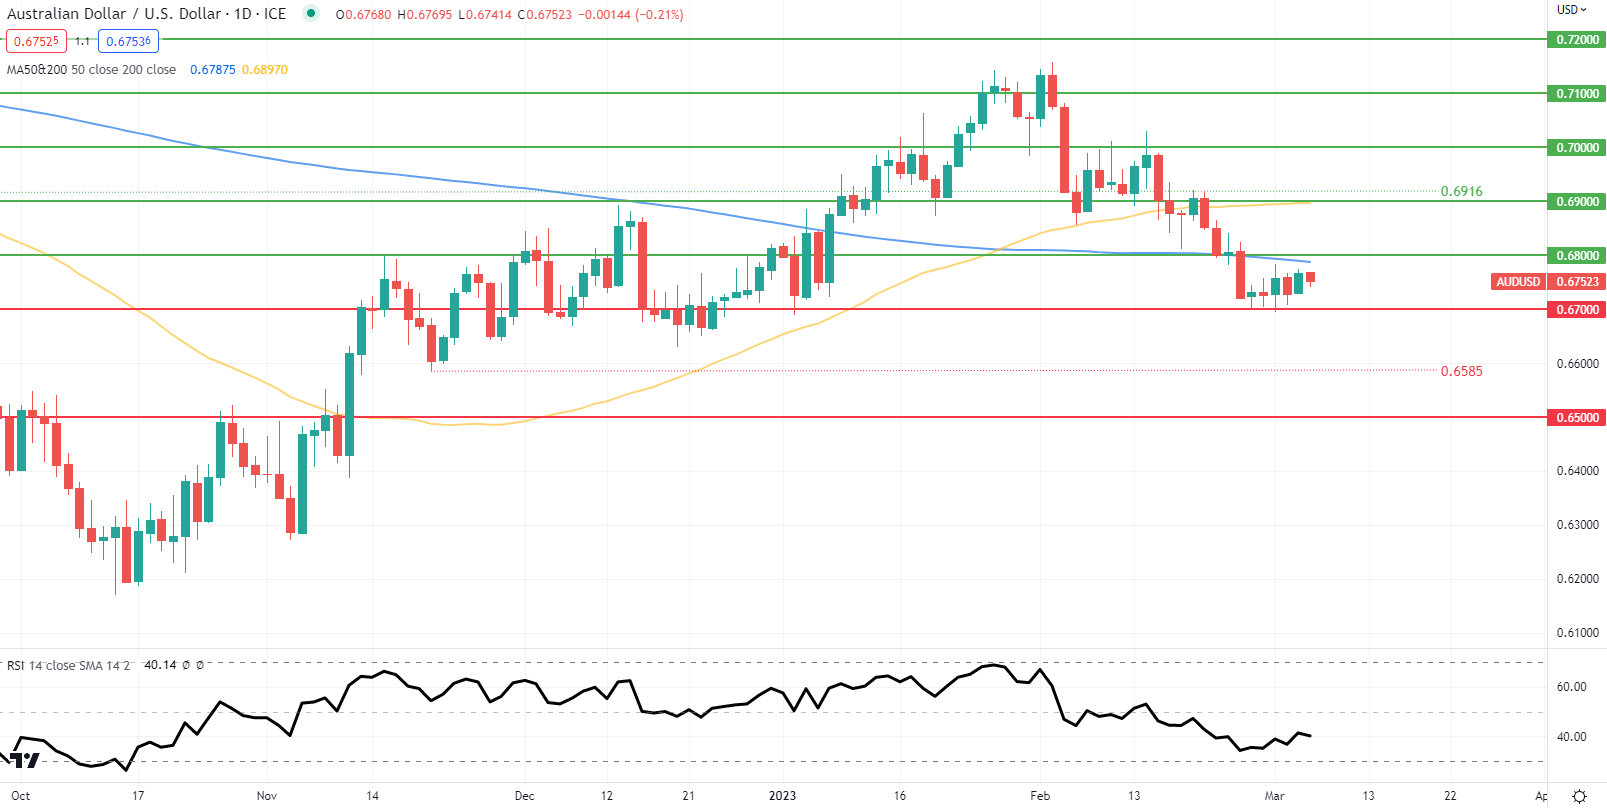
AUD/USD DAILY CHART

image3.png

Chart prepared by Warren Venketas, IG

Daily AUD/USD price action remains below the 200-day SMA (blue) resistance zone but tomorrow’s fundamental data could see a re-test. A candle close above may point to some short-term bullish backing from a technical analysis standpoint; however, a breach below the 0.6700 psychological support handle could open up further room for bears to extend the downside rally. Although the Relative Strength Index (RSI) is below the 50 level, there is still capacity to push further into oversold territory. Today’s price action should be quite subdued with no high impact data expected likely remaining between the 0.6700 – 0.6800 range.

Key resistance levels:

  • 0.6900/50-day SMA
  • 0.6800
  • 200-day SMA

Key support levels:

  • 0.6700
  • 0.6585

IG CLIENT SENTIMENT DATA: MIXED

IGCS shows retail traders are currently LONG on AUD/USD, with 70% of traders currently holding long positions. At DailyFX we typically take a contrarian view to crowd sentiment but due to recent changes in long and short positioning we arrive at a short-term cautious bias.

Gold Looks to Powell for a Confirmation

Gold Looks to Powell for a Confirmation

Precious metals appear to be holding their last week’s gains on easing US Treasury yields following Atlanta Federal Reserve President Raphael Bostic’s “slow and steady” remarks on Friday. For an extension of the rebound, gold is probably looking for an additional catalyst.

Fed Chair Powell is due to deliver his semi-annual testimony to lawmakers tomorrow and Wednesday. His remarks will be closely watched as financial markets look to reaffirm the recent repricing higher of Fed rate expectations. In his previous appearance a month ago, Powell emphasized the ‘disinflation’ theme and stopped short of adopting an aggressive tone following a blistering US jobs report. A similar undertone could boost XAU/USD. US rate futures are pricing in the Fed’s target rate to peak around 5.44% in September from the current 4.50-4.75%, compared with under 5% at the end of January.

XAU/USD 240-minute Chart

image1.png

Meanwhile, US payroll growth, due Friday, grew 215000 in February, slower from 443000 in January, while unemployment is expected to hold near the five-decade low of 3.5%. US data has been broadly better than expected since the start of the month, as reflected in the Economic Surprise Index which is around its highest level since April.

XAU/USD Daily Chart

image2.png

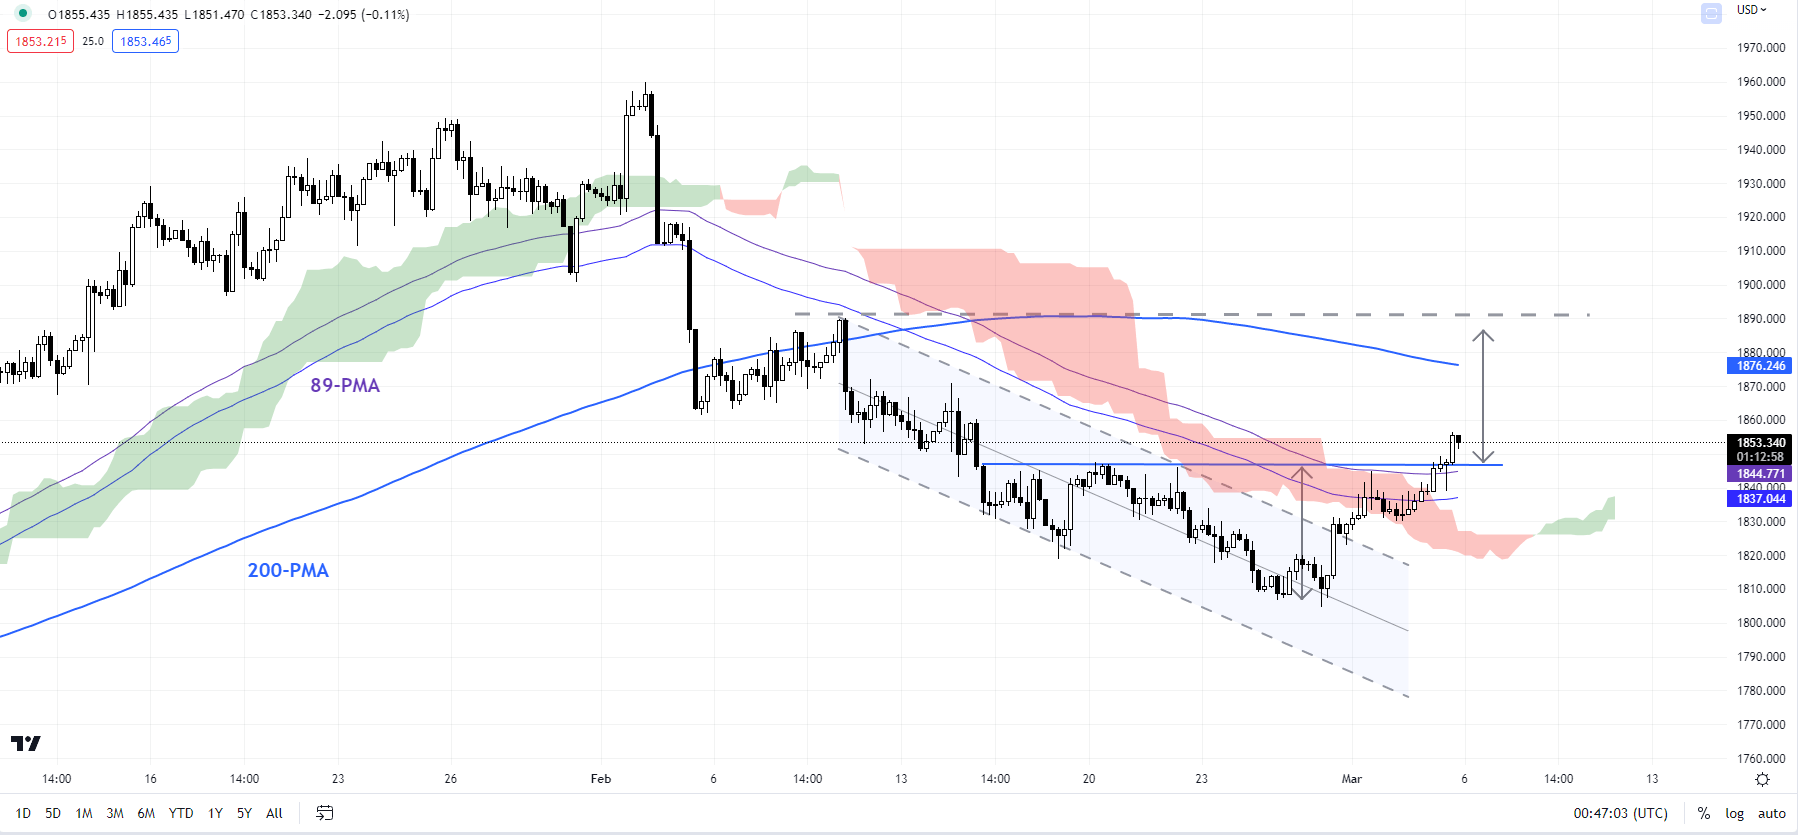
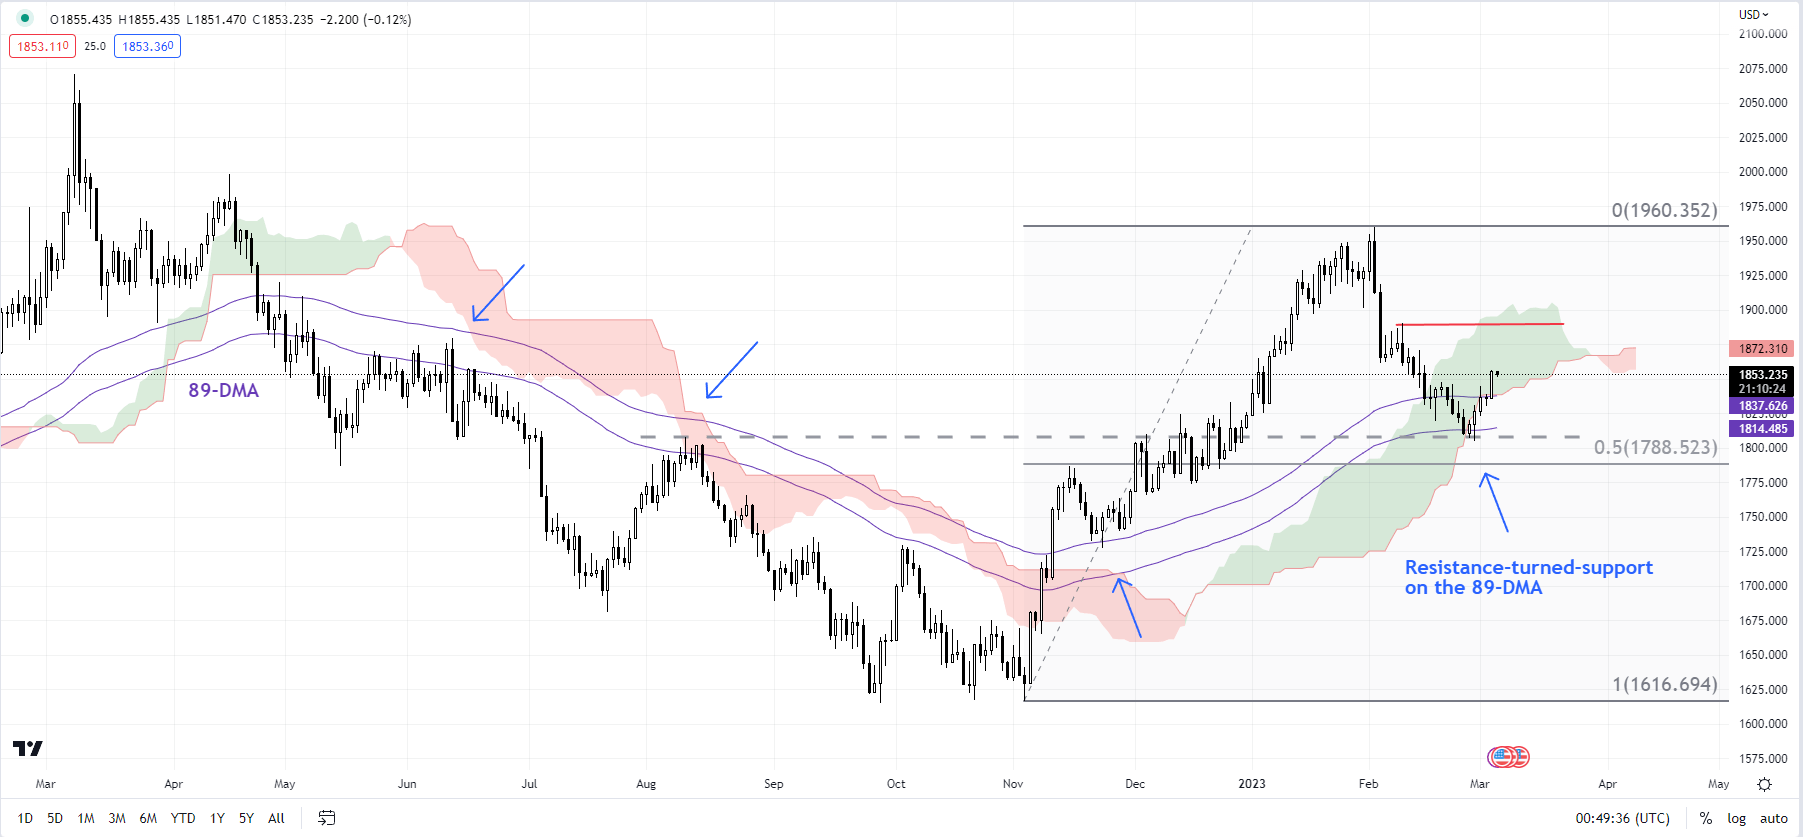
On technical charts, gold is showing tentative signs of setting up an interim low – see “Gold Technical Outlook: A Turnaround on the Cards?”, published March 1. The yellow metal has held a fairly strong converged support area of 1775-1810: the August high of 1807, the lower edge of the Ichimoku cloud support, the 200-day moving average, and the resistance-turned-support on the 89-day moving average (see the daily chart).

Zooming on to shorter timeframes, gold is attempting to break above a vital ceiling on a horizontal trendline from late February at about 1847. Such a break could pave the way toward the 200-period moving average on the 240-minute chart (now at about 1876). However, for the month-long downward pressure to reverse, XAU/USD would need to break above the Feb

Hoping For an Early Fed Pivot Does Not Mean We Will Get One

Hoping For an Early Fed Pivot Does Not Mean We Will Get One

Every economic age has its dominant phrase. Think of the ‘irrational exuberance’ which then-Federal Reserve Chair Alan Greenspan fretted about during the 1990’s dot-com bubble. If that’s too far back for you, what about European Central Bank chief Mario Draghi in 2012 promising skeptical markets that he’d do ‘whatever it takes’ to save the Euro?

The buzzword of this inflation-ravaged era is more succinct. In fact, it’s just one word – ‘pivot.’

For our purposes it means the point at which the United States Federal Reserve will feel it can stop raising interest rates and begin to offer the possibility that they could start to go down.
image1.png

It’s easy to see why that word dominates. 2022 brought, among other dark things, interest rate rises unprecedented in the working lives of many people now engaged with financial markets. The US central bank has hit the monetary brakes no fewer than seven times, pushing the benchmark rate up to a target range of 4.25-4.5%. That’s the highest rate in fifteen years. Moreover, while there are clear rhetorical signs that the Fed is now more cautious about raising rates than it was back in the summer, there are equally clear signals that borrowing costs will go higher yet and that it may not top out below 5%.

Given that the Fed Funds rate spent much of the time between 2009 and 2021 barely above zero, the scale of the turnaround has been astonishing.

And given that so many market participants cut their teeth in a long era of docile inflation, cheap money and ever-flowing credit, it’s no wonder that so many should be keen that the Fed does indeed pivot as soon as possible. The thing about Golden Ages is that people always want them back.

But that doesn’t mean they come back. Of course, the key to whether or not the Fed will, in fact, pivot, will be found in the inflation data. And the picture there is still very unclear.

Boosted by a number of factors, from the war in Ukraine through to Covid’s supply-chain havoc and a general rethink of the previously dominant trend toward ever-more globalization, prices surged in 2022 by measures not seen for fully 40 years. The US was not alone in facing this gale, of course. Other countries did so too, and some had it a lot worse. Inflation has run hotter in Europe thanks among other factors to its energy dependence on Russia.

Even Japan has seen a resurgence of pricing power, where inflation has been thought dead for decades.
image2.png

But the US still runs the table, and it’s the success of the US response which will matter most. And there are some encouraging signs. The Fed’s preferred measure of inflation continued to slacken in November, providing another indicator that price pressures may indeed have peaked earlier in the year.

The Personal Consumption Expenditures price index, or PCE, rose 5.5% on the year, well below the 6.1% rise seen just a month earlier. The core measure, which cuts out the volatile effects of food and energy costs, was up by a more reassuring 4.7% annualized. Both readings were at their lowest since October 2021.

The release chimes with official Consumer Price Index data for the same month, which showed a similar slackening.

Nevertheless, price rises there still stand at 7.1%, which is a very long way indeed from the 2% rate targeted by the Fed. Moreover, the US central bank’s mandate is to promote stable prices and maximum employment. There may not be many active in the markets today who remember the inflationary pressures of the 1970s and early 1980s. However, there will be many in the Fed who do remember them, and how hard-won the victory was. The monetarist students at the US central bank will be only too aware that they can’t afford to end the rate rising process until inflation – and as importantly, inflation expectations – have been actually and obviously seen to be crushed.

Hence, we see things like stocks falling despite robust Gross Domestic Product numbers. Investors are seeing everything through the inflation prism, and any sign that the Fed’s action has yet to clearly cool economic activity just has investors ever-more convinced that the pivot is not here yet.

5.5% inflation may be better than 6.1%, but it’s still outrunning the Fed’s target by a huge amount, and there’s simply no way policymakers are going to stop fighting while that’s the case. Chair Jerome Powell and the rest of the Open Market Committee well know that their success in getting inflation down will define their time.

Many commentators think we might get very close to pivot territory by the late spring of next year, but in truth we’d probably have to see a marked moderation in wage momentum and, probably, employment growth. Both have remained surprisingly strong despite the Fed’s actions.

Inflation also has a nasty tendency to get sticky. Faced with rising prices, employees demand higher wages, which only add to cost pressures at a time when there’s usually little option but to pass these on again to consumers. And so on…

The upshot of all this is that it could yet be a very long time before the Fed actually does ‘pivot,’ and any prognosis that such a thing could happen in the early part of 2023 depends on evidence of a pretty rapid economic slowdown coming soon. If the economic data don’t start to support this thesis unambiguously in the early months of the year, then the waiting for the pivot could prove a much longer game than many in the markets now hope it’ll be.