GBP/USD: A deeper pullback is seen below 1.1900 – UOB

GBP/USD: A deeper pullback is seen below 1.1900 – UOB

GBP/USD could accelerate its downside once 1.1900 is cleared, suggest UOB Group’s Economist Lee Sue Ann and Markets Strategist Quek Ser Leang.

Key Quotes

24-hour view: “We did not expect GBP to drop sharply to 1.1924 yesterday (we were expecting GBP to trade sideways). Downward momentum has improved, albeit not much. GBP could weaken further but a sustained decline below the major support at 1.1900 is unlikely. Resistance is at 1.1975, a breach of 1.2005 would indicate that GBP is not weakening further.”

Next 1-3 weeks: “Our latest narrative was from Tuesday (28 Feb, spot at 1.2065) where we held the view that GBP is likely to consolidate and trade in a broad range of 1.1970 and 1.2150. Yesterday, GBP took out 1.1970 and dropped to a low of 1.1924. Downward momentum is beginning to build. However, GBP has to crack another major support at 1.1900 before a sustained decline is likely. The chance of GBP breaking 1.1900 will remain intact as long as the ‘strong resistance’ (currently at 1.2045) is not breached within the next few days. Looking ahead, the next level to watch below 1.1900 is at the Jan’s low near 1.1840.”

Elliott Wave forecast: USD/JPY is approaching resistance [Video]

Elliott Wave forecast: USD/JPY is approaching resistance [Video]

There were some BOJ comments in Asia regarding inflation but nothing significant. However, they have to plan different scenarios regarding policy, so we clearly should not be shocked if they change their actions after April if inflation will keep rising. I still think that USDJPY will hit resistance, but for now that’s not visible on the charts yet. We see new intraday five-wave cycle in a bullish mode that can be targeting 137.50. However, big level goes back to 138; that goes back to mid December where we see big gap when looking at JPY futures. For more details on this one check our video below in which we also covered other assets.

Chart

Chart

Euro area annual inflation down to 8.5%

Euro area annual inflation down to 8.5%

Euro area annual inflation is expected to be 8.5% in February 2023, down from 8.6% in January according to a flash estimate from Eurostat, the statistical office of the European Union. Looking at the main components of euro area inflation, food, alcohol & tobacco is expected to have the highest annual rate in February (15.0%, compared with 14.1% in January), followed by energy (13.7%, compared with 18.9% in January), non-energy industrial goods (6.8%, compared with 6.7% in January) and services (4.8%, compared with 4.4% in January).

Scholz’s SPD to Start Coalition Negotiations With CDU in Berlin

Scholz’s SPD to Start Coalition Negotiations With CDU in Berlin

German Chancellor Olaf Scholz’s Social Democratic Party decided to begin coalition talks in Berlin with the Christian Democrats following their defeat in last month’s election in the capital, shunning their current alliance with the Greens and Left party.

Mayor Franziska Giffey, whose SPD was well beaten by the CDU in the repeat vote and only narrowly took second place ahead of the Greens, said a coalition with the Christian Democrats potentially offered the best chance of a “new start” with a genuine focus on tackling the city’s problems.

If the negotiations are successful, the CDU’s main candidate Kai Wegner will take over as mayor and Giffey would likely be appointed to run one of Berlin’s ministries.

“I have decided to work toward this even though it means losing the post of mayor,” Giffey told reporters late Wednesday. “But I say very clearly: I am doing this for Berlin. I am doing this for Berlin and I am doing it for the SPD.”

The CDU took 28.2% of the vote in the Feb. 12 election, while the SPD and Greens each got 18.4%. It was the first time the Social Democrats had failed to win in Berlin since 1999 and they finished a mere 53 votes ahead of the Greens.

Giffey was appointed to run the German capital after narrowly winning the regional vote held in September 2021. Due to irregularities including missing voting slips and logistical problems, a repeat was ordered by Berlin’s top court.

German 40 Price Outlook: Bearish Pressure Pushes Dax to Solid Support

German 40 Price Outlook: Bearish Pressure Pushes Dax to Solid Support

DAX Price Index Technical Analysis

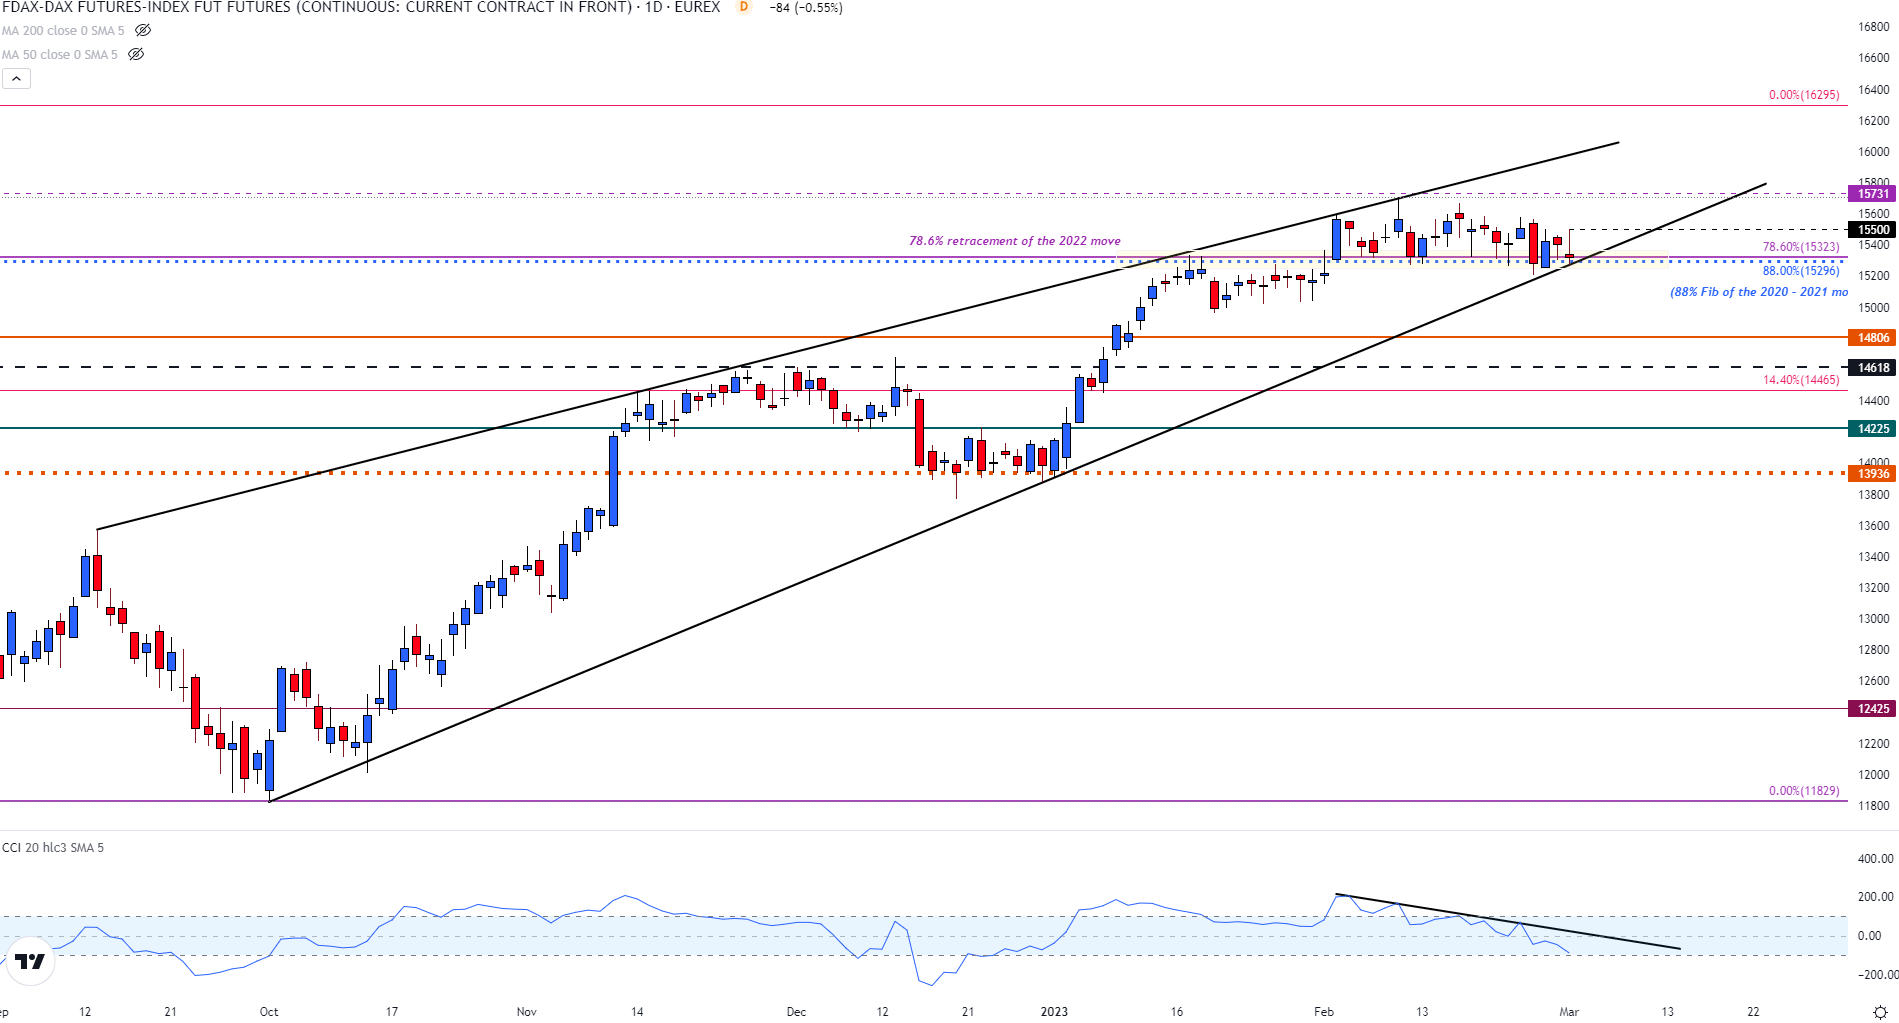
Dax prices have recently been trading sideways, struggling to break in either direction. While prices have maintained strong bullish momentum at the start of the year, key technical levels have come back into play.

The daily chart below illustrates the manner in which the two Fibonacci’s from historical moves has helped provide support and resistance for price action. With a zone of confluency forming between 15296 and 15323, the formation of hanging man candle and a rejection of 15500 could place additional pressure on bulls.

With a rising wedge from the 2022 October low showing a strong rebound that drove Dax prices over 30% over the past four months has run into major resistance at the daily high of 15500.

Dax Price Index (Futures) Daily Chart

Chart  Description automatically generated

Chart prepared by Tammy Da Costa using TradingView

Since the beginning of February, this level has helped limit the bullish move, causing the CCI (commodity channel index) to fall. While prices traded relatively flat, the CCI continued lower, falling toward oversold territory.

If prices fall below 15296 (support), a break below 15200 could fuel a bearish breakout. Meanwhile, with the recent data solidifying a higher probability for additional rate hikes this year, fundamental factors will likely assist in driving the next move.

Japanese Yen Flatlines Despite US Dollar Weakness. Will Treasury Yields Lift USD/JPY?

Japanese Yen Flatlines Despite US Dollar Weakness. Will Treasury Yields Lift USD/JPY?

The Japanese Yen has been steady so far this week in a period where the US Dollar has broadly weakened against most G-10 peers.

The lack of strength in the Yen might be reflecting the perception that the incoming Governor of the Bank of Japan (BoJ) Kazuo Ueda will maintain the ultra-loose monetary policy stance of his predecessor.

The BoJ has a policy rate of -0.10% and is maintaining yield curve control (YCC) by targeting a band of +/- 0.50% around zero for Japanese Government Bonds (JGBs) out to 10 years.

The 10-year JGB is consistently bumping up against the upper bound of 0.50% as the market continually tests the resolve of the bank in the face of rising yields globally.

There is speculation that YCC might be adjusted in the second or third quarter this year, having been loosened in December.

While the BoJ maintains its dovish stance, the Federal Reserve continues to roll out the hawkish message. Overnight it was Atlanta Fed President Raphael Bostic and Minneapolis Fed President Neel Kashkari waving the rate rise flag.

The latter said that he is ‘open-minded’ about a 25 or 50 basis point lift in the Fed funds target rate at the next Federal Open Market Committee (FOMC) meeting in 3 weeks. Both reiterated the need to get inflation under control.

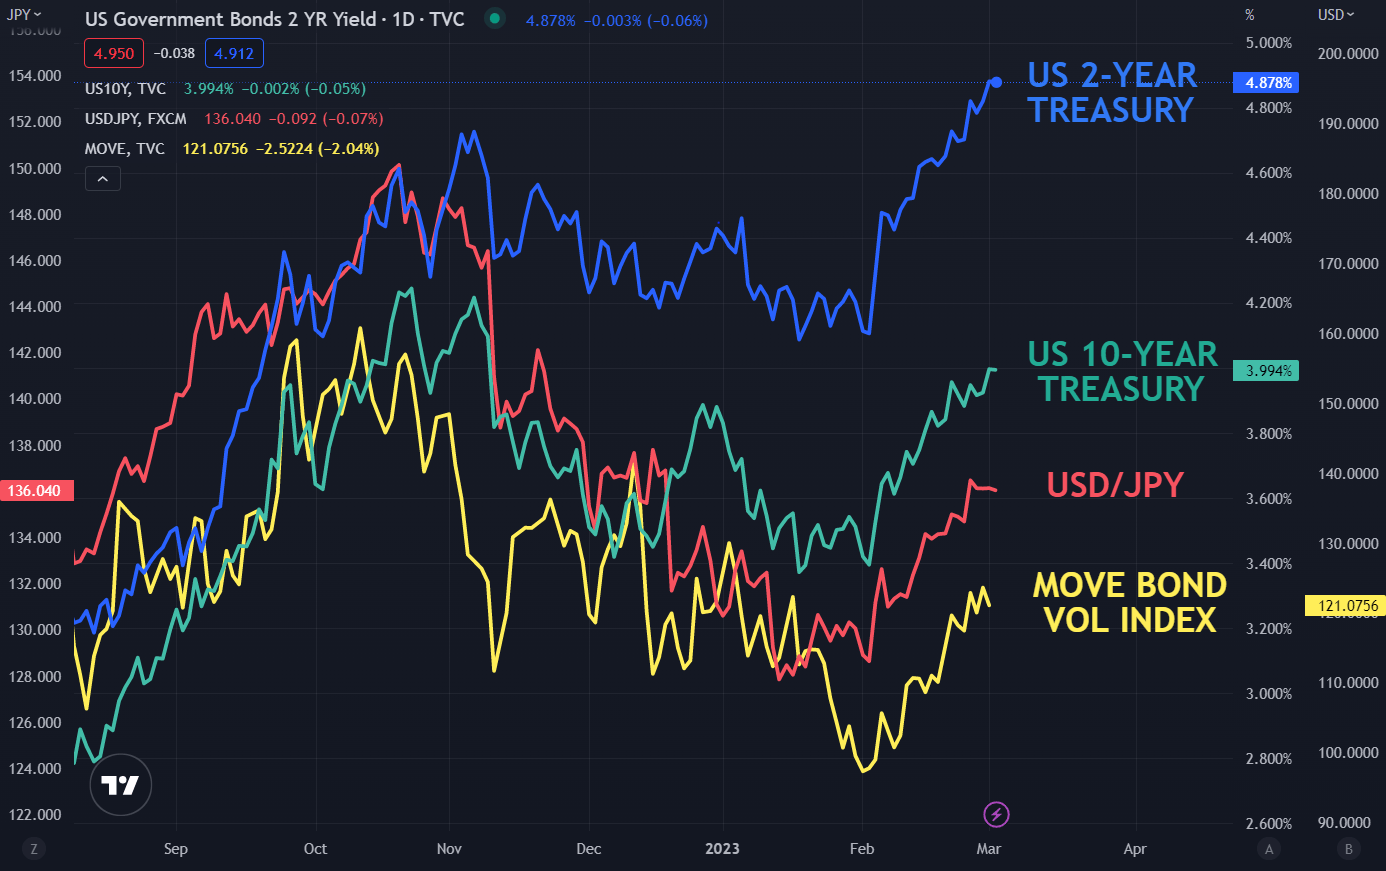
US Treasury yields are marching north again with the 10-year mote eclipsing 4% again overnight while the 2-year bond made a fresh 15-year peak above 4.90%. If the greenback picks up steam again, a bullish USD/JPY trajectory could unfold further.

An interesting evolution in this run-up in US yields has been the relatively benign reaction in volatility. The MOVE index measures Treasury bond market volatility in a similar way that the VIX index measures volatility on the S&P 500.

The last time US yields were up at these levels, the MOVE index was also at a higher level than where it is currently.

This might imply that the market is more comfortable with this increase in interest rates this time around than previously, potentially allowing rates to stay elevated or possibly go higher still.

If the correlation between USD/JPY and Treasury yields holds, USD/JPY could be underpinned for now.

USD/JPY, MOVE INDEX, US 2- and 10-YEAR TREASURY YIELDS

image1.png


US Dollar Price Action Setups: EUR/USD, GBP/USD, AUD/USD

US Dollar Price Action Setups: EUR/USD, GBP/USD, AUD/USD

The US dollar is holding firm against its peers on solidifying expectations of an extended US interest rate hiking cycle. US economic data have broadly beaten expectations since the start of February, triggering a re-rating of US Fed rate hike expectations. Rate futures are now pricing in the Fed’s target rate to peak around 5.5% in September from the current 4.50-4.75%, compared with under 5% at the end of January.

US dollar index (DXY index) – Yet to clear vital resistance

Despite the strength of US data recently and the dramatic repricing higher of Fed rate expectations (rate cuts expectations for this year are nearly priced out), the US dollar index hasn’t made any fresh inroads. That is, the DXY index has held crucial support at the June low of 101.30 but hasn’t broken any significant resistance on the daily charts. The index is now testing a vital converged 105.50-106.50 ceiling: the early-January high of 105.65, the 200-day moving average, coinciding with the upper edge of the Ichimoku cloud on the daily charts.

US dollar index (DXY index) Daily Chart
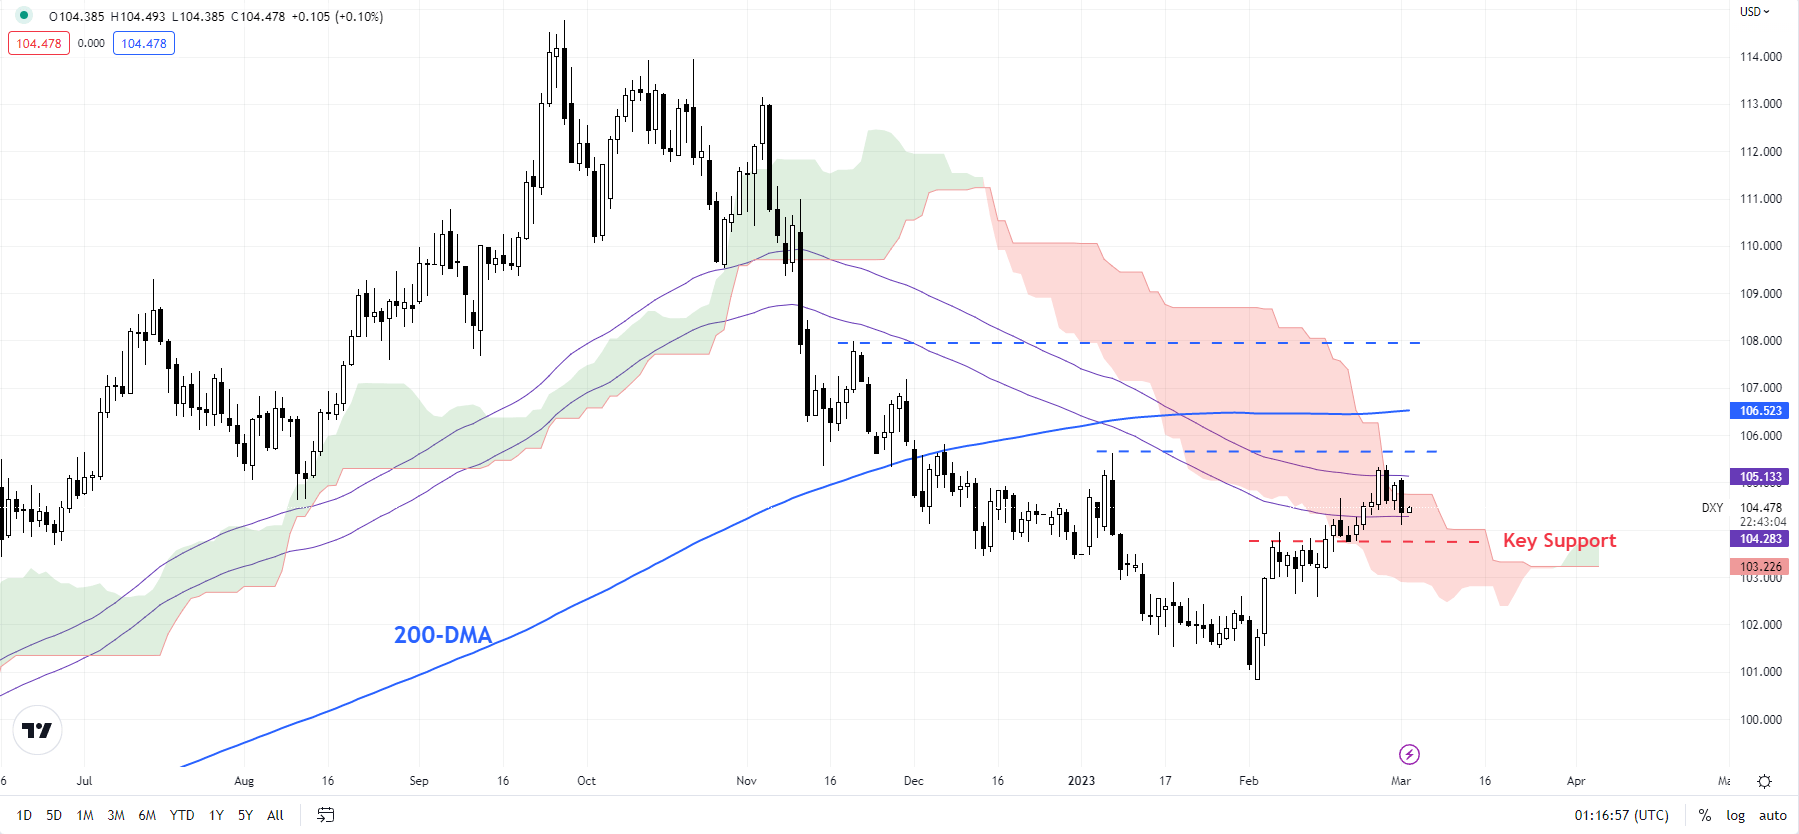
image1.png

Any break above the 105.50-106.50 area would disrupt the lower-bottom-lower-top formation since late 2022, posing a risk to the weak US dollar (USD) outlook. Any break above the late-November high of 108.00 would require a reassessment of the multi-week bearish outlook. On the downside, any break below immediate support on a horizontal trendline from early February at about 103.75 would raise the odds of a resumption of the USD weakness.

EUR/USD – Holding above key support

EUR/USD has been holding a crucial converged floor at the January low of 1.0480, coinciding with the 89-day moving average. The single currency has attempted to rebound this week, but so far hasn’t managed to clear a stiff resistance on a horizontal trendline from early February at about 1.0700. A break above the barrier is needed to raise the chances of an extension of the uptrend. On the downside, any break below the January low of 1.0480 would pose a risk to the five-month-long uptrend, exposing the downside toward the 200-day moving average (now at 1.0330).

EUR/USD Daily Chart
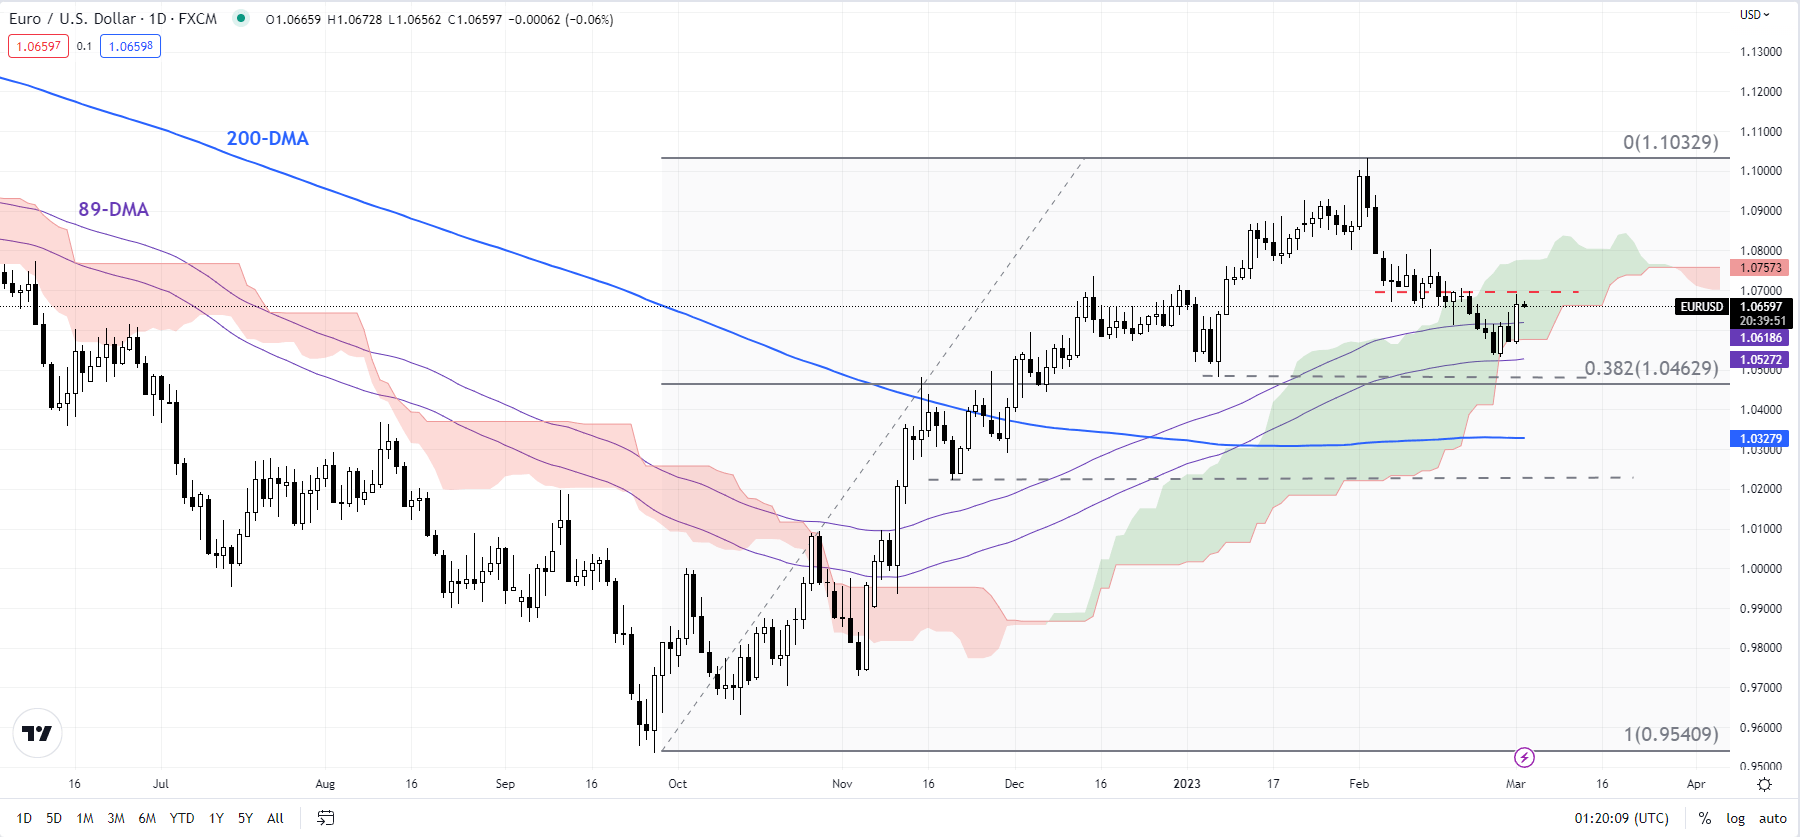
image2.png

GBP/USD – Flirts with 200-day moving average

In recent weeks, GBP/USD has been flirting with a fairly strong converged support of around 1.1840, including the early-January low, the 89-day moving average and the 200-day moving average, and the lower edge of the Ichimoku cloud support. Any break below would trigger a minor double top (the December and January highs), potentially opening the way toward 1.1250. More importantly, such a break would disrupt the higher-top-higher-bottom pattern formed since September, posing a risk to the recovery trajectory since September.

GBP/USD Daily Chart
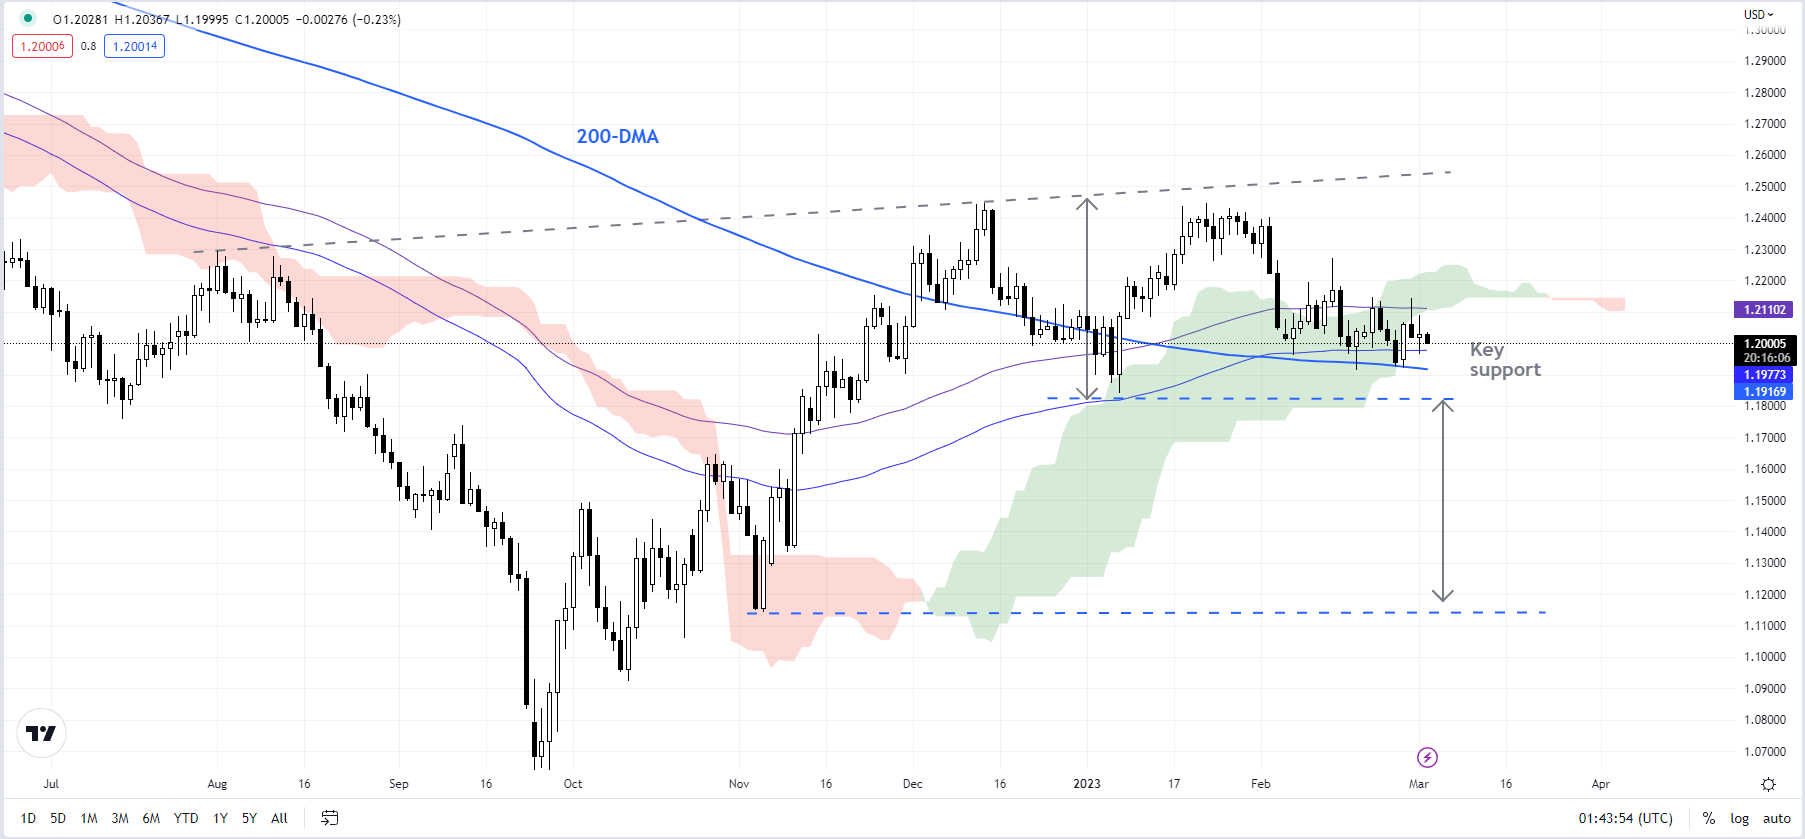
image3.png

AUD/USD – Weighed by the head & shoulders pattern

AUD/USD’s rebound following Wednesday’s China manufacturing data beat appears to be running out of steam as it nears the support-turned-resistance on the 200-day moving average. The lack of follow-through could be partly because the fall in late February below significant support on a horizontal trendline from mid-January at 0.6870 triggered a minor head & shoulders pattern (the left shoulder is the January 18 high, the head is the February 2 high, and the right shoulder is the February 14 high) with a price objective of 0.6580. AUD/USD is now nearing quite a strong cushion at the late-November low of 0.6585 – the pair needs to hold above the support for the four-month-long uptrend to remain intact

AUD/USD Daily Chart
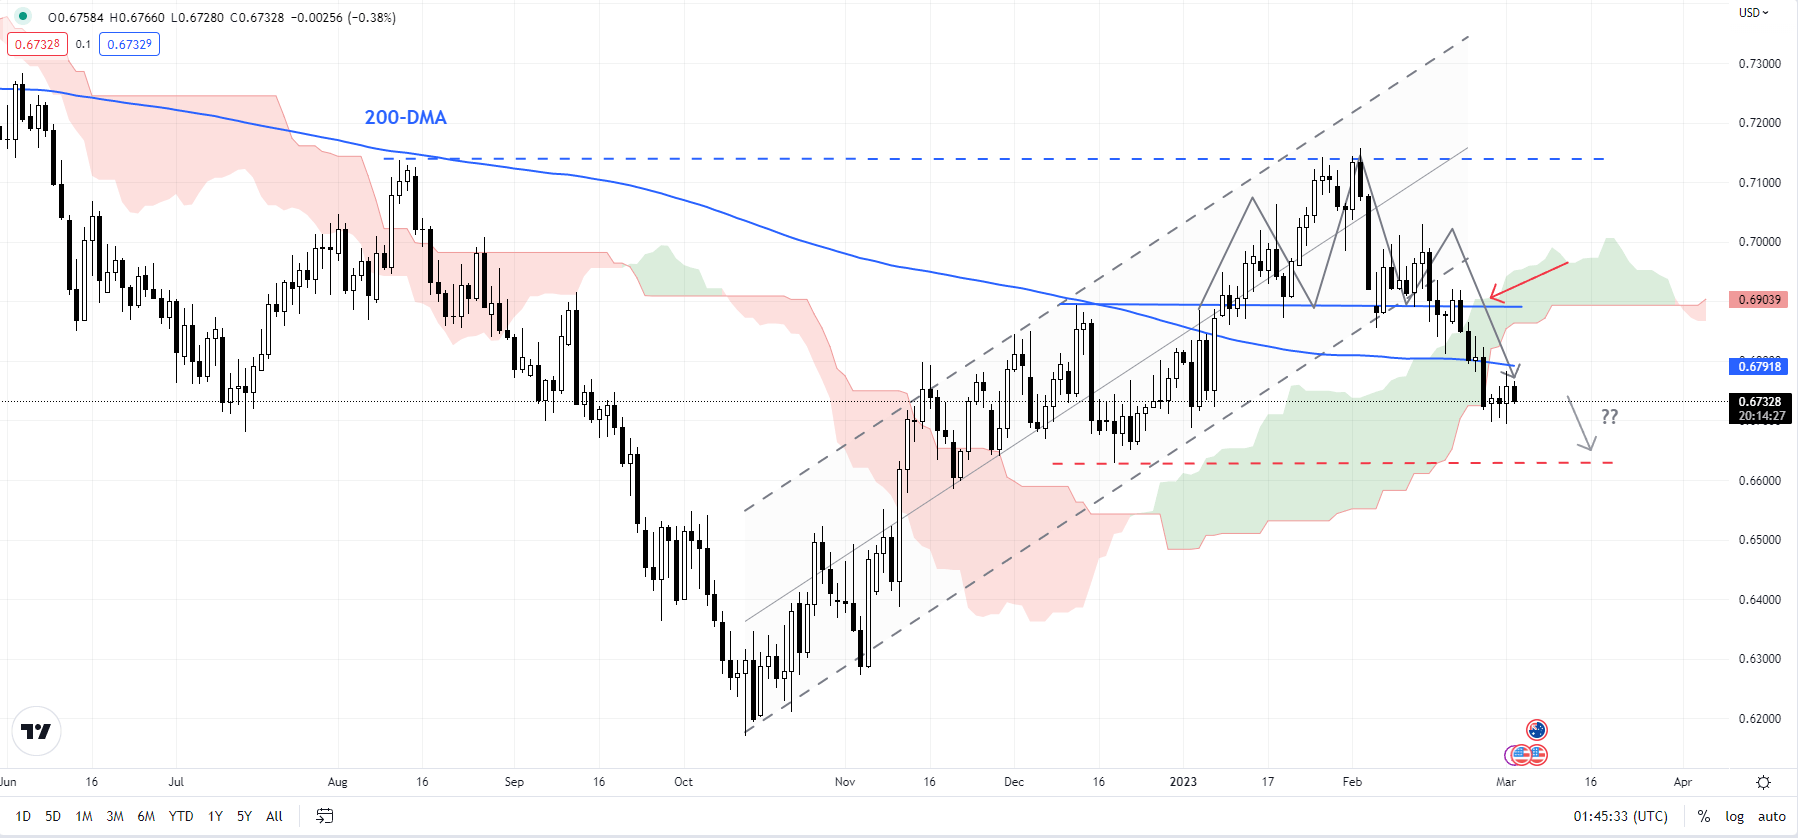
image4.png


GBP Price Forecast: Pound Undeterred by Brexit Deal

GBP Price Forecast: Pound Undeterred by Brexit Deal

GBPUSD FUNDAMENTAL BACKDROP

The British pound is trading lower against the US dollar this Thursday as the greenback finds some support. Last night’s Fed officials (Kashkari and Bostic) maintained a hawkish slant to their guidance reiterating the need to fight inflationary pressures and highlighting a tight labor market alongside a robust US economy that is able to withstand an aggressive monetary policy.

From a UK perspective, the Brexit deal made by Prime Minister and the EU. Trade disputes with Northern Ireland have now been resolved but the most surprising aspect of this deal came from the accommodating reception from some senior pro-Brexit individuals who praised the new concessions. Although this is a positive for the UK economy as a whole, the currency remains dictated by central bank policy. The Brexit deal could bring some short-term relief for the pound against the USD but the more relevant data will stem from the US economy and the Federal Reserve. Recently Bank of England (BoE) Governor Andrew Bailey expressed ambiguous views to allow for flexibility in the coming months without spooking the markets. Later today, both central banks will see statements by their respective speakers (see economic calendar below) while jobless claims data will provide an update on the strong labor market in the US.

ECONOMIC CALENDAR

image1.png

image2.png

Daily GBP/USD price action extends its path within the developing falling wedge chart pattern (black) despite the best efforts of bulls to close atop wedge resistance. Cable is now back below the 1.2000 psychological handle now looking to test the 200-day SMA (blue). An upside break could be seen via weak US economic data that could detract from the hawkish monetary policy stance which remains to be seen.

Key resistance levels:

  • 1.2100
  • Wedge resistance
  • 1.2000

Key support levels:

  • 200-day SMA
  • 1.1900
  • Wedge support