GBP/USD Wilts Toward Key Retracement As Rate Prospects Support USD

GBP/USD Wilts Toward Key Retracement As Rate Prospects Support USD

GBP/USD FUNDAMENTAL BACKDROP

GBP/USD remains under significant pressure in Thursday’s European session, with most of that coming from the ‘USD’ side of the pair.

Wednesday’s release of minutes from the US Federal Reserve’s last interest-rate setting meet on January 1 showed the central bank in perhaps rather more hawkish mood than the markets had expected, and warning again that interest rates might have to remain higher for longer in order to bring inflation to heel.

Policymakers are worried that China’s emergence from its more draconian Covid-lockdown measures, along with Russia’s ongoing war in Ukraine, will increase the upward pressure on global prices. The Fed raises borrowing costs by a quarter of a percentage point last month.

Its outlook had its predictable strengthening effect on the US Dollar, with sterling particularly hard hit.

UK ECONOMY OFFERS FEW SIGNS OF HOPE

The UK of course has its own inflationary problems, but, given the underlying fragility of the economy, the Bank of England is felt to have less room to raise borrowing casts without causing a significant recession. Growth data have shown that the country just scraped some growth at the end of lastly year, but the BoE still worries that contraction will be unavoidable in 2023.

BoE Monetary Policy Committee member Catherine Mann said on Thursday that it was too soon to say whether the risks posed by last year’s inflation surge had peaked and that the central bank should continue to raise rates.

GBP/USD rose to six months peaks at the end of last year, as markets hoped that the end of US rate rises might be within sight. However, it has slid consistently since as the data have forced a rethink of that view.

Market focus for the remainder of Thursday will likely be on official revisions to US Gross Domestic Product data for last year’s final quarter. Growth is expected to be adjusted downward from the 3.2% initially estimated.

GBP/USD TECHNICAL ANALYSIS
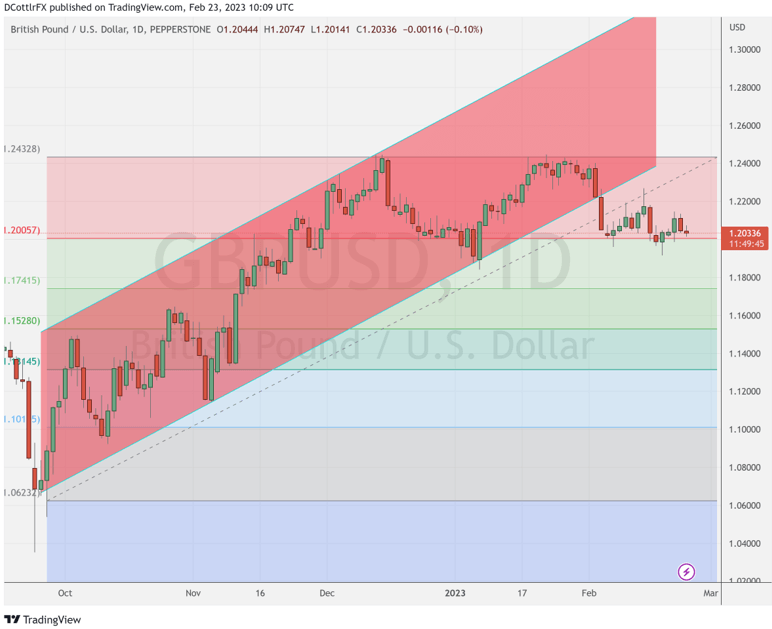
image1.png

Chart Compiled by David Cottle Using TradingView

Brave breed that they are, sterling bulls are clearly mounting a dogged defence at the first Fibonacci retracement of GBP/USD’s rise from the lows of last September to those December, six-month peaks.

That comes in at a $1.20057, a level at which the pair has bounced since February 3.

It’s clearly an important point to watch now, and sterling’s ability to stay above it in to this week’s close could be interesting. Should it fail, immediate focus will be on January 6’s intraday low of 1.18456. That point the start of a significant bounce, but should it give way, the second retracement level of 1.17415 will be in the bears’ sights.

They seem to have control at the moment, with GBP/USD showing a clear inability to break its nascent downtrend. IG Sentiment data offers little hope, with fully 65% of traders bearish on Sterling.

US Dollar Slides After FOMC Boost as Hikes Get Baked in. Is There a New Trend for USD?

US Dollar Slides After FOMC Boost as Hikes Get Baked in. Is There a New Trend for USD?

The US Dollar pulled back from overnight gains posted after the Federal Open Market Committee (FOMC) meeting minutes revealed a united board that supported the 25 basis point move at the gathering earlier month

The minutes reinforced the notion that the Fed is determined to get inflation under control and that any rate cuts are a long way off. This is something that they have verbalised on many occasions but perhaps has not been fully comprehended by markets.

The interest rate swap and futures markets now have 25 bp hikes for the next three FOMC meetings in March, May and June. Treasury yields are slightly softer with the hope that the Fed will get inflation under control further down the track.

New York Fed President John Williams was also on the wires yesterday and reiterated his hawkish stance as he emphasised the need to get price pressures under control.

In an interview on Bloomberg television, Band of International Settlements (BIS) Settlements CEO Augustin Carstens said that fiat currencies have won the battle over cryptocurrencies. Bitcoin remains below USD 25,000, trading near USD 24,600 at the time of going to print.

The Bank of Korea (BoK) left rates unchanged at 3.50% despite CPI currently running at 5.2% y/y. BoK Governor Rhee Chang-yong said in the post-decision press conference that more hikes can still happen despite the pause. Nonetheless, USD/KRW dipped under 1300.00.

The Australian Dollar has been the best-performing currency today after private capital expenditure data showed growth of 2.2% q/q over 4Q 2022 rather than the 1.0% forecast. The prior quarter was also revised up to 0.6% from -0.6%

Crude oil steadied after heavy losses yesterday with the WTI futures contract back above US$ 74 bbl and the Brent contract nudging US$ 81 bbl.

APAC equities have had a quiet day with Japan on holiday and futures are indicating a solid start to the Wall Street session later today.

Elsewhere, China instructed state-owned enterprises to stop using the top 4 auditing firms Deloitte, EY, KPMG and PWC.

The directive comes after Beijing agreed to auditors examining the books of Chinese firms listed on US exchanges last year. This action prevented these companies from being kicked out of the US.

Looking ahead, after Euro-wide CPI, US GDP data will be keenly watched by the market.

DXY (USD) INDEX TECHNICAL ANALYSIS

The DXY index broke above a descending trend channel and has consolidated above it, which might suggest that the bearish trend could be pausing or might be over.

Fortifying the break, the price also moved above 10-, 21- and 55-day simple moving averages (SMA). This could suggest that bullish short and medium term is potentially evolving.
The longer-term 100- and 200-day SMAs hang above the price and a move above these may confirm unfolding bullish and that a new is possibly emerging.

Resistance might be at the prior peaks of 104.67, 105.63 and 105.82. On the downside, support could be at the previous lows and breakpoints of 102.58, 101.30 and 100.82.

image1.png

When Can S&P 500 Volatility Break a Stock Diversification Strategy? Analyzing the VIX

When Can S&P 500 Volatility Break a Stock Diversification Strategy? Analyzing the VIX

What is Stock Sector Diversification?

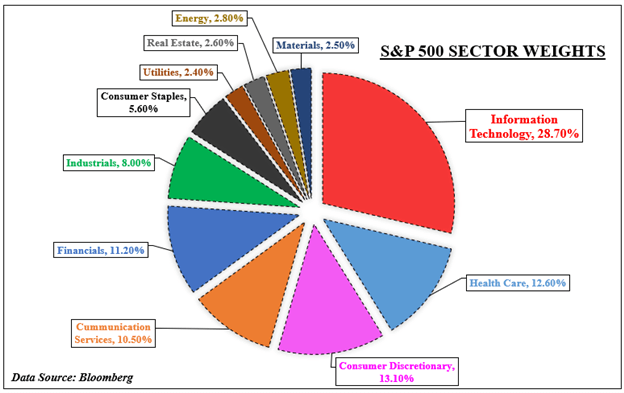
If an investor wants to diversify exposure in the US stock market, there are plenty of sectors to choose from in the S&P 500. On the pie chart below, there are 11 to pick that range from growth-oriented information technology to value-centered industrial firms. To hedge against sector-specific risks, a trader could spread out their portfolio between some combination of these.

In such a case, if the S&P 500 hits a bump, losses in one corner of the market might be offset or be reduced by gains in another. This might work if all the sectors in the market are not falling in unison. However, when almost every corner of the index is declining in a binary move, a stock diversification strategy becomes increasingly unreliable.

This is not a case against a stock diversification strategy. Rather, this is analyzing conditions in the market that impact sectors moving together in the S&P 500. This is performed using the CBOE Volatility Index (VIX), also known as the market’s preferred ‘fear gauge’. With that in mind, what levels of VIX should traders and investors watch that risk undermining a stock diversification strategy?

S&P 500 Sector Breakdown

S&P 500 Sectors

What is the VIX and Why Should Traders Watch it?

The VIX was created in 1990 to use as a benchmark for analyzing volatility projections in the US stock market. It trades in real-time, reflecting expectations of the price movement over the next 30 days. As such, it tends to have a very close inverse relationship with the S&P 500. In other words, as stocks fall, the VIX rises and vice versa. For a deeper dive into the VIX, check out a complete guide here.

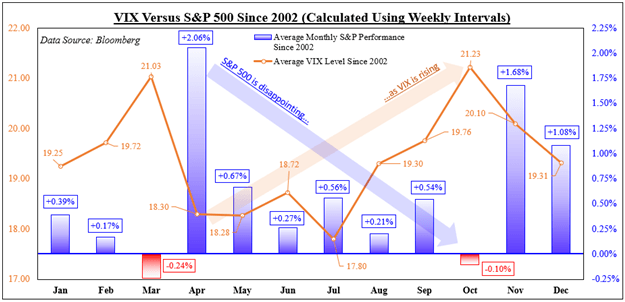
This inverse relationship can be seen in the next chart, which shows the average S&P 500 performance compared to equivalent VIX levels since 2002. For the study, average weekly data is used to calculate monthly outcomes. This is done so that it helps avoid truncating the ‘volatility of volatility’, whereas a monthly reading could run into the data failing to capture the broader trend.

Looking at the data, April tended to see the most optimistic performance for the S&P 500, averaging 2.06%. Afterwards, this performance tapered before bottoming in October, when the benchmark stock index returned about -0.1%. During this period, we saw the VIX climb, starting at 18.30 in April, then rising to 21.23 in October. Knowing this, we can now look at what happens within the S&P 500.

Trading Strategies and Risk Management

Volatility

Why is volatility so much important for traders?

Start Course

VIX Versus the S&P 500

VIX Versus the S&P 500

S&P 500 Cross-Sector Correlations with the VIX

To see when a stock sector diversification strategy can fail, we will need dedicated price indices of the 11 sectors in the S&P 500. The data used for the latter only goes back to 2002. We can then find correlation levels between the VIX and for each sector using a one-month rolling basis. The correlations range between -1 and 1. A -1 reading means perfect inverse movements between two variables, while 1 is perfect unison.

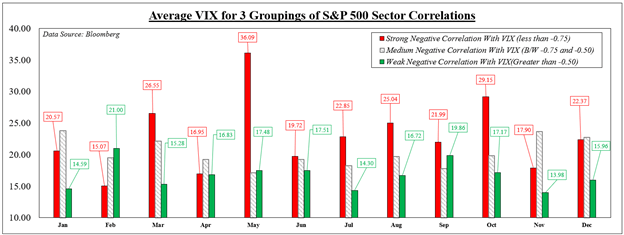
Averaging all 11 outcomes in each period offers a cross-sector correlation reading with the VIX. Next, the correlations are separated into groups ranging from strong (-1 to -0.75), medium (-0.75 and -0.50), and weak (all values greater than -0.5). A strong inverse reading reflects the VIX rising/falling as sectors dropped/climbed together with the most consistency. Weak ones represent sectors moving more freely.

In 7 out of 12 months, higher levels of VIX were associated with stronger cross-sector inverse correlations with the ‘fear gauge’. For example, the average weekly price of the VIX in March was 26.55 when the S&P sectors moved the most in unison. The price dropped to 15.28 when we saw sectors move more freely. Knowing this, what levels of VIX can undermine a cross-sector diversification strategy?

Foundational Trading Knowledge

Understanding the Stock Market

Help boost your stock market knowledge!

Start Course

VIX Price Versus Different Levels of S&P Cross-Sector Inverse Correlations

VIX Price Versus Different Levels of S&P Cross-Sector Inverse Correlations

When Can a Stock Sector Diversification Strategy Fail?

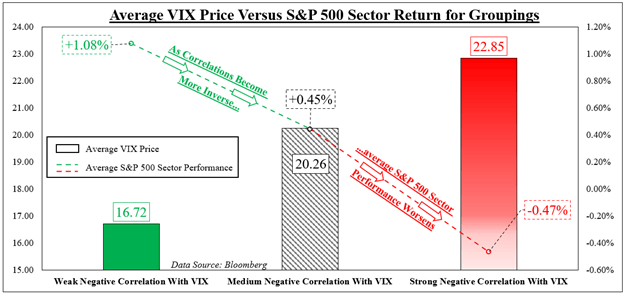
We can now average the prices of the VIX for all months and years since 2002 based on the 3 correlation groupings. Simultaneously, we will average the weekly performance of all the S&P sectors and align them based on the same categories. On the chart below, we can see that the outcome was fairly predictable. Stronger inverse correlations with the VIX aligned with increasingly worse performance between sectors.

When we saw all the sectors move the most opposite to the VIX, the average price of the ‘fear gauge’ was 22.85. When this occurred, the average return of each sector was -0.47%. Conversely, when the sectors moved more freely relative to the VIX, the price of the latter was 16.72. At that price, the average return between each sector was +1.08%.

It should be noted that correlation does not imply causation. Just because the VIX is at some arbitrary price does not mean that it is the sole cause of trading dynamics between sectors. Rather, it is being used here as a frame of reference. What actually causes markets to fall in binary moves is a combination of fundamental factors: monetary policy, fiscal spending, company guidance and more.

What Can Traders Do About Volatility?

Knowing this information, what can traders do when expecting high volatility and strong cross-correlations across market sectors? High bursts of volatility are often short-lived and temporary. During these times, haven-oriented assets tend to outperform. This includes the US Dollar, which often rises during times of global market stress. Short selling stocks is another. Scaling back exposure on current and new undertakings also help. Combining these could help prepare traders for some bumpy roads.

VIX Price Versus Performance of S&P 500 Sectors Based on Correlation Groupings

VIX Price Versus Performance of S&P 500 Sectors Based on Correlation Groupings

— Written by Daniel Dubrovsky, Strategist for DailyFX.com

Gold Price Action Setup: Deciphering the Trend

Gold Price Action Setup: Deciphering the Trend

This is a follow-up to the previous update “Gold and Silver Technical Outlook: Have Precious Metals Turned Bearish?”, published Feb.13. This piece attempts to address the question by looking at less-subjective ways to identify the trend on the daily charts.

On the daily charts, the color-coded charts based on trending/momentum indicators suggest that XAU/USD is currently in a consolidation phase (not yet bearish) within a bullish phase. To some extent, this is evident from price action as well.

XAU/USD Daily Chart

image1.png

The retracement so far this month is 38.2% of the rise from November – retracements of 38.2%-50% are considered to be reasonable, and not necessarily the end of the prevailing trend. Secondly, gold remains above the lower edge of the Ichimoku cloud support, the 200-day moving average, and the resistance-turned-support on the 89-day moving average. Moreover, XAU/USD hasn’t broken below any noticeable price pivot.

XAU/USD 240-minute Chart

image2.png

The tricky bit here is that there is no significant price pivot on the daily charts above the August high of 1808 due to the sharp/unidirectional rise in January. The absence of a price pivot makes it tricky to decipher a change in trend, especially in the case of ‘inverted-V’ or ‘A’-shaped declines. That is, the confirmation of a change in trend can come later than instances where there is a price pivot closer to the peak.

XAU/USD Daily Chart

image3.png

In this regard, bears would argue that gold has turned bearish in the short term based on an Average True Range-based trending indicator (see chart), which the color-coded intraday charts confirm. On the 240-minute charts, the trend is bearish.

XAU/USD Daily Chart

image4.png

Depending on the timeframe of reference, the assessment differs. XAU/USD is now approaching a strong support area of 1775-1810. A positive Stochastics divergence on the daily charts suggests the slide is losing steam and the yellow metal could be due for a rebound (see daily chart). However, gold would need to break above the immediate ceiling at 1890-1900 for the immediate downward risks to ease.


AUD Price Forecast: Aussie at Key Inflection Point Post-FOMC

AUD Price Forecast: Aussie at Key Inflection Point Post-FOMC

AUSTRALIAN DOLLAR FUNDAMENTAL BACKDROP

The Australian dollar has clawed back some lost gains after yesterday’s U.S. dollar surge post-FOMC minutes. An almost expected hawkish slant to the minutes ensued with no mention of disinflation adding to a sustained tight monetary policy environment. Furthermore, some FOMC members opted for a 50bps interest rate hike which has seen an uptick in money market pricing for the March meeting (+/- 30bps at present).

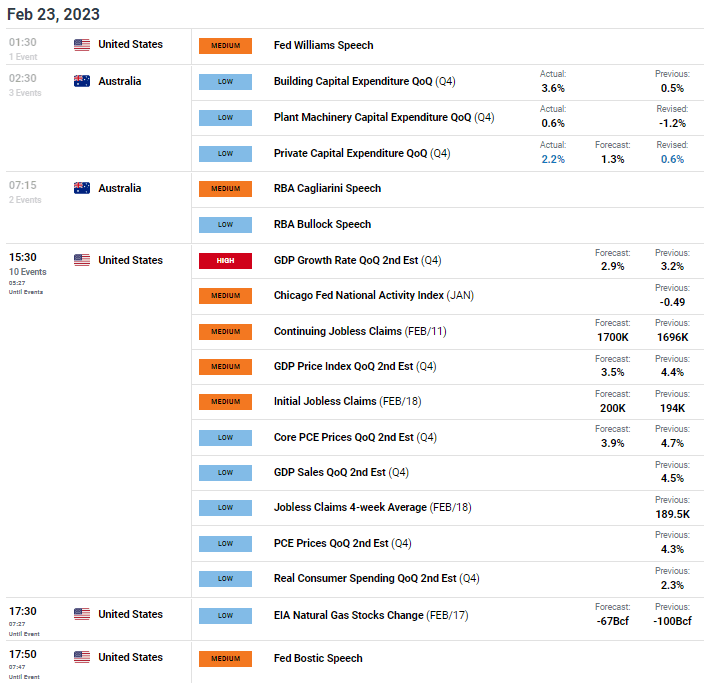
Australian capital expenditure data beat estimates across the board (reaching its highest level since Q4 2021) showing optimism in these sectors and the increase in capital inflows has driven up the demand for the AUD this morning. Looking ahead, markets will be focused on US GDP as well as the accompanying labor market data in the form of jobless claims. US GDP is expected to come in marginally weaker than the previous read while we look to roundoff the trading day with the Fed’s Bostic for further guidance.

ECONOMIC CALENDAR

image1.png

TECHNICAL ANALYSIS

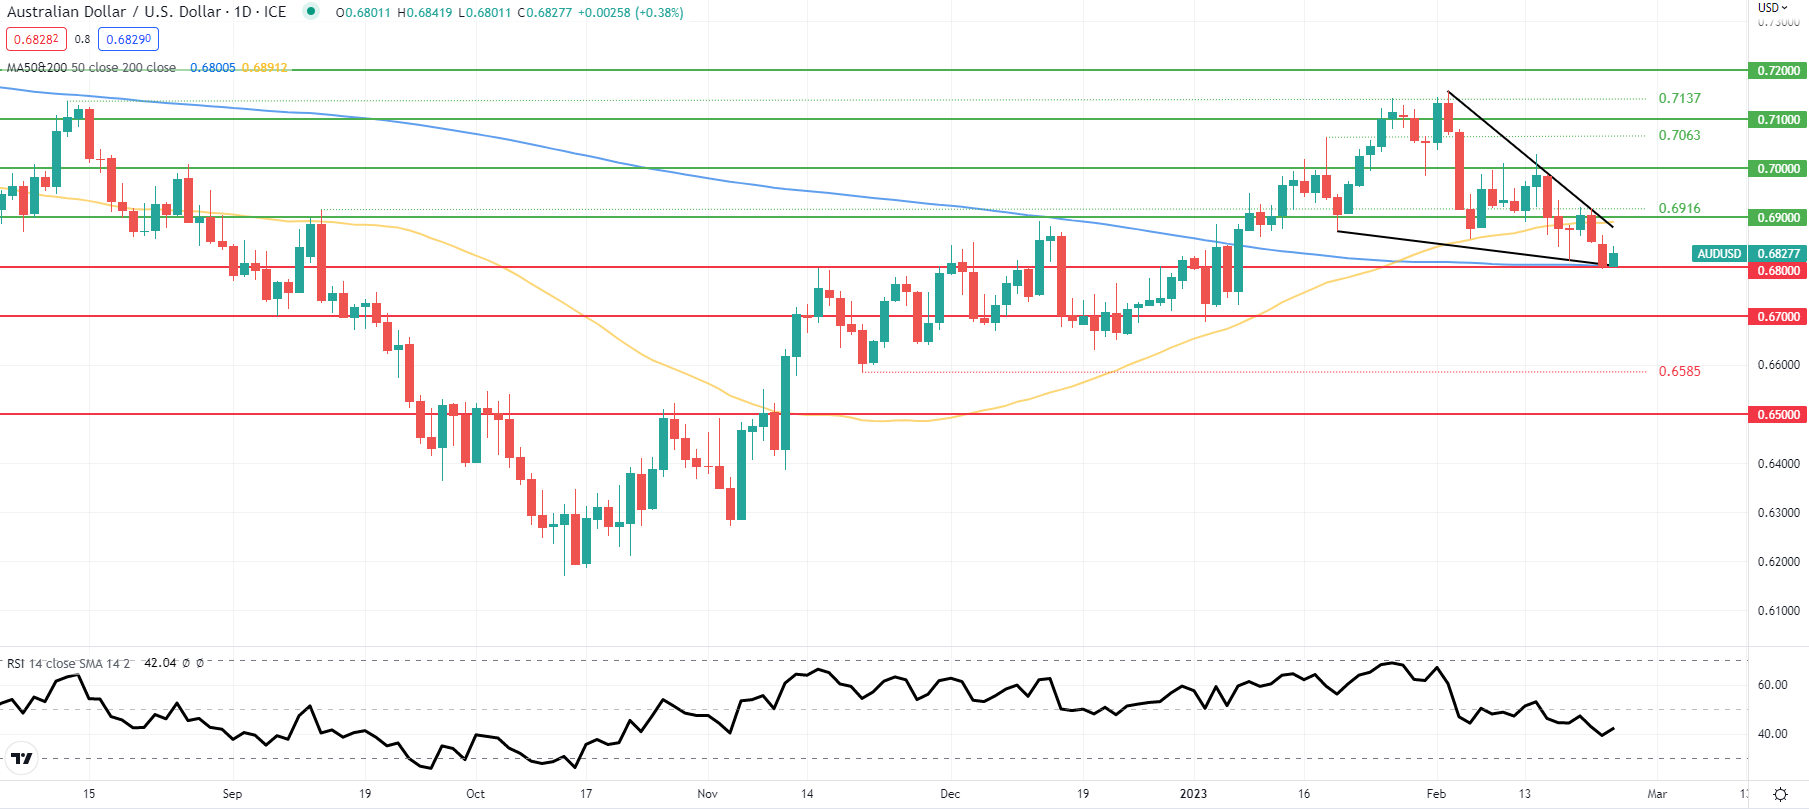
AUD/USD DAILY CHART

image2.png

Chart prepared by Warren Venketas, IG

Daily AUD/USD price action extends its move withing the falling wedge chart pattern (black) that traditionally points to an upside breakout. The 0.6800 psychological support handle has been defended by bulls in conjunction with the 200-day SMA (blue) but a daily candle close below this key inflection point could invalidate the falling wedge. From a bullish perspective, a breach above wedge resistance/50-day SMA/0.6900 could then see a follow through towards subsequent resistance zones.

Key resistance levels:

  • 0.7000
  • 0.6916
  • 0.6900/Wedge resistance/50-day SMA

Key support levels:

  • 0.6800/Wedge support/200-day SMA
  • 0.6700

IG CLIENT SENTIMENT DATA: BEARISH

IGCS shows retail traders are currently LONG on AUD/USD, with 64% of traders currently holding long positions. At DailyFX we typically take a contrarian view to crowd sentiment resulting in a short-term bearish disposition.

EUR/USD on a Knife Edge as Eurozone Core Inflation Ticks Higher

EUR/USD on a Knife Edge as Eurozone Core Inflation Ticks Higher

EUR/USD FUNDAMENTAL OUTLOOK

EURUSD posted modest gains in the Asian session following yesterday’s drop toward the 1.0600 handle. The US Dollar index has seen a slight resurgence following the European open, with the 1.0600 level making way and the 1.0500 level looking more and more likely to be reached.

This morning brought Eurozone Inflation data for January with annual inflation down to 8.6% in the euro area and down to 10.0% in the EU. In January, the highest contribution to the annual euro area inflation rate came from food, alcohol & tobacco (+2.94 percentage points, pp), followed by energy (+2.17 pp), services (+1.80 pp) and non-energy industrial goods (+1.73 pp) according to data published by Eurostat, the statistical office of the European Union.

Chart, bar chart  Description automatically generated

Source: Eurostat

Core inflation however ticked higher coming in at 5,3%, a new record and likely cementing a 50bps hike by the ECB next month. This comes a week after comments by ECB President Christine Lagarde stating her intention for a half point hike.

Graphical user interface, text, application, email  Description automatically generated

For all market-moving economic releases and events, see the DailyFX Calendar

FOMC MEETING MINUTES

The Federal Reserve meeting minutes released last night confirmed the hawkish rhetoric from Fed officials over the past two weeks. The key takeaways obviously being that the Fed is committed to higher rates for longer to bring inflation down to its 2% target. The minutes showed that a few Fed officials preferred a 50bps hike at the meeting with the majority sticking to a 25bps hike. Much of the hawkish rhetoric has been priced in already with the Fed funds peak rate expectation already rising from 4.8% to around 5.3% during the month of February. This begs the question, how much higher can the dollar index rise? There is of course a possibility that we continue to see the Dollar index remain supported heading into the March meeting.

Later today we have US GDP Growth Rate 2nd estimate for Q4 2022 with forecasts sitting at 2.9%. We will also get continuing and initial jobless claims which should give further insights into the strength of the labor market and comments from Fed policymaker Bostic ahead of tomorrow’s key US PCE data (Fed’s preferred measure of inflation).

TECHNICAL OUTLOOK AND FINAL THOUGHTS

Given that the FOMC minutes did not spring up any new hawkish surprises it has been interesting to see the dollar index rally continue this morning. Meanwhile the Eurozone core inflation data continues to rise with my view that inflation is far more entrenched in economies globally than market participants believe.

From a technical perspective, EURUSD saw a daily candle close just above the key 1.0600 level following last night’s FOMC minutes release. This key support level has now given way opening up the possibility of continued downside with immediate support resting around the 1.055 handle and below that at 1.0500. A daily candle close below the 1.0600 handle is still needed in my opinion for the move to be sustainable moving forward.

EUR/USD Daily Chart – February 23, 2023

Chart  Description automatically generated

LiteFinance Experienced Significant Events in the Previous Year

LiteFinance Experienced Significant Events in the Previous Year

LiteFinance opened a new office in Tanzania.

LiteFinance was happy to announce the opening of LiteFinance’s office in Tanzania!

Their clients can now visit the regional office and ask questions about the company’s services. LiteFinance managers will be glad to assist them with any issues. The office will also be a venue for regular training seminars.

LiteFinance will continue promoting its services in Tanzania. The company’s CEO visited the regional office to discuss further development plans and make our services more accessible to local traders.

LiteFinance opened a new office in Tanzania

Contacts

Address: Victoria Plaza, 4th floor, Samora Avenue / Morogoro Road, Dar es Salaam.

Working hours: From 9:30 to 16:30 (GMT+3), Monday to Friday.

WhatsApp: +255756085976

LiteFinance has opened a new regional representative office in Singapore.

The office offers the following services:

  • supports LiteFinance clients and partners in Singapore;
  • provides professional training courses in trading and investing;
  • provides solutions to generate profits in the financial markets.

Clients and partners are always welcome at the office!

Contact Information

Address: 11 Yio Chu Kang Rd, Singapore 545679

Telegram: https://t.me/litefinancesg

E-mail: [email protected]

Working hours: 09:00 – 17:00 (GMT+1)

LiteFinance has opened a new regional representative office in Singapore

LiteFinance has opened a new office in Morocco.

The company’s clients can now visit our regional office and consult with the managers. The office will also be a venue for regular training seminars.

Clients from Morocco can also contact our technical support team in Arabic and French via LiveChat during the office’s working hours.

Contact Information

Address: 59 Av. FalOuldOumeir, Rabat, Morocco

Phone number: +212-537686752

E-mail: [email protected]

Working hours: 08:00 – 18:00 (GMT+1)

LiteFinance has opened new office in Morocco

The long-awaited LiteFinance Dream Draw final took place on Saturday, October 15, 2022.

During the livestream, traders won amazing prizes worth $350,000:

  • a $250,000 certificate to buy your dream house;
  • a $60,000 certificate to purchase a Lexus GX or other luxury car of the winner’s choice;
  • two fully-loaded iMac workstations;
  • three powerful MacBooks Pro 16;
  • three powerful and compact MacBooks Pro 13;
  • three ultra-thin and fast MacBooks Air;
  • three iPhones 13 Pro Max 512 GB;
  • four iPhones 13 Pro 512 GB.

Twenty lucky winners from Vietnam, Malaysia, Iran, Turkey, Jordan, the United Arab Emirates, and the Philippines participated in the final.

Video of stream

LiteFinance’s one-of-a-kind services

Over one million traders have chosen LiteFinance to trade in the financial markets. The company has designed one-of-a-kind services for smooth and successful trading: a dedicated online platform, a copy trading service, and mobile apps.

Litefinance

Dedicated trading platform

The LiteFinance team yearns to make online trading smooth and accessible to everyone. One of the broker’s solutions is a user-friendly trading platform that runs in any browser on any device.

The platform includes the “Trade”, “Copy”, “Analytics”, “Profile”, “Finance”, “MetaTrader”, and “Affiliate” sections.

To conduct trading operations, the “Trade” tab is used. All assets are subdivided into groups: currency pairs, oil, precious metals, etc.

Here, the trader can add trading indicators or view important news in an economic calendar. The chart also shows trades closed by other traders: they are marked as yellow dots.

The latest information is published in the “Analytics” tab, so LiteFinance’s clients do not have to search for and examine forecasts on numerous resources. The Twitter Watcher service can be activated in this tab, too. This option delivers trading recommendations for cryptocurrencies based on messages on Twitter.

The LiteFinance online platform also provides various training materials: articles, webinars, reviews, etc. They help figure out the basics of trading in the financial markets.

In the MetaTrader tab, one can open new trading accounts (CLASSIC, ECN, and DEMO), switch between accounts, and transfer money. This tab also allows downloading MT4 and MT5 platforms and changing account passwords.

Besides trading, LiteFinance’s clients can earn money from copying other traders’ positions via a copy trading service.

Copy trading system

A handy ranking system allows users to choose a trader and start copying their trades. Traders can be filtered by risk and profitability. The trader’s window will show commissions, the volume of funds managed, and the number of copy traders. The trading history is also displayed so investors can estimate trading efficiency and check out the trader’s most used assets, types and volume of trades, and profit/loss ratios.

Various copy parameters can be set in the system: volumes (1 to 1 or a % of each trade’s volume), the maximum loss and profit, and amounts to copy.

Users can get in touch with a trader directly via an online chat to discuss trading strategies.

LiteFinance wishes good luck to all traders!

New Zealand Dollar Skips a Beat after RBNZ Hike. Where to for NZD/USD?

New Zealand Dollar Skips a Beat after RBNZ Hike. Where to for NZD/USD?

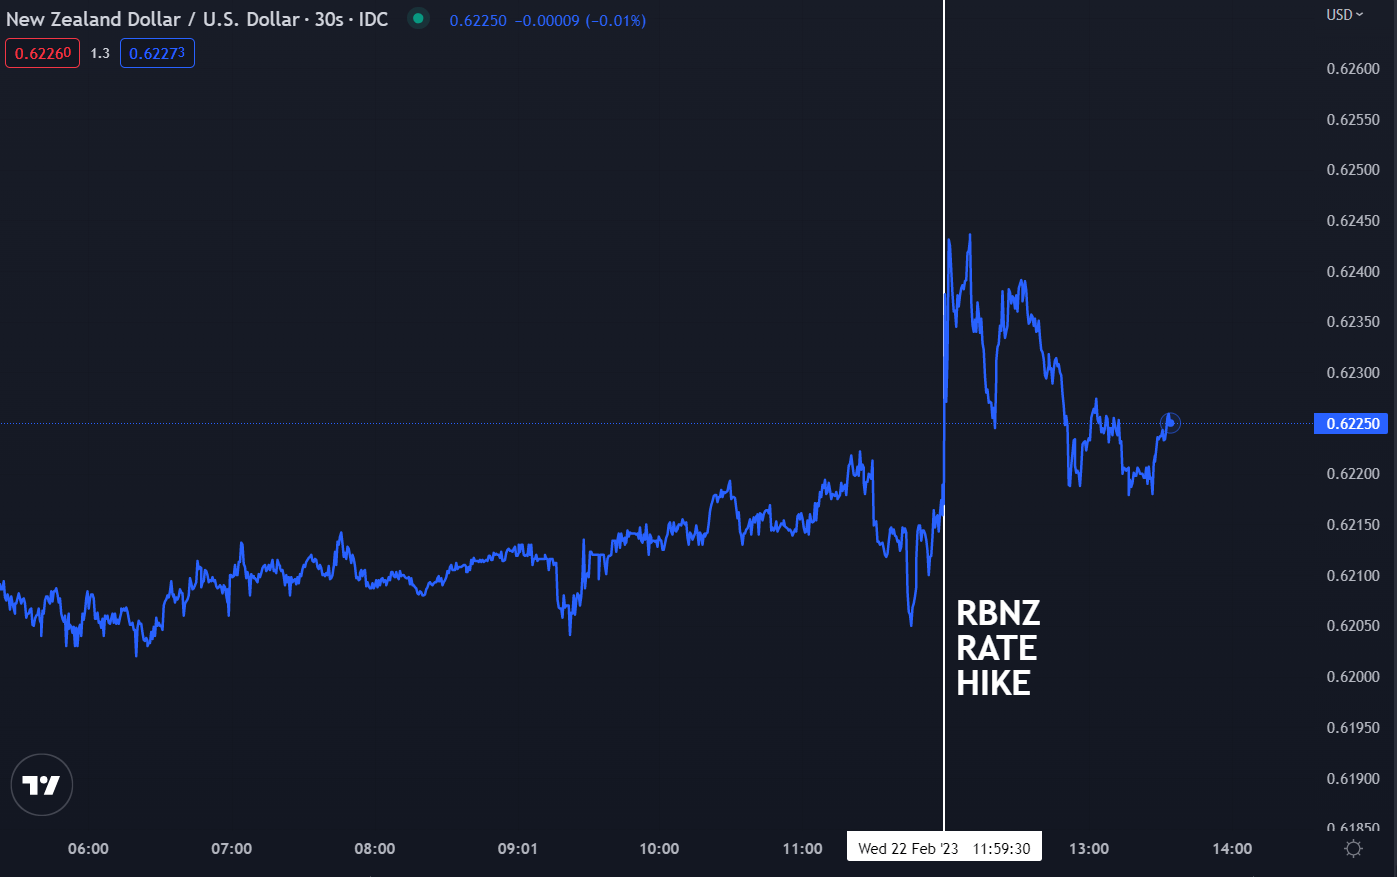
The New Zealand Dollar was catapulted higher after the Reserve Bank of New Zealand (RBNZ) raised the official cash rate (OCR) target by 50 basis points (bp) to 4.75% from 4.25%.


The hike was less than the last jumbo lift of 75 bp in November and was mostly anticipated. The overnight index swaps (OIS) market had priced in 45 bp prior to the decision. Most economists surveyed by Bloomberg forecast a 50 bp increase.


The OIS market is pricing a peak in the rates of around 5.40% later this year. The RBNZ see the cash rate topping out at 5.5%. The immediate reaction saw the Kiwi ratchet up from around 0.6410 to over 0.6440 before pulling back.


The tightening of monetary policy comes at a time when the aftermath of cyclone Gabrielle that wreaked havoc on the North Island last week is still being assessed.


NZ Prime Minister Chris Hipkins has described the cyclone as the country’s most damaging natural disaster in at least a generation. The cyclone followed a torrential rainstorm around Auckland, the largest city on the island nation.

It would seem that the RBNZ is resolute in taming price pressures. NZ Inflation remains stubbornly high at 7.2% year-on-year to the end of the fourth quarter. The bank has an inflation target band of 1-3%.

In the post-decision press conference, the RBNZ Governor Adrian Orr said that the bank see the impact of the severe weather event as adding to inflation. They anticipate that the re-build will add 1% to GDP over the coming years than would otherwise be the case.

He said that a 25, 50 or 75 bp shift up were options that were all on the table, although the discussion was mostly around 50 or 75 bp hike.

A tight labour market is above the RBNZ’s own measure of the maximum sustainable level of employment. The unemployment rate remains near multi-generational lows at 3.4%.

The RBNZ see immigration picking up again and that may alleviate some labour pressures, but that may also add to broad based inflationary pressures.

The RBNZ has been one of the sharper central banks in terms of being the first to cut rates at the start of the pandemic and then among the leaders when it came to hiking to stare down inflation.

New Zealand’s S&P/NZX 50 equity index continued to slide lower on the news following losses seen earlier this week.

NZD/USD REACTION TO RBNZ RATE HIKE

image1.png


GBP/USD Latest: UK Data Empowers Sterling, FOMC Minutes Near

GBP/USD Latest: UK Data Empowers Sterling, FOMC Minutes Near

The British Pound is trading on either side of 1.2100 against the US dollar, buoyed by better-than-expected data this week. While the US dollar is also strong, supported by rising US Treasury yields, Sterling is making gains against its counterpart across the Atlantic and a wide range of other G7 currencies. The latest UK PMIs beat forecasts and showed business activity in the UK, especially in the services sector, picking up sharply in February, while the latest look at the government books showed public sector net borrowing (PSNB) boosted by better-than-expected tax receipts and in surplus in January.

image1.png

The latest data suggest that the UK economy may be improving, giving the Bank of England more wiggle room to increase interest rates. UK inflation is on the way down, but at a current level of 10.1% is sharply higher than the Bank of England’s (BoE) mandate of around 2%. Inflation is expected to fall quickly over the coming months, according to the BoE, as energy prices and the cost of imported goods fall, while the UK consumer has less disposable income to spend on goods and services. The UK central bank is seen hiking rates by 25 basis points at the March meeting to 4.25%, and by another 25 basis points in Q2. If growth continues and inflation falls in line with the BoE’s expectations, there may be a case for a UK rate cut in Q4.

image2.png

The US dollar has been the main driver of cable over the past few months as the greenback pushes higher due to a series of aggressive rate hikes in the US. The US dollar index is less than 40 pips away from making a fresh multi-week high as US yields continue their recent rally on a hawkish US central bank backdrop.

US Dollar Index (DXY) Daily Chart – February 22, 2023

image3.png

 Today’s FOMC minutes, released at 19:00 GMT, will show the extent of the Fed’s hawkish outlook. Recent Fed commentary has been heavily skewed towards higher rates for longer with some participants suggesting that a 50 basis point hike was discussed at the last meeting.

For all market-moving data releases and events, see the DailyFX Economic Calendar

The daily GBP/USD chart shows the pair trapped between the 20-, 50-, and 200-day moving averages and in neither overbought nor oversold territory. The recent double-top around 1.2450 is unlikely to be tested in the near future with 1.2270s and 1.2290s providing resistance. The 200-dma at 1.1934 should act as a brake in the case of any sell-off.

GBP/USD Daily Price Chart – February 22, 2023


Dow Breaks From Pattern as VIX Soars…But Why Did the Dollar Budge?

Dow Breaks From Pattern as VIX Soars…But Why Did the Dollar Budge?

The US markets reopened Tuesday after an extended holiday weekend to unmistakable risk aversion. What is remarkable is that the sense of fear that we would eventually see through the New York trading hours of this past session wasn’t prominent in the preceding sessions and certainly not Monday’s trading session. In fact, one of the most prominent international performances to start the week was from the Chinese-based Shanghai Composite which posted its biggest single-day rally (approximately 2 percent) in nearly three months. I always take into consideration motivation when evaluating markets. It isn’t always necessary to have a singular driver for sentiment to establish a productive trend, but it is a very common feature of momentum-oriented landscapes.

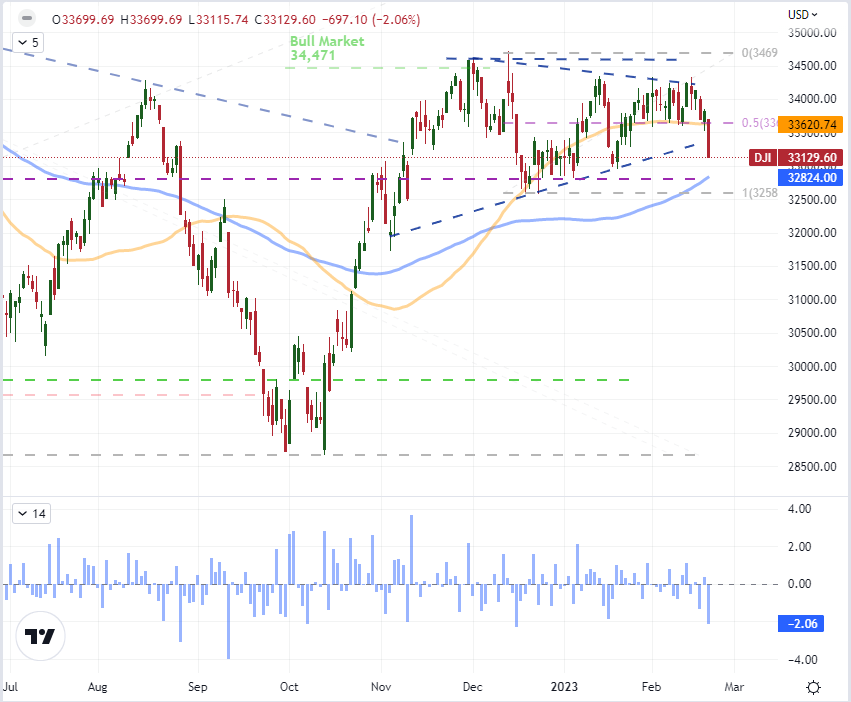
As I assess the conviction of the markets, it is hard to overlook the strong risk aversion experienced through this the Tuesday US session. While there were numerous asset classes reflecting the pressure, the US indices were the most prominently displayed for international investors. All of the major equity measures I follow regularly offered up significant declines from the broad S&P 500 to the small cap Russell 2000 to the speculators’ favorite Nasdaq 100. That said, the most technically-relevant development in my book is the break from the Dow Jones Industrial Average. This blue chip index has avoided much of the errant volatility that we’ve seen recently that in turn has produced false breaks. What is left is months of congestion that turned into three weeks of the smallest trading range since June 2021. The -2.1 percent tumble this past session cleared out that range, the 50-day moving average and the lower bound of the larger wedge from the past three months.

Chart of Dow Jones Industrial Average with 50 and 100-Day SMAs, 1-Day Rate of Change (Daily)

image1.png


Looking at another measure of market activity, the VIX volatility index would finally show serious signs of life Tuesday. The index charged 2.9 handles higher (over 14 percent), through the day. That is the biggest jump in percentage terms since August 26th – the liftoff stage of the S&P 500’s last substantial leg lower. This measure, like the Dow, has been particularly reticent to throw in with sentiment moves that have not been backed by serious sources of conviction towards risk aversion. There is a natural ‘revision to the mean’ force on measures like implied volatility, and the VIX is rising off lows that are relative extremes to the past year. Further back, there are significantly deeper lows; and we are far from the extremes on the opposite end of the spectrum – which I believe to be closer to the 50 mark. Yet, this reflects a healthy appreciation that markets can still move significantly and unpredictable. That said, a responsive market does not necessarily compensate for a lack of a systemic fundamental driver. If ‘fear’ is going to play fully take the wheel on a sustained market move, a significant escalation is necessary.

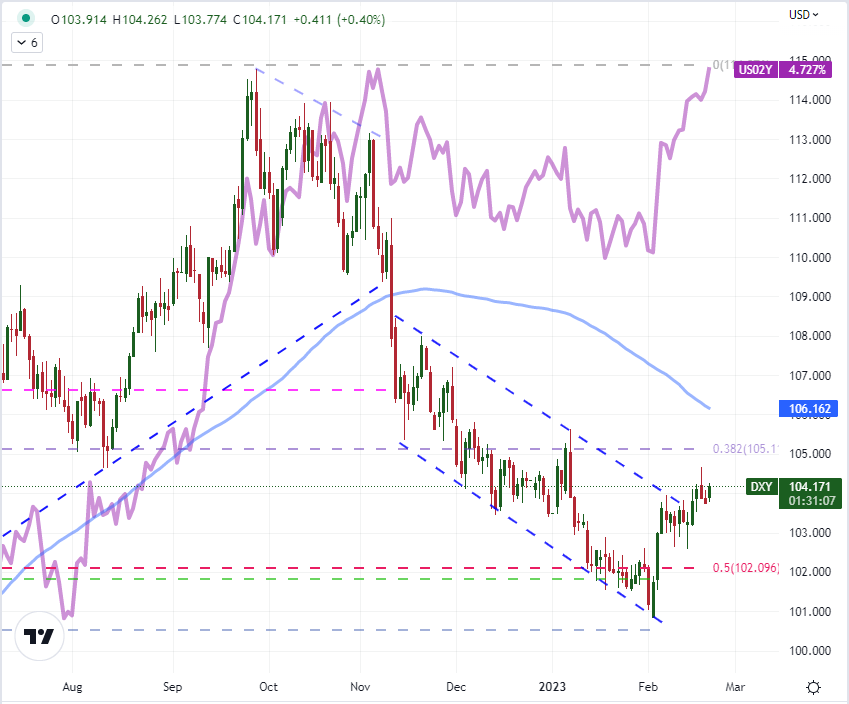
One remarkable distinction in the distribution of risk trends across the market – unrelated to closure of certain regions – was the lack of responsiveness from certain key safe havens. With a strong drop in risk-leaning benchmarks like the US equity indices, I would expect a haven like the US Dollar to benefit. The correlation between the currency and activity measure is a health 0.60 over the past 20 days (strong and positive) and 0.71 over the past three months or 60 days. Nevertheless, the DXY Dollar Index responded to swell in presumed fear with a meager 0.41 point climb. That wouldn’t clear Friday’s peak high much less revive the nascent bull trend attempted this past week. What makes the Greenback’s lack of traction even more surprising is that the US 2-year yield, which is a reflection of interest rate expectations, as also pushing a new multi-year high through the day. Whether a response to Fed speak, the Cleveland Fed research report or general economic data; there was a distinct disconnect from the Dollar. This is another fundamental red flag for the conviction on risk trends. I would expect either risk appetite to capitulate to the currency’s skepticism or the USD to find its safe haven bid.


image3.png

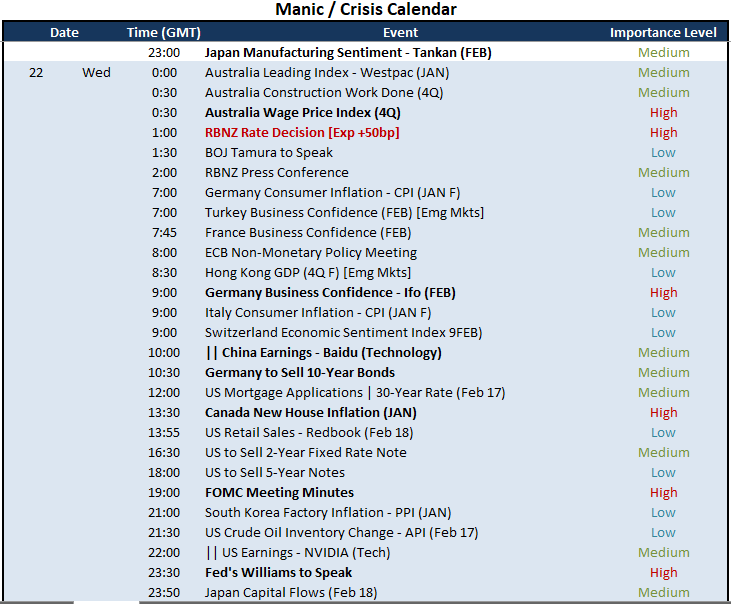
Looking ahead to the next 24 hours of macroeconomic event risk, there are a few highlights of serious prominence but nothing that I would consider to be systemically capable. For a Dollar and monetary policy impression, we have a little Fed speak; but many will be combing through the FOMC minutes to see if there is any insight as to how the central bank will be swayed in its views at the next central bank rate decision. There has been a swing in market expectations relative to the Fed’s own views, and this requires significant support to maintain its speculative force. Ultimately, I believe the PCE deflator – the Fed’s favorite inflation reading – will carry more weight in this fundamental field. For more targeted but acute monetary policy influence, the RBNZ rate decision in the Asian session is a capable Kiwi Dollar driver – just don’t expect its outcome to leach back into the global market.

Top Global Macro Economic Event Risk for Next 24 Hours

image4.png