US Dollar Price Action Setups: EUR/USD, AUD/USD, USD/JPY, GBP/USD

US Dollar Price Action Setups: EUR/USD, AUD/USD, USD/JPY, GBP/USD

EUR/USD Daily Chart – Rising Wedge Breakout Still in Focus

The Euro may remain vulnerable to the US Dollar from a technical standpoint. That is because last week, EUR/USD continued to make downside progress after clearing under a Bearish Rising Wedge chart formation. Immediate support is the 23.6% Fibonacci retracement level at 1.068, which was reinforced over the past 24 hours as prices were unable to clear this floor. Further upside progress, especially through the 1.0713 – 1.0787 inflection zone, would place the focus on the floor of the wedge. Otherwise, extending losses exposes the 38.2% level at 1.0461.

EUR/USD Daily Chart – Rising Wedge Breakout Still in Focus

AUD/USD Daily Chart – Head & Shoulders Brewing

The US Dollar could be readying to extend gains against the Australian Dollar. In addition to a Rising Wedge, a bearish Head & Shoulders chart formation is brewing on the daily chart below. The neckline seems to have been reinforced around 0.6893. A confirmatory breakout under this price could open the door to extending losses toward the 100-day Simple Moving Average (SMA). Otherwise, pushing above 0.7009 – the right shoulder – opens the door to revisiting the January high where key resistance stands around 0.7137.

AUD/USD Daily Chart – Head & Shoulders Brewing

USD/JPY Daily Chart – Trendline Breakout Remains in Focus

The US Dollar remains higher against the Japanese Yen since USD/JPY broke above the falling trendline from the end of last year. Still, the 50-day SMA is holding as critical resistance, maintaining the broader downside focus. A confirmatory push above the 23.6% Fibonacci retracement level at 133.05 would likely offer an increasingly bullish outlook, placing the focus on the 38.2% Fibonacci retracement level at 136.66. Otherwise, a turn lower places the focus on the January low at 127.22.

USD/JPY Daily Chart – Trendline Breakout Remains in Focus

GBP/USD Daily Chart – Prices Bounce off Double Top Neckline

The US Dollar continues consolidating against the British Pound. GBP/USD recently bounced off the neckline of a Double Top chart formation around 1.1951. This followed an emergence of a Doji candlestick pattern, which showed indecision as prices hit support on the way down. That has opened the door for prices to revisit the critical 1.2293 – 1.2444 resistance zone. Key resistance is the 50-day SMA. Clearing the latter opens the door to face last month’s high. Otherwise, breaking under the neckline exposes the 100-day SMA.

GBP/USD Daily Chart – Prices Bounce off Double Top Neckline


Natural Gas Price Setup: Is it Beginning to Build a Base?

Natural Gas Price Setup: Is it Beginning to Build a Base?

NATURAL GAS PRICE SETUP

It may be too soon to conclude that the worst for US natural gas prices is over. But a minor rebound or an extended range is plausible in the interim.

To be sure, beyond the hourly timeframes, the trend remains down across multiple timeframes. Indeed, as arecent update highlighted, a major double-top pattern (the 2022 highs) triggered at the end of last year points to further downside, potentially toward the 2020 low of around 1.45 (see weekly chart).

Natural Gas Weekly Chart

image1.png

Moreover, zooming in on the 240-minute charts, there is very little evidence to suggest that natural gas prices are reversing their bearish course. However, tentative signs of an extended consolidation have started to emerge recently.

Natural Gas 240-minutes Chart

image2.png

ays are a sign that attempts by bulls to push prices higher have been unsuccessful so far. Despite that prices haven’t made a new low in recent days, unlike the pause in January (where the price had a bearish bias within the range).

Natural Gas Daily Chart

image3.png

Given oversold conditions on higher timeframe charts, and improving upward momentum on lower timeframe charts, the recent price action could be a precursor to the start of an extended pause in the slide, or perhaps a minor rebound.

As the 240-minute chart shows, natural gas has been in a sideway range of 2.35-2.65 since the start of the month. Any break above the immediate barrier at 2.65-2.75 (including the Ichimoku cloud on the 240-minute charts) could pave the way toward the 200-period moving average (at about 3.20).

Gold Prices Turn to US CPI Report, Will Softer Inflation Rekindle XAU/USD?

Gold Prices Turn to US CPI Report, Will Softer Inflation Rekindle XAU/USD?

Gold prices sank about 0.6 percent on Monday, extending losses from last week. The anti-fiat yellow metal inversely tracked a boost to 2-year Treasury yields during the first half of the day. XAU/USD can be quite sensitive to the direction of US Treasury rates. That is because of gold’s inherent lack of return for holding the precious metal, compared to something that either pays a dividend or yield.

Over the past 24 hours, it seems traders were focused on a survey from the Federal Reserve Bank of New York on consumer anticipation. Specifically, median anticipated growth in household income was seen falling 1.3 percentage points to 3.3% as of January. But, respondents continue to see inflation elevated, unchanged at 5%. That would speak to deteriorating real incomes and more signs that people are feeling discouraged about beating inflation.

Markets rallied on the news, with the Dow Jones, S&P 500 and Nasdaq 100 finishing in the green. The tech sector outperformed. From this perspective, if people believe wage growth will slow, that could be another sign that further disinflation could be in store for the economy. Although, there could also be a debate about stagflation instead.

For gold, this matters because over the remaining 24 hours, January’s US CPI report will cross the wires. Headline inflation is seen slowing further to 6.2% y/y from 6.5%. For those interested, I created a model that tries to predict CPI using lag analysis. The model has a slight bias to a downward surprise. Such an outcome may further boost year-end Fed pivot bets. If that sends the US Dollar and bond yields lower, gold could be looking at a green day.

Gold Technical Analysis

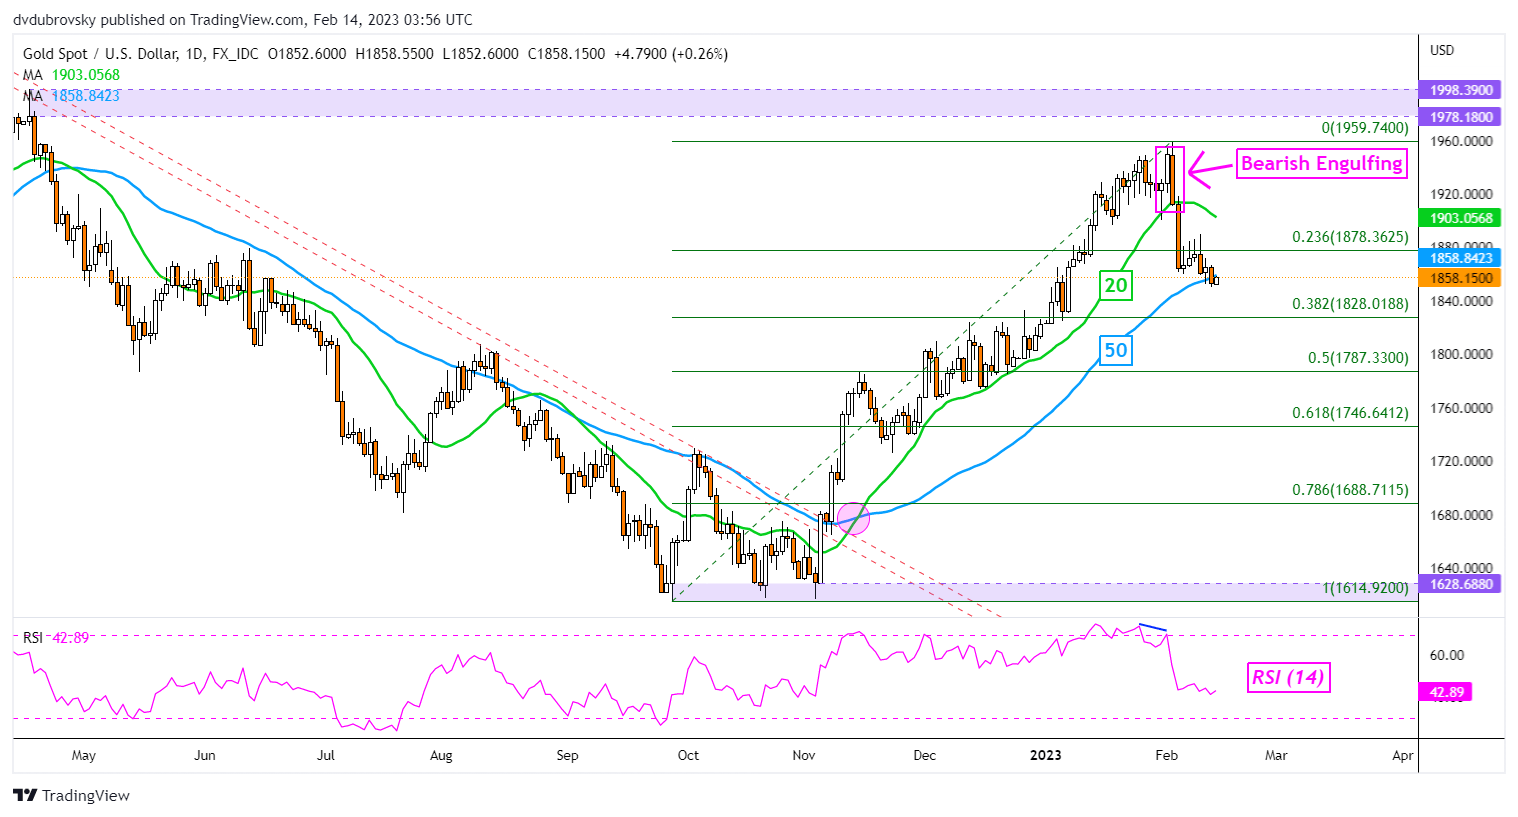
On the daily chart, gold broke under the 50-day Simple Moving Average. Confirmation is lacking at this moment, but further downside progress would open the door to extending a reversal of the uptrend from November. Otherwise, a turn higher places the focus on the 20-day SMA. The latter could hold as resistance, maintaining the near-term downside focus.

XAU/USD Daily Chart

XAU/USD Daily Chart

Gold Price Setup Ahead of US CPI: Bear Flag Hints at Further Downside

Gold Price Setup Ahead of US CPI: Bear Flag Hints at Further Downside

Gold Selloff Stagnates Ahead of Major Event Risk: US CPI

The weekly gold chart shows a marked slowdown in the gold selloff, particularly last week which produced a doji candle – representative of indecision in the market. Reluctance to push higher above the 1910 zone was evident via the multiple upper wicks on the weekly candles which ultimately resulted in a massive swing lower.

Gold (XAU/USD) Weekly Chart

image1.png

The daily chart shows the massive selloff which ensued the day after the FOMC which continued after a massive beat in US jobs data and stellar PMI ‘new orders’ data. The double hit of optimism caused a knock-on effect which resulted in more hawkish repricing in dollar-linked assets and gold was no different.

With the market bidding up the value of the dollar and US treasury yields – particularly the 2-year yield – gold became relatively less attractive as it does not provide a yield.

In the days that followed the massive selloff, gold prices produced what appears to be a bear flag, as bulls attempted to regain some lost ground. There is still a fair distance to go if we are to see this pattern fill out but a continued grind lower suggests a move towards the 200 simple moving average (SMA) at 1775 cannot be ruled out.

However, bears will have to push prices past the psychological 1800 level first. Risks to the bearish gold outlook appear in the form of US CPI at 13:30. If the rate of disinflation increases and we get a surprise to the downside, there may be another round of dollar repricing, but this time to the downside which could support gold in the short-term. Resistance lies at 1875, followed by 1910/1915.

Gold (XAU/USD) Daily Chart

image2.png

Euro Update: EUR/USD Holds Early Gains After EU GDP Release, US CPI Looms

Euro Update: EUR/USD Holds Early Gains After EU GDP Release, US CPI Looms

In the fourth quarter of 2022, seasonally adjusted GDP increased by 0.1% in the Euro Area and remained stable in the EU, compared with the previous quarter. In the third quarter of 2022, GDP grew by 0.3% in both the Euro Area and the EU, according to the official release published by Eurostat, the statistical office of the European Union.

image1.png

For all market-moving events and economic data releases, see the real-time DailyFX Calendar

The European Commission’s Winter Economic Forecast, released yesterday, said that the EU economy is set to avoid recession but ‘headwinds persist’. The Winter interim Forecast’s projected growth for 2023 of 0.8% in the EU and 0.9% in the euro area is respectively 0.5% and 0.6% higher than in the Autumn Forecast. In further positive news, the inflation forecast was revised lower. Headline inflation is forecast to fall from 9.2% in 2022 to 6.4% in 2023 and to 2.8% in 2024 in the EU. In the euro area, it is projected to decelerate from 8.4% in 2022 to 5.6% in 2023 and to 2.5% in 2024.

The Euro kept its earlier gains against a marginally weaker US dollar with EUR/USD changing hands around 1.0760. The latest US inflation report, scheduled to be released at 13:30 GMT, will be the next driver of price action across a swathe of markets and may shed some more light on the path of US rates in the months ahead. Both annualized core and headline inflation are set to ease but any deviation from current market expectations will likely prompt a bout of volatility.

image2.png

EUR/USD Daily Price Chart – February 14, 2023

image3.png

Crude Oil Price Forecast: Brent Bid Ahead of OPEC Report and US CPI

Crude Oil Price Forecast: Brent Bid Ahead of OPEC Report and US CPI

Brent crude oil is bid this morning finding support from a weaker U.S. dollar which will likely be the main driver of market pricing today. From a crude oil perspective, OPEC is scheduled to release its monthly market report later today that which will include their outlook for the market and it will be interesting to see whether significant revisions are made to demand/supply forecasts. Ending of the trading day the API weekly crude oil report will come into focus and another decline as seen last week could give oil prices a boost.

That being said, the primary theme for today will come via the U.S. CPI release that is expected to come in slightly softer; however, many market analysts and Fed officials have noted the rate of decline has not been as significant as projected which leads me to believe anything in line or above estimates could result in a hawkish slant to the data leaving crude oil prices exposed to the downside. Post-release, Fed speakers are programmed and it will be interesting to see their reaction to the inflation data.

U.S. ECONOMIC CALENDAR


image1.png

TECHNICAL ANALYSIS

BRENT CRUDE DAILY CHART

image2.png

Chart prepared by Warren Venketas, IG

Daily Brent crude oil price action is trading marginally below the psychological $80/barrel resistance handle with caution being exercised by market participants shown via the Relative Strength Index (RSI) reading. Sandwiched between the 50-day SMA (yellow) and the medium-term trendline support (black), the aforementioned fundamental catalysts could drive market volatility to test one of these key zones and potentially break free from the recent rangebound pattern.

Key resistance levels:

  • Trendline resistance
  • 80.00

Key support levels:

  • 50-day SMA
  • 76.69

IG CLIENT SENTIMENT: MIXED

IGCS shows retail traders are NET LONG on crude oil, with 68% of traders currently holding long positions (as of this writing). At DailyFX we typically take a contrarian view to crowd sentiment however, due to recent changes in long and short positioning we arrive at a short-term watchful disposition.

Breaking News: GBP/USD Bounces as UK Unemployment Rate Holds Firm

Breaking News: GBP/USD Bounces as UK Unemployment Rate Holds Firm

The UK unemployment rate remained unchanged for the 3 months to December 2022, in line with expectations. The number of people unemployed for up to six months increased, driven by people aged 16 to 24 years. The number of people in work in the UK rose by 74K in the three months to December, well-above market forecasts of a 40K increase and following a 27K rise in the previous month. Meanwhile, in November 2022 to January 2023, job vacancies fell by 76K to 1,134K, the seventh consecutive quarterly fall, reflecting uncertainty across industries, as survey respondents continue to cite economic pressures as a factor in holding back on recruitment. UK Chancellor Hunt meanwhile commented that unemployment remaining close to record lows is an encouraging sign of resilience in our labor market.

Graphical user interface, text, application, email  Description automatically generated

AVERAGE EARNINGS INCL. and EXCL. BONUS

The wages in the United Kingdom increased 5.9% in December of 2022 over the same month in the previous year beating estimates and down from the previous print of 6.4%. The worry however will be in the rise of average earnings excluding bonuses which increased to 6.7% beating forecast of 6.5%. Figures compare with market forecasts of a 6.2% and 6.5% rise, respectively. In real terms (adjusted for inflation), growth in total and regular pay fell on the year in October to December 2022, by 3.1% for total pay and by 2.5 for regular pay. This is smaller than the record fall in real total pay we saw in February to April 2009 (4.5%), remains among the largest falls in growth since comparable records began in 2001. Wage growth has remained a sticking point for the Bank of England and a key contributor to inflation.

UK LABOR MARKET MOVING FORWARD

The IMF warned that the UK is yet to absorb as many people back into employment as it had before the pandemic in March 2020. Despite the positive data out today this seems set to continue with BDO (accountancy and business advisory firm) releasing its monthly business trends report which indicated UK businesses plan to hire less but pay more for those they need. The report further indicated that UK businesses plan to recover these costs by raising prices which is something that will worry the Bank of England as it looks to tame inflation.

The Bank of England has made its feelings known in regard to the labor market and will be closely monitoring its decision maker panel (a survey of business), with the next instalment due on March 2. This forward-looking gauge on potential wage and price pressures will provide a picture of what to expect in the months ahead.

MARKET REACTION

The initial market reaction following the news has seen GBPUSD jump 25 pips to trade at 1.21650. Looking at the bigger picture from a technical perspective, GBPUSD price pushed higher yesterday back toward the 50-day MA. We remain between the 200 and 50-day MAs with a break above the 50-day MA likely to face resistance at the 1.2270 area, the lower end of the range breakout from February 2. A potential downside break must contend with the psychological 1.2000 handle as well as the 200 and 100-day MA if it is to make a significant push to the downside. At this stage the technicals aren’t giving much away with a breakout in either direction a possibility.

Chart  Description automatically generated

Australia’s Top Central Banker to Face Lawmaker Ire Over Rate Hikes

Australia’s Top Central Banker to Face Lawmaker Ire Over Rate Hikes

SYDNEY (Reuters) – Australia’s top central banker will face a grilling at parliamentary hearings this week after surprising many with a hawkish turn on interest rate hikes that are adding to already punishing cost of living pressures.

Reserve Bank of Australia (RBA) Governor Philip Lowe appears before lawmakers on Wednesday and Friday for hearings into its anti-inflation campaign, which has seen interest rates rise an eye-watering 325 basis points in just 10 months.

After the latest rise last week, the central bank compounded the blow by flagging yet further increases would be needed to contain inflation, which is running at three-decade highs.

Lowe did himself no favours with the media by attending a private lunch of bankers before making any public appearance on the policy shift.

The controversy added to media speculation Lowe might not be re-appointed for a second term as governor as the government weighs its response to an independent inquiry into the central bank’s governance and policy record.

Australian Treasurer Jim Chalmers highlighted the broader issue in the review about how the bank communicates the context for its decisions on Sunday.

“This is one of the things that I’ve been discussing with the RBA Review panel….How they communicate their decisions and the context behind their decisions is one of the key focuses of that,” Chalmers said on ABC Television.

Chalmers said he would receive the review on March 31, and the government would make a decision about Lowe’s re-appointment towards mid-year.

The review, announced by Chalmers in July, is assessing issues such as how the RBA communicates with the public and which inflation targets to follow.

It comes after the RBA undershot its inflation target of 2% to 3% for much of the last decade and issued guidance during the COVID-19 pandemic that rates were not expected to rise until at least 2024.

Now, consumer price inflation is running at a 32-year high of 7.8% and is only projected to return to the top of the bank’s target range of 2% to 3% by mid-2025.

Fighting the Last Bull & Bear Market

Fighting the Last Bull & Bear Market

The bull market piece about ARK came out a little more than a year ago not long after the fund had seen spectacular returns. The bear market piece about covered calls came out this past week after that strategy outperformed last year.

The details from each piece do a nice job of explaining the psychology behind what happens following both good markets and bad markets.

Not every investor does this but there is a tendency to invest money into the speculative stuff only after it rockets higher during a bull market and invest money into the defensive stuff only after it protects capital during a bear market.

Here’s Zweig on how ARK’s performance impacted flows following the massive returns the fund experienced in 2020 and 2021:

In its first two full years, 2015 and 2016, ARK Innovation gained less than 2% cumulatively. Then it took off, rising 87% in 2017, 4% in 2018, 36% in 2019 and 157% in 2020.

Yet, at the end of 2016, the fund had only $12 million in assets—so its titanic 87% gain in 2017 was earned by a tiny number of investors. By the end of 2018 ARK Innovation had only $1.1 billion in assets; a year later it still had just $1.9 billion.

Only in 2020 did investors begin buying big-time. The fund’s assets tripled to $6 billion between March and July 2020. From September 2020 through March 2021, estimates Morningstar, investors deluged ARK Innovation with $13 billion in new money.

Right on cue, performance peaked.

In other words, the performance was magnificent, then tons of money poured in at an unbelievable pace, then the performance was terrible.

Unfortunately, this tends to happen to style-hopping investors.

The market or some investment strategy goes up a lot and you invest in that thing that did really well in hopes that it can have a repeat performance.

Or the market goes down a lot and you invest in the thing that did really well in hopes that it can protect you once again.

Here’s Zweig again on the money flowing into covered call strategies, which softened the blow of the bear market in 2022:

Last year, JPMorgan Equity Premium Income ETF lost 3.5%—far outperforming the dismal 18.1% decline in the S&P 500. As technology stocks tanked, the Global X Nasdaq 100 Covered Call ETF lost 19%—much less than the 32% dive in the Nasdaq index itself.

The prospect of getting most of the market’s upside, less of the downside and big steady dividends along the way sounds like an investing paradise.

No wonder the JPMorgan fund took in $12.9 billion in new money last year—the biggest annual haul for any actively managed ETF ever. Three covered-call funds from Global X, linked to the Nasdaq-100, S&P 500 and Russell 2000 indexes respectively, attracted a combined $5.2 billion in 2022. So far in 2023, approximately $3 billion more has flowed into these four funds alone.

Following the 2008 financial crisis and market crash, I sat through dozens and dozens of investment presentations from funds pitching the next big short or Black Swan protection.

Everyone was so concerned with fighting the last war that they missed the fact that the stock market had fallen nearly 60%. The real opportunity was the big long, not the big short.

I’m not saying either of these strategies are good, bad or otherwise. It all depends on what you’re looking for as an investor.

There can be a place for a high-octane strategy in your portfolio or an income-seeking strategy that looks to dampen volatility.

The problem is it’s not a great idea to chase the high-octane strategy only after it goes to the moon. It’s also not a great idea to switch over to the volatility dampener only after the bear market has already mauled your portfolio.

If your investment strategy relies on constantly putting your money into strategies you wish you would have invested in prior to a big move in the market you’re always going to be playing from behind.

There’s a reason it’s buy low, sell high and not the other way around.

I’m sure there are investors out there who can consistently move from one investment style to the next. I don’t know any of them but they have to exist.

For those of us who aren’t the next Jim Simons, it’s much easier to pick a reasonable strategy and stick with it come hell or high water.

Sticking with a long-term investment strategy isn’t very sexy but it gives you a much higher probability of success rather than trying to pick the thing that’s going to work in the next market environment.

If your strategy consists of buying what you wish you would have bought before it performed really well that’s a recipe for disaster.

US dollar hangs near 5-week high as inflation data looms; yen slips

US dollar hangs near 5-week high as inflation data looms; yen slips

TOKYO : The dollar edged toward a five-week high versus major peers on Monday as investors increased bets on the Federal Reserve keeping monetary policy tight for longer, while waiting for a U.S. consumer price report set for release the next day.

The yen tumbled, with the Japanese government set to nominate a candidate who backs the current policy settings as the new central bank governor on Tuesday.

The risk-sensitive Australian and New Zealand dollars eased with Asian equities on worries that higher U.S. rates will choke growth. Sterling also dipped.

“The dollar has been well supported since the much-stronger-than-expected U.S. jobs data earlier this month, and Fed comments have leaned more to the hawkish side, but of course the focus is tomorrow’s CPI,” said Shinichiro Kadota, senior FX strategist at Barclays in Tokyo.

“I think the market is more worried about upside risks to inflation, rather than downside risks.”

Ahead of Tuesday’s CPI report, revisions to the previous data set showed consumer prices rose in December instead of falling as previously estimated.

Separately, the University of Michigan surveys showed a one-year inflation outlook of 4.2 per cent, higher than the final number in January. Fed Chair Jerome Powell has cited the Michigan survey as one of the indicators the U.S. central bank tracks.

Money markets are positioned for a peak in U.S. interest rates of just below 5.2 per cent around July, compared with the current target rate of 4.5-4.75 per cent.

The dollar index – which measures the greenback against six counterparts including the yen, euro and sterling – added 0.068 per cent to 103.65, keeping close to last Tuesday’s high of 103.96, the strongest level since Jan. 6.

The U.S. currency rallied 0.6 per cent to as high as 132.20 yen.

Sources said on Friday that former Bank of Japan board member Kazuo Ueda is set to become the next governor. In an interview the same day, Ueda said it was appropriate for the BOJ to maintain its current ultra-easy policy.

“Markets are starting to understand that the new governor won’t be as hawkish as (investors) initially thought,” said Naka Matsuzawa, chief strategist at Nomura in Tokyo.

“His stance on the current policy is more balanced, or a bit dovish,” which will keep the yen weak, Matsuzawa said.

The euro eased 0.09 per cent to $1.06685, and earlier touched $1.0656 for the first time since Jan. 9. Sterling was last trading at $1.20475, down 0.1 per cent on the day.

The Aussie fell 0.09 per cent to $0.6912, and New Zealand’s kiwi lost 0.11 per cent to $0.6304.