image1.png

Japanese Yen Strengthens Against US Dollar and Euro. Where to for EUR/USD and EUR/JPY?

USD/JPY TECHNICAL ANALYSIS

After breaking below the Ichimoku Cloud, USD/JPY bearishness unfolded as it pressed to a 3-month low on Friday at 133.63. That level might provide support in the near term.

Further down there is a cluster of previous lows and breakpoints that may provide support at 131.74, 131.50, 131.35, 131.25 and 130.40.

Under there, the 260-day Simple Moving Average (SMA) is currently at 130.00 and could be a level to watch.

The move lower on Friday also saw the price go below the 200-day SMA. It is now below all SMAs of less than 200-days and this may indicate that bearish momentum is possibly evolving.

Support could be at the previous lows of 137.67 and 135.81 or at the breakpoint of 135.57.

Previous support levels that have been broken might now offer breakpoint resistance at 135.81, 137.50 and 136.67.

Further up, resistance could be at the previous peaks of 139.90 and 142.25.
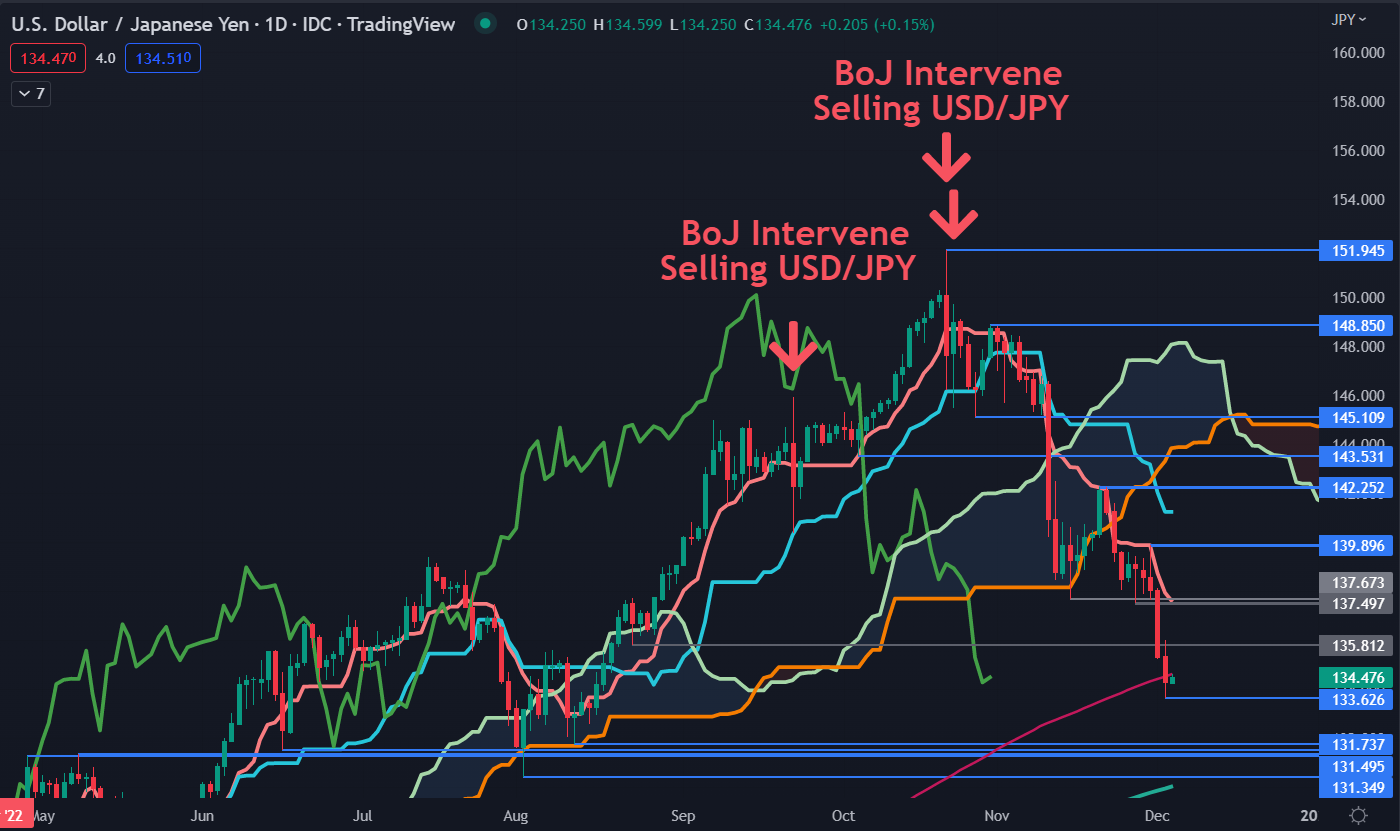
image1.png

EUR/JPY TECHNICAL ANALYSIS

EUR/JPY tumbled to a 2-month low on Friday but was unable to sustain the move under a previous low at 140.90 when it touched 140.77. These levels might provide support.

That look lower was also unable to penetrate an ascending trend line and it too may provide support, currently intersecting at 141.00.

The close on Friday was at 141.53 which was below the lower band of the 21-day Simple Moving Average (SMA) based Bollinger Band at 141.92 at the time. A close back inside the band could signal a pause in bearishness or a potential reversal.

The price is currently below all SMAs 100-days or less but remains above the 200- and 260-days SMAs. This might indicate that short and medium-term momentum could be bearish but that underlying longer-term momentum is yet to confirm this.

Support may lie at the previous lows of 137.37, 134.95 and 133.40. On the topside, resistance might be offered at the breakpoint of 142.56 or the prior peaks at 146.14, 147.11, 147.72 and 148.40.

Resistance could also be offered at the December 2014 peak of 149.79. Beyond there, a series of Fibonacci Extension levels may offer resistance at 150.73, 151.00 and 152.04.
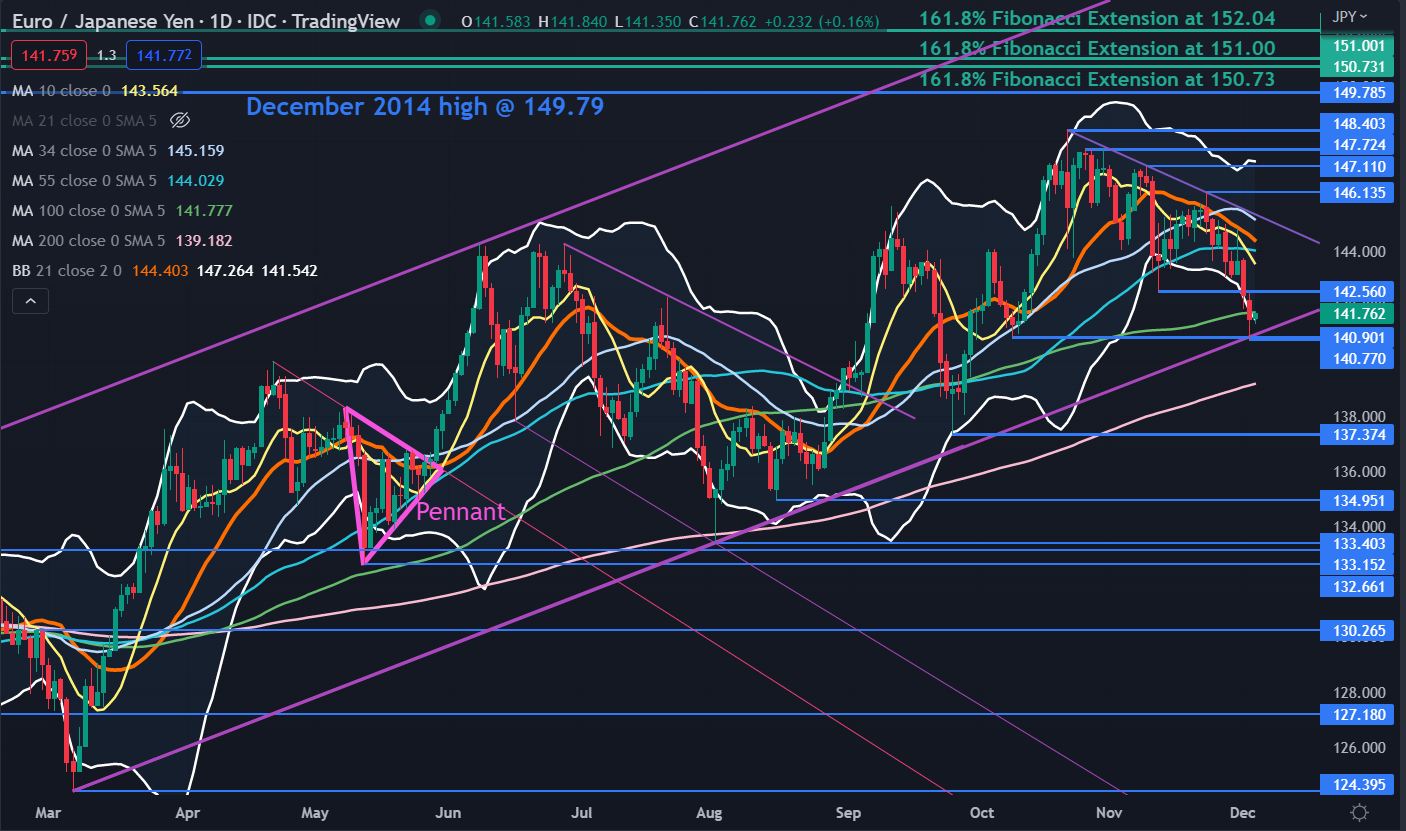
image2.png


You Think The US Labor Market Is Hot? Think Again

Quick reminder: from January 1st, getting access to this content (and much more!) will require a paid subscription.

The exclusive offer to get in by paying 9 months instead of 12 runs until December 10 (only 6 days left), and spots are limited.

If you find value in these macro strategy pieces, you are going to love the enhanced TMC products in 2023 – check out which subscription tier suits you the most and take advantage of this exclusive offer!

The Labor Market Holds The Key

Especially at turning points, looking beyond the main headlines in macro data can make the difference in understanding where do we really stand in the macro cycle.

The last US payroll report was tagged as very strong – but if you look deeper you realize the current state of the US labor market is far from ‘‘hot’’.

Job creation is clearly trending down, alternative real-time and forward-looking labor market indicators point to a sharp deterioration ahead and statistical inconsistencies are artificially boosting non-farm payrolls to the point the US government reached out to ask if I could help them look into it.

The labor market holds the key to the Fed reaction function in 2023, and hence it will be a crucial driver of asset classes performance – calling it right can make the difference for portfolios next year.

No OPEC+ oil shakeup as Russian price cap stirs uncertainty

. The Saudi-led OPEC oil cartel and allied producing countries, including Russia, are scheduled to decide how much oil to supply to the global economy amid weakening demand in China and uncertainty about the impact of new Western sanctions against Russia that could take significant amounts of oil off the market.

FRANKFURT, Germany (AP) — The Saudi-led OPEC oil cartel and allied producers including Russia did not change their targets for shipping oil to the global economy amid uncertainty about the impact of new Western sanctions against Russia that could take significant amounts of oil off the market.

The decision at a meeting of oil ministers Sunday comes a day ahead of the planned start of two measures aimed at hitting Russia’s oil earnings in response to its invasion of Ukraine. Those are: a European Union boycott of most Russian oil and a price cap of $60 per barrel on Russian exports imposed by the EU and the Group of Seven democracies.

It is not yet clear how much Russian oil the two sanctions measures could take off the global market, which would tighten supply and drive up prices. The world’s No. 2 oil producer has been able to reroute much, but not all, of its former Europe shipments to customers in India, China and Turkey.

The impact of the price cap is also up in the air because Russia has said it could simply halt deliveries to countries that observe the limit. But analysts say the country would likely also find ways to evade the cap for some shipments.

On the other side, oil has been trading at lower prices on fears that coronavirus outbreaks and China’s strict zero-COVID restrictions would reduce demand for fuel in one of the world’s major economies. Concerns about recessions in the U.S. and Europe also raise the prospect of lower demand for gasoline and other fuel made from crude.

Manufacturing orders from China down 40% in unrelenting demand collapse

U.S. logistic managers are bracing for delays in the delivery of goods from China in early January as a result of canceled sailings of container ships and rollovers of exports by ocean carriers.

Carriers have been executing on an active capacity management strategy by announcing more blank sailings and suspending services to balance supply with demand. “The unrelenting decline in container freight rates from Asia, caused by a collapse in demand, is compelling ocean carriers to blank more sailings than ever before as vessel utilization hits new lows,” said Joe Monaghan, CEO of Worldwide Logistics Group.

U.S. manufacturing orders in China are down 40 percent, according to the latest CNBC Supply Chain Heat Map data. As a result of the decrease in orders, Worldwide Logistics tells CNBC it is expecting Chinese factories to shut down two weeks earlier than usual for the Chinese Lunar New Year — Chinese New Year’s Eve falls on Jan. 21 next year. The seven days after the holiday are considered a national holiday.

“Many of the manufacturers will be closed in early January for the holiday, which is much earlier than last year,” Monaghan said.

Supply chain research firm Project44 tells CNBC that after reaching record-breaking levels of trade during the pandemic lockdowns, vessel TEU (twenty-foot equivalent unit) volume from China to the U.S. has significantly pulled back since the end of summer 2022 — including a decline of 21% in total vessel container volume between August and November.

Asia-based global shipping firm HLS warned clients in a recent communication about the ocean transport business climate.

?It seems to be a very bad time for the shipping industry. We have the combination of declining demands and overcapacity as new tonnage enters the market,” it wrote.

HLS analysts are predicting a further 2.5% decline in container volumes and a nearly 5-6% increase in capacity in 2023, which will continue to negatively impact freight rates in 2023.

“The container shipping market will be further complicated by economic uncertainty, geopolitical concerns, and also the increasingly heated market competition,” HLS wrote.

OL USA CEO Alan Baer tells CNBC that there are some early signs of an inventory correction. Overall business volume and order flow out of Asia continue to be muted as carriers cancel more vessels, and there is little upside momentum leading into Chinese New Year. But Baer said, “Space has already tightened, so while demand is soft, space may be at a premium in January and throughout Q1. On the plus side, inventory depletion and the need to restart the order and delivery cycle appears to be inching upward.”

U.S. West Coast ports take biggest hit

HLS cited trade data showing that U.S. imports from Asia plunged in October to their lowest level in 20 months. The spot rate for a container from Asia to the U.S. West Coast has crossed the breakeven point, “with little room for further reductions,” it wrote.

The large West Coast ports of Los Angeles and Long Beach have experienced the largest drop in trade, according to Josh Brazil, vice president of supply chain insights at Project44, as shippers also rerouted some of their shipments to the East Coast to avoid the risk of a major union strike at West Coast ports.

image1.png

Crude Oil Forecast: EU Sets Russian Oil Price Cap at $60, OPEC+ Unchanged

BRENT CRUDE OIL FUNDAMENTAL BACKDROP

Brent crude oil has already seen some significant price action this Monday after OPEC+ met and concluded that production will remain at prior output levels. The decision came in the midst of other fundamental factors including China’s easing of COVID restrictions as well as the EU’s price cap on Russian oil. G7 nations settled on a $60 per barrel figure on seaborne Russian oil and countries who wish to purchase above this threshold can do so without the Western services such as insurance and transport. Russia in turn stated that they would not be accepting of the price cap which could bring into question future supply that may boost the price of crude oil worldwide.

CFTC BRENT CRUDE OIL POSITIONING:


image1.png

Source: Refinitiv

CFTC data shown above reveals another decline in long positioning for Brent crude oil but the prospect of supply cuts from Russia has propped up crude oil prices. From a dollar perspective, last week’s better than expected Non-Farm Payrolls (NFP) data has not translated through to this week with the greenback trading marginally weaker as focus shifts to U.S. ISM services PMI numbers (see economic calendar below). Services statistics carries more weight over manufacturing in the U.S. as the economy is more reliant on the services industry.

ECONOMIC CALENDAR

image2.png

TECHNICAL ANALYSIS

BRENT CRUDE (LCOc1) DAILY CHART -UNDATED

image3.png

Chart prepared by Warren Venketas, IG

Daily Brent crude price action reveals a long upper wick at present but the rest of the day will confirm whether this candlestick persists which will bring into consideration the 85.00 support handle. Fundamentally, supply concerns could be pointing to higher prices but markets will remain wary until there is further clarity around Russia’s reaction function.

Key resistance levels:

  • 87.28

Key support levels:

  • 85.00

IG CLIENT SENTIMENT: MIXED

IGCS shows retail traders are NET LONG on crude oil, with 73% of traders currently holding long positions (as of this writing). At DailyFX we typically take a contrarian view to crowd sentiment but due to recent changes in long and short positioning we arrive at a short-term cautious bias.

image1.png

Euro Hits a High Note Amid China Re-opening Hopes and OPEC+. Where to for EUR/USD?

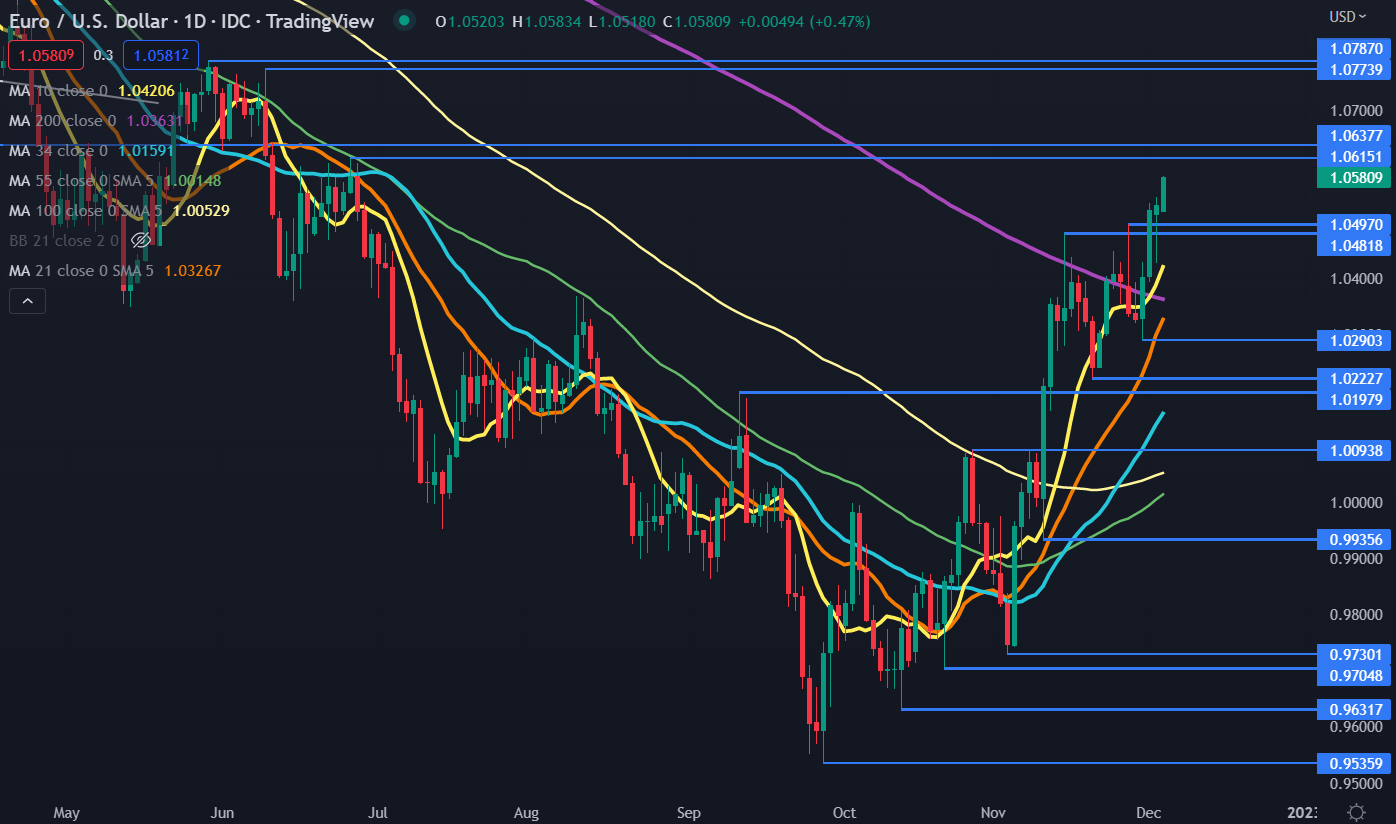
EUR/USD made a 5-month high in the Asian session today as the US Dollar is again under pressure. Several macro developments have contributed to the buoyant, risk-on mood to start the week.

The market is still digesting US jobs data from Friday and the implications it may have for the Federal Reserve at their Federal Open Market Committee (FOMC) meeting come December 14th. The 263k change in non-farm payrolls for November was well above the 200k forecast.

Then, over the weekend, OPEC+ held a meeting and agreed not to deepen production cuts that have previously been announced.

Crude oil is consequently higher with the WTI futures trading as high as US$ 81.84 bbl while the Brent contract touched US$ 87.60 bbl. Both contracts have now pulled back lower going into the European day.

G-7 and EU restrictions on Russian oil exports come into effect today.

China eased travel restrictions across several major cities on Monday, raising hopes of a Covid-19 policy pivot for the world’s second-largest economy.

Hong Kong’s Hang Seng Index (HSI) led the way higher for Asian equity markets, adding more than 3%. Any market related to a re-opening has rallied hard.

Casino shares are generally up over 10% while base metals and related stocks are much higher. Iron ore and copper helped to boost the Aussie Dollar. The latter is seen as having significant exposure to Chinese growth prospects.

Gold also gained on the weaker US Dollar and broad demand for metals, trading above US$1,800 an ounce.

After a stack of European PMIs today, the US will see factory and durable goods orders data. The RBA will be deciding on cash rates tomorrow.

EUR/USD has moved above all period simple moving averages (SMA) and this might indicate that bullish momentum may continue to evolve.

Resistance could be at the breakpoint of 1.0638 or the previous peaks of 1.0615, 1.0774 and 1.0787.

On the downside, support may lie at the breakpoints of 1.0497 and 1.0482 or the prior lows of 1.0290 and 1.0223.

image1.png


20221206rbnzOCR

The consensus is for the RBA to hike by 25bp tomorrow

What has happened since the last RBA meeting?

  • 10th November: Australia’s central bank says nearer to point when it can wait on rates (Reuters)
  • CPI fell to 6.9% y/y, down from 7.4% and beneath the 7.5% – suggesting inflation has peaked
  • Governor Lowe reiterated his belief that the economy can have a soft landing
  • PMI’s continued south, business sentiment has been flat
  • Consumer inflation expectations hit a record high according to one survey
  • OIS curve is pointing lower as the case for a higher terminal rate diminishes

20221206rbnzOCR

The RBA’s cash rate currently sits at 2.85%, after hiking rates for a record seven consecutive meetings totalling 275bp. And despite being a late starter compared to the RBNZ, Fed and pretty much everyone – the RBA continue to believe the terminal rate will remain lower than their peers. For comparison, RBNZ have an OCR of 4.25% and expected to rise to at least 4.5%, yet a recent poll suggests the RBA’s terminal rate will be around 3.6% next year.

I expect the RBA to hike rates for a record eight consecutive meeting tomorrow by 25bp. With that said, we shouldn’t discount the potential for a hold – which I’m sure consumers would love. Yet they’re more likely to hike to 3.1% as they do not meet again until February, so technically January is kind of a pause. But the case for a pause is certainly building. Some measures of inflation expectations are moving lower, and the monthly inflation print suggests inflation has peaked at 7.4% y/y – as it fell to 6.9%, compared with 7.5% expected. All 30 economists polled by Reuters expect the RBA to hike by 25bp tomorrow, however money markets currently estimate just a 56% probability – which means there’s a 44% chance that they will pause.

20221206iflationexpectations

AUD/USD 4-hour chart:

The symmetrical triangle breakout on AUD/USD remains in play on the 4-hour chart, and prices pulled back into a support cluster following Friday’s NFP report. Next target for bulls to consider remains 69c, so we’re hoping prices can now remain above Friday’s low and revert higher.

20221206audusdCI 


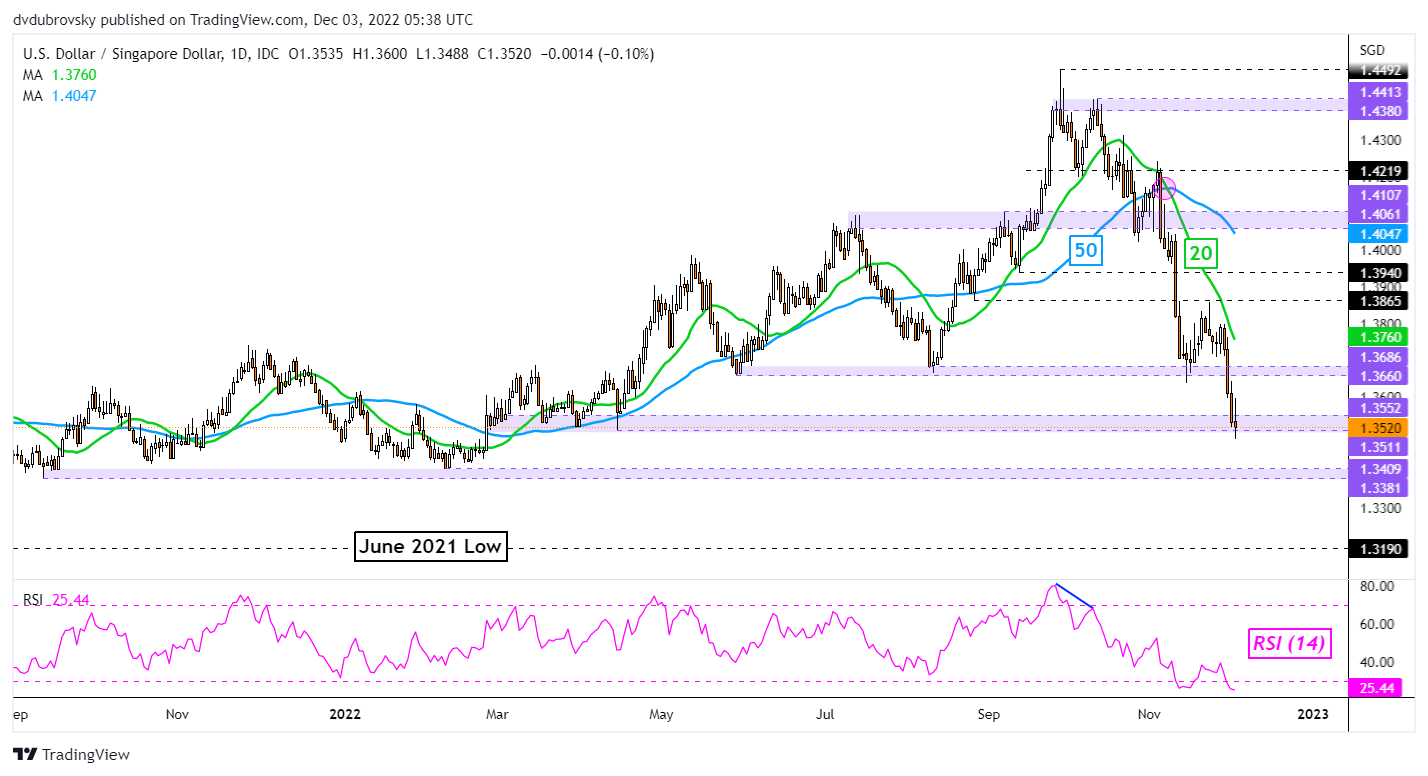
USD/SGD Daily Chart

US Dollar Technical Outlook Remains Grim: USD/SGD, USD/IDR, USD/PHP, USD/THB

Singapore Dollar Technical Outlook – Bullish

The Singapore Dollar extended its advance against the US Dollar last week. In November, USD/SGD sank 3.84%. That was the best performance for SGD since March 2016. Where does this leave the pair heading into the new week? Keep a close eye on the 1.3511 – 1.3552 support zone. A confirmatory downside breakout would open the door to extending the downtrend, exposing lows from September 2021. In the event of a turn higher, keep a close eye on the 20-day Simple Moving Average (SMA). This could reinstate the downside focus.

USD/SGD Daily Chart

USD/SGD Daily Chart

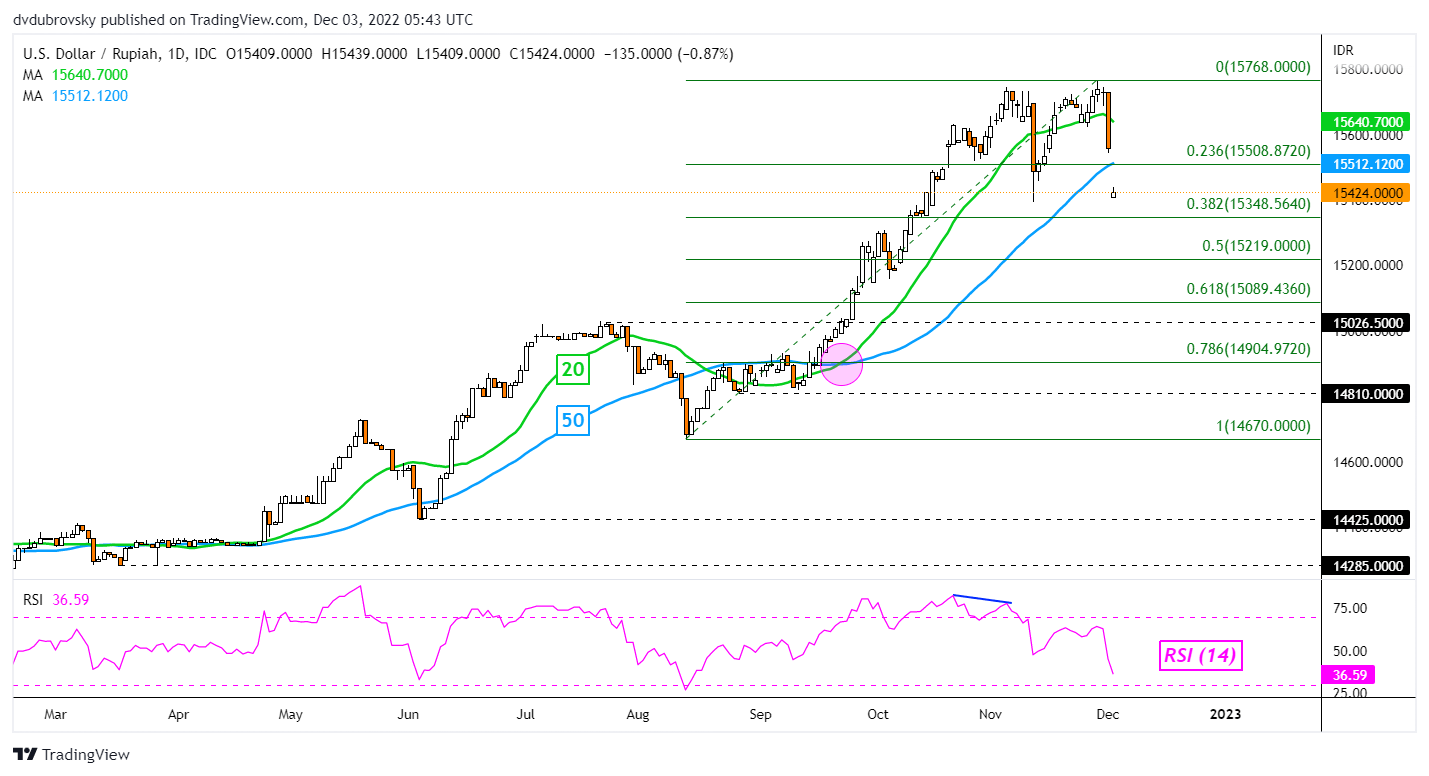
Indonesian Rupiah Technical Outlook – Bullish

The US Dollar also weakened against the Indonesian Rupiah, sending USD/IDR down 1.57% last week. That was the worst 5-day period since November 2020. Moreover, the pair broke under the 50-day SMA, opening the door to an increasingly downside bias ahead. Keep a close eye on the 20-day SMA, it could cross under the 50, creating a bearish Death Cross. Immediate support is the 38.2% Fibonacci retracement level at 15348. Further losses would expose the midpoint of the retracement at 15219. In the event of a turn higher, a push above the 23.6% level at 15508 would place the focus on the November high at 15768.

USD/IDR Daily Chart

USD/IDR Daily Chart

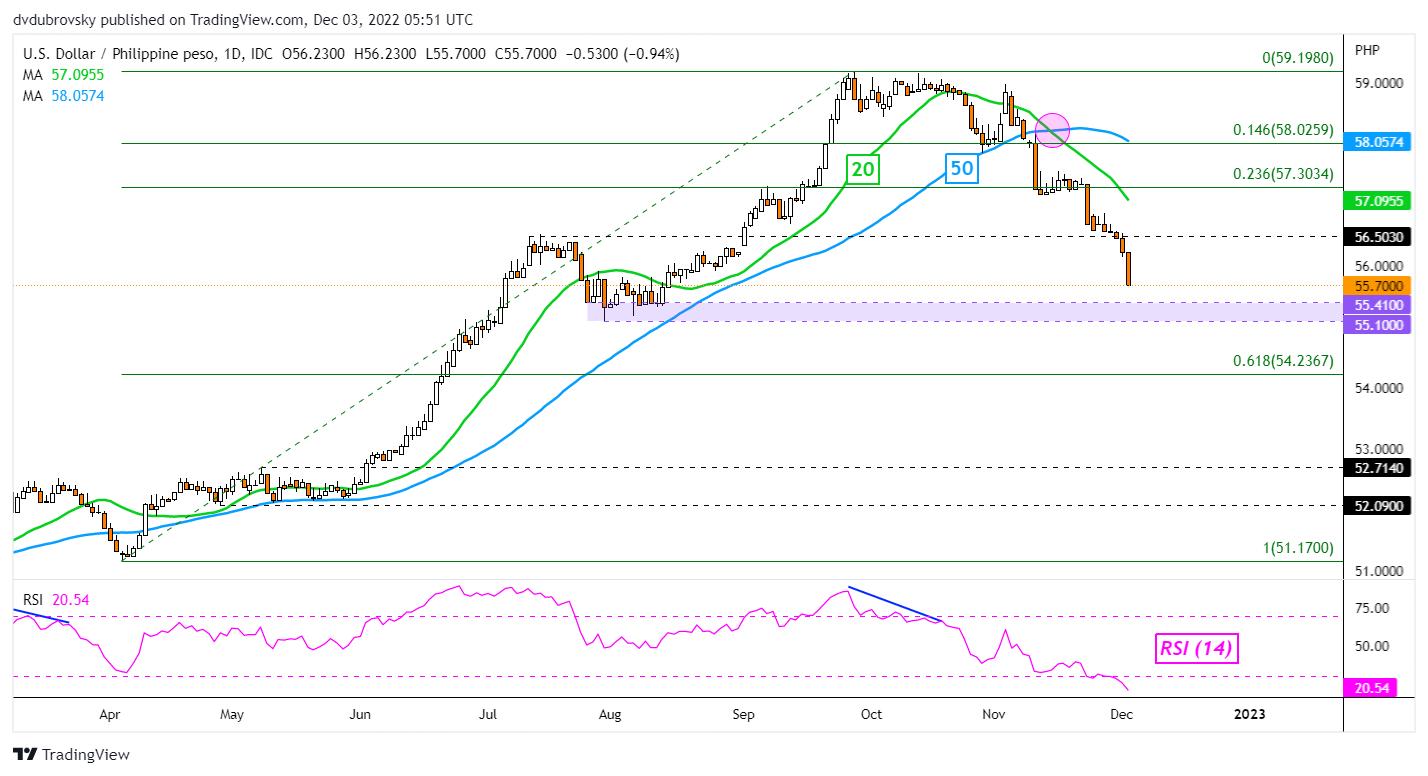
Philippine Peso Technical Outlook – Bullish

The US Dollar is also quickly losing its upside progress earned earlier this year against the Philippine Peso. USD/PHP fell 2.77% in November, the worst month since March 2016. This has left USD/PHP facing August lows, making for a key zone of support between 55.10 and 55.41. This might be tricky to clear, but doing so would offer an increasingly bullish outlook for PHP, exposing the 61.8% Fibonacci retracement level at 54.236. In the event of a turn higher, key resistance could be the 56.503 inflection point before the 20-day SMA comes into focus.

 USD/PHP Daily Chart

USD/PHP Daily Chart

Thai Baht Technical Outlook – Bullish

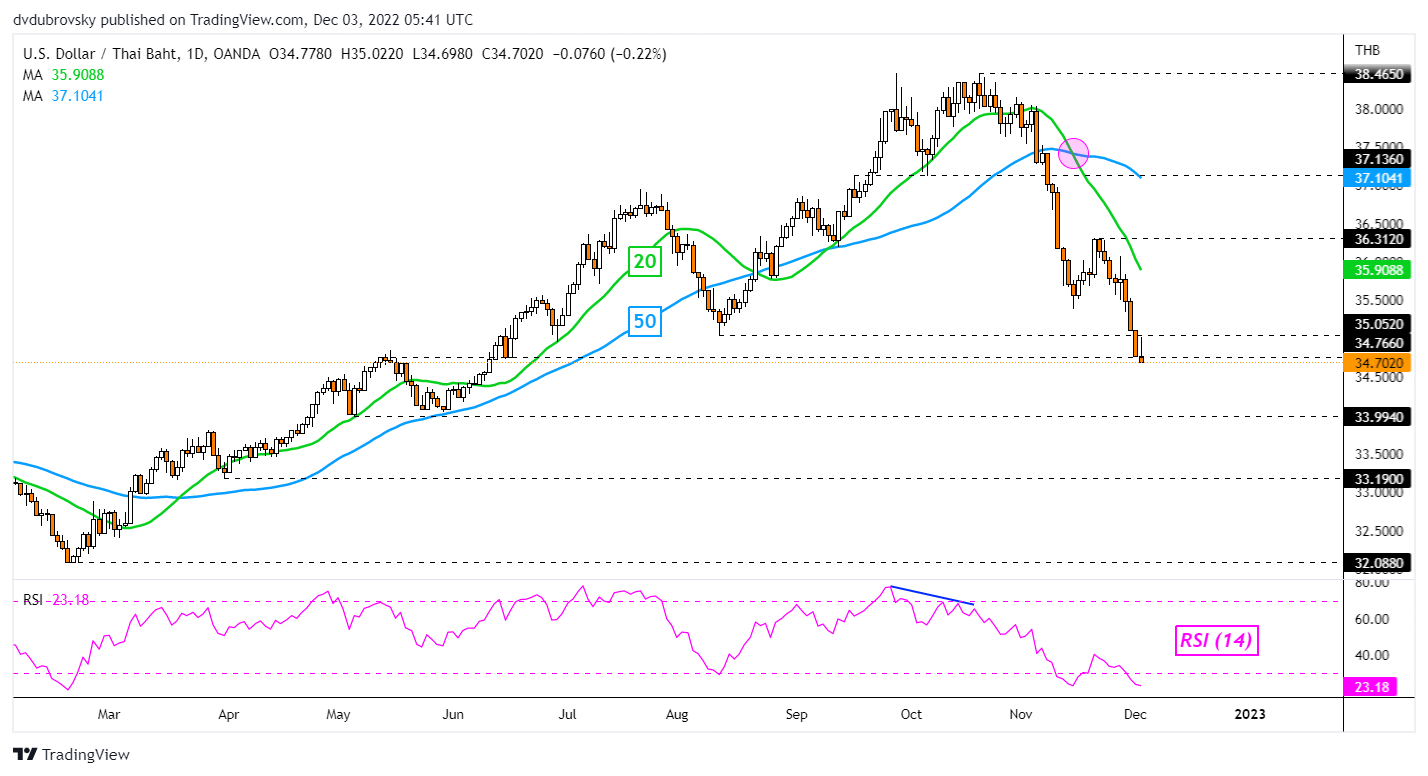
The US Dollar is also quickly losing ground against the Thai Baht, with USD/THB sinking 7.63% in November. That was the worst month since March 1998! Heading into the new week, USD/THB is facing the May low at 33.994. In the event of a turn higher, key resistance could be the 35.052 inflection point. Beyond that the 20-day SMA would likely quickly follow, offering an opportunity to maintain the dominant downside focus.

USD/THB Daily Chart

USD/THB Daily Chart


USDCAD steps on 20-SMA; bears still present

USDCAD had a lukewarm start to December, barely gaining bullish traction despite taking support from the 20-day simple moving average (SMA) at 1.3394.

The pair has completed two consecutive negative months, charting a bearish head and shoulders pattern around the 29-month peak of 1.3976. Even though the bulls attempted to deactivate the bearish structure above the 1.3500 neckline this week, the 50-day simple moving average (SMA) pressed the price aggressively lower, keeping negative trend risks alive.

In momentum indicators, the RSI and the MACD have been trending up since mid-November, but the former has yet to climb successfully above its 50 neutral mark, while the latter hasn’t exited the negative zone.

Nevertheless, there are a couple of support levels that may prevent an outlook deterioration. The upper constraining line from August 2021 might immediately attract attention around 1.3330 if the 20-day SMA at 1.3400 gives way. Then, the 38.2% Fibonacci retracement of the 1.2006-1.3976 at 1.3222 could defend the neutral trajectory in the short-term picture. Should selling forces persist, the tentative ascending trendline could next come to the rescue near 1.3120. Otherwise, the decline may stretch towards the 200-day SMA and the 50% Fibonacci of 1.2990.

On the upside, the 1.3500–1.3565 zone and the 50-day SMA will be closely watched. A sustainable move above the bar could bolster the bullish action up to the 1.3745–1.3800 resistance region. Running higher, the pair will push for new higher highs above the 1.3976 top.

In brief, USDCAD is lacking bullish signals, with traders waiting for a clear break above 1.3500-1.3565 or below 1.3330 to direct the market accordingly.

XM TV


Watch Now


Latest News

Technical Analysis – USDCAD steps on 20-SMA; bears still present


Technical Analysis – GBPJPY crosses below 50-day SMA as bearish bias strengthens

Technical Analysis – LTCUSD completes golden cross but advance pauses

Technical Analysis – Silver bulls roar back; meet key resistance

European Shares Set For Weak Open As Investors Await US Jobs Report

European stocks are seen opening slightly lower on Friday, as caution prevails ahead of the closely watched U.S. monthly employment report for November, due out later in the day.

Economists expect employment to jump by 200,000 jobs in November after an increase of 261,000 jobs in October. The jobless rate is expected to hold at 3.7 percent.

A cool-off in employment figures would be a welcome sign for Federal Reserve officials who have more work to do in tightening policy.

Asian markets succumbed to selling pressure and the dollar edged off 16-week lows against a basket of currencies, while gold eased but was on track for its best week in three.

Oil prices edged up slightly and were on track for their first weekly gains after three consecutive weeks of decline.

Media reports suggest that the European Union was edging closer to setting a USD 60-per-barrel price cap on Russian oil.

U.S. stocks ended mixed overnight as investors reacted to a mixed batch of economic data.

While U.S. manufacturing activity shrank for the first time in 2-1/2 years in November, consumers’ incomes and expenditures increased in October and first-time unemployment benefits declined during Thanksgiving week, separate reports showed. A measure of inflation that is closely monitored by the Federal Reserve eased but remained at an elevated level in October.

The Dow dipped 0.6 percent and the S&P 500 slipped marginally while the tech-heavy Nasdaq Composite edged up 0.1 percent.

European stocks hit a six-month high Thursday on the back of Fed Chair Jerome Powell’s dovish remarks on the pace of potential rate hikes and signs of easing COVID curbs in China.

The pan European STOXX 600 climbed 0.9 percent. The German DAX gained 0.7 percent and France’s CAC 40 index inched up 0.2 percent while the U.K.’s FTSE 100 eased 0.2 percent.