.

FX Update: US Dollar volatility to continue

The USD has been rangebound lately, even with a hawkish Fed. Markets are interpreting any “softer” data in favor of a Fed pivot, sending EURUSD up. However, a high CPI print tomorrow may send EURUSD down while the dust around US election settles.

In the last month, EURUSD has trended higher trading in the range 0.97-1.01 as investors have shifted their focus towards the end of the Fed’s aggressive hiking cycle. Sentiment has also lifted EURUSD with the prospect of a divided US Congress while the expected Republican Red sweep seems not to have materialized, and a rumored Chinese reopening brightening the gloomy global growth outlook.

Chart 1: EURUSD has been rangebound lately

Admittedly, the latest upward swing EURUSD is in contrast to our view for a stronger USD ahead, but we think recent price action is a reflection of tactical positioning rather than a change of fundamentals. If anything, the reopening of China – when it eventually comes – will complicate the inflation picture by putting new upwards pressure on commodity prices, in particular energy. Moreover, who is in charge of Congress is a topic that will wane. The topic that will not wane any time soon is the Fed’s fight against inflation. The Fed has said clearly that a pause of its rate hikes is off the table so long as inflation is high. The fight against inflation means higher rates and more pain for risk assets and the real economy. It seems that stock markets investors refuse to get the memo and are interpreting any “softer” data in favor of a Fed pivot, leading to risk on and a weaker USD. Eventually the tide should turn and investors will again feel the pain and remember the old adage: “don’t fight the Fed.”

Looking ahead, EURUSD will likely continue to have a bumpy ride but we still hold our view for a lower EURUSD towards the end of this year (around 0.95). What we are seeing now is that investors are becoming more divided when interpretating economic data and implications for monetary policy. Confirmation bias surrounding the incoming data makes some certain of a Fed pivot even if the data shows otherwise. Several central banks slowing the pace of hikes has led to a belief that rate cuts are not far away either. Some are emphasizing the risks of overtightening, however, the Fed sees a risk of not tightening enough or pausing too early to bring inflation under control.

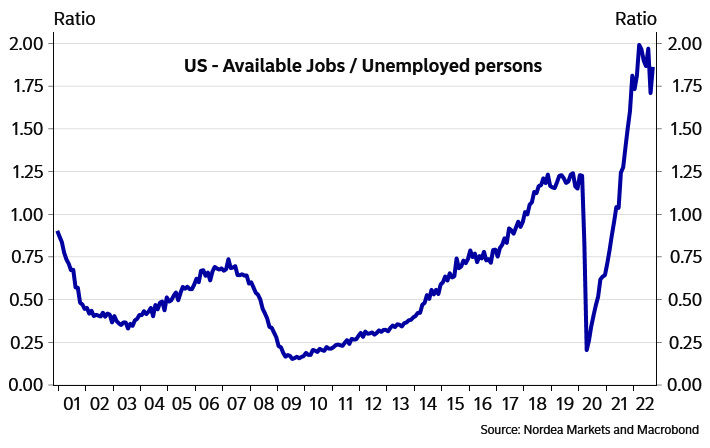
Ahead of the December FOMC, the decisive data will be the two inflation reports and two job-market reports. Looking at the latest US economic data we see little suggesting that a pause of rate hikes is in sight. On the contrary – as Chair Powell alluded to – strong economic data warrants more tightening ahead than expected at the September FOMC meeting. We have already had the first Nonfarm Payrolls report out last Friday, which was stronger than expected with a creation of some 575.000 new jobs over the last two months. Labour market participation fell slightly to 62.2%, below 63.4% before the pandemic. More worrying, monthly wage growth accelerated to 0.4% from 0.3%. All of this points to a tighter labour market and wage growth that is way too high for inflation to come back to 2%. Some have focused on the fact that the US unemployment rate rose to 3.7% from 3.5% and year-over-year wage growth fell to 4.7% from 5%. The Fed will likely trust the nonfarm payroll ‘establishment’ data compared to the unemployment data which is a result of a household survey. Moreover, year-over-year wage growth is no longer the thing to look at due to base effects kicking in. In sum, if you think the US labour market and wage growth are softening, then look over the data again.

Chart 2: US labour market remains tight

.

Tomorrow’s CPI inflation report is the next key figure in the short-term. The rise in CPI will likely slow on a year-over-year basis, but the Fed has shifted their focus to the monthly readings because of base effects. And that is where markets risk being disappointed again. We expect the October Core CPI to rise by 0.5% from the prior month – pointing to inflation well above the Fed’s mandate – with housing and service categories pulling up inflation, while supply-side categories, like used cars, and health insurance prices should become a drag. Higher-than-expected inflation figures have been a trigger for a stronger USD (6 out of the last 10 CPI releases this year – see Chart 3) and that could easily be the case this week as well, especially when the data shows that financial actors are net short USD – see chart 4.
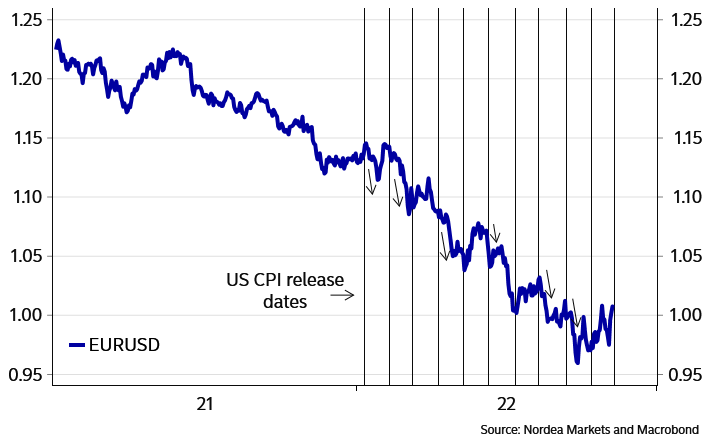
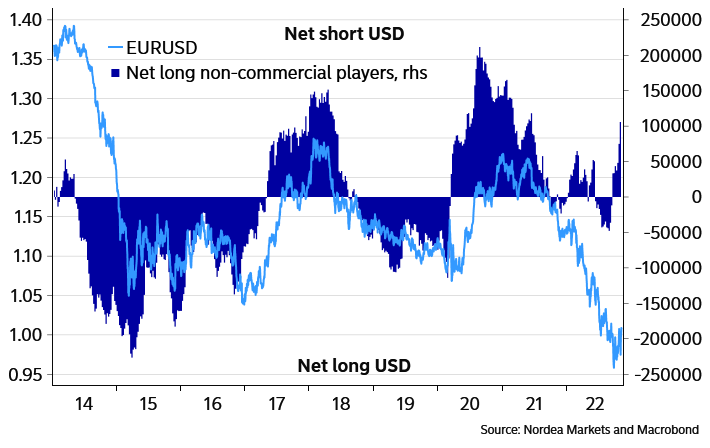
Chart 3: EURUSD has fallen 6 out of the last 10 times after the release of the CPI data

.

Chart 4: Positioning data shows non-comercial players are net short USD

.

image1.png

What Dollar Impact to Expect from US CPI and Is This Crypto’s Lehman Moment?

S&P 500 Leads Risk Retreat as Midterms Pass, Beware the Crypto Markets Feedback

There was little relief from the market’s distraction through the start of this week. Where the passing of the US midterm elections lifted one future milestone throttling speculative interests, the more ‘binary’ potential of the consumer price index (CPI) release Thursday effectively picked up the baton to keep speculative conviction in check. Yet, that event too will soon pass. In evaluating the sentiment tide leading into the top US economic docket listing Thursday, there was some notable – but nascent – traction to be registered from the S&P 500 through Wednesday’s session. The -2.1 percent drop was the first drop from the US index in four trading sessions. It would also come with the headwind in the form of an upswing in in the VVIX ‘volatility of volatility’ index. A further erosion continued in the ratio of the once-speculative favorite Nasdaq 100 (populated by the top market cap FAANG members) relative to the stoic Dow Jones Industrial Average. The NDX-DJIA ratio edged down to a fresh two-and-a-half year low through Wednesday’s close.

Chart of S&P 500 with Volume Overlaid with the VVIX Index and 1-Day ROC (Daily)

image1.png

While the dominant fundamental focus around ‘risk assets’ over the past weeks and months has reasonably focused on the fallout on monetary policy’s impact as well as the probability of recession moving forward, it is important to keep a wary eye open for the unexpected sparks that can ignite unforeseen financial fires. Just such an embryonic threat seems to be bubbling up through the crypto market. The news earlier this week that cryptocurrency exchange FTX was struggling under heavy customer withdrawals seemed to find balance when it was reported that Binance was stepping in to essentially rescue the struggling company. That reassurance fell apart, however, this past session after Binance withdrew its acquisition offer. The implications are not good. This unfavorable turn begs the question: how systemically important is FTX to the crypto currency. It is a large player, but the real threat is the potential for contagion in the space. Should stress tests heaped on other critical players in the asset class foster critical pressure, technical placement will matter little. As for what this means for the broader financial system, the fact that this happening in the crypto space matters little if it triggers a general panic in speculative appetite general. I don’t operate expecting grey swans, but it would be foolish to ignore the flare ups that seem as if they could readily escalate.

image2.png

US CPI and the Dollar’s Exposure to the Rate Implications

With the passing of Wednesday’s session, we have further put space between the market’s speculative focus and the US midterm elections. That doesn’t mean that the political landscape in the US is clear – in fact, the outlook for Congress looks to depend on some key recounts and possible runoffs. However, for its overall speculative influence, I believe the short-term potential for this event has come and gone (the long-term influence will likely play out for some time but over a more glacial pace). Yet, with the alleviation of the election distraction, we see the focus of the speculative rank shift to yet another scheduled event in the immediate future: the US October CPI. The economist forecasts call for a very modest moderation of the inflation clip. This indicator series carries serious weight given the FOMC this past week made its plans for extending the timeline and peak rate for its hawkish regime ambiguous after last week’s 75 basis point rate hike. That influence can make the event a meaningful market mover whether the actual reading beat or miss expectations.

Critical Macro Event Risk on Global Economic Calendar for Next Week

image3.png

When it comes to the market’s response to the inflation report, the impact is likely to stretch broadly across the financial system; but the Dollar is perhaps my principal focus. Below is the DXY Dollar Index chart which each of the past 8 months’ CPI releases highlighted. The direction of the market takes after the inflation update depends significantly on the direction and intensity of the data’s surprise. That said, the market response to the updates has tended to skew towards significance. Given the extended series of significant rate hikes and the Federal Reserve’s warnings that it would act principally to control price pressures, the potential for significant volatility around this event remains very high.

 Chart of US Dollar with CPI Release Dates, 100-Day SMA and 1-Day ROC (Daily)

image4.png

EURUSD and USDJPY: Differing Potential Should Inflation Stir Market Response

When it comes to evaluating whether the inflation statistics will beat, meet or miss expectations; I don’t presume to have a meaningful insight into how the data will print. As such, my approach is to scope out options for the different outcomes. In the event that the CPI reading meets expectations, the tempo on the headline (8.0 percent) and core (6.4 percent) would still be extremely high and likely default to an essential assessment of a hawkish reading. That would be a negative catalyst for ‘risk’ and benefactor for the Dollar. Assessing an S&P 500 or Dow bearish course is fairly straight forward, but evaluating a strong Greenback beneficiary is a different matter given the currency is not far from its multi-decade highs set last month. One candidate that seems well positioned is EURUSD, but not for the revival of its overall bear trend. Rather, a swing over its past 8 week range would seem feasible.

 Chart of EURUSD (Daily)

image5.png

To truly disappoint through the US inflation report, the slowing in the CPI would likely need to be significant. Something on the order of a 7.0 percent headline clip could certainly achieve that designation – though it is a more extreme scenario. Such a downgrade in inflation pressures could give the Fed scope to ease up on its inflation fight and shift its attention back towards a throttling of economic conditions. Yet, for the US Dollar, the implications could be a little more immediate and dramatic. Among crosses that would be more exposed to a dramatic and intense reaction to a Dollar retreat, I consider USDJPY the most disposed to action. There is a risk sensitivity to this pair, but the macro fundamental sensitivity is principally a reflection of the Dollar’s fortunes. Therefore, an earnest Greenback breakdown would be particularly charged here.

Chart of USDJPY with 50 and 100-Day SMAs with 20-Day ATR and Historical Range (Daily)

image6.png

\


image1.png

Dow Jones Divergence from Nasdaq Brings Relative Value into View. Will DJIA Win?

The Dow Jones Index (DJI) and Nasdaq (NDX) have been under pressure since the Federal Reserve woke up to an inflation problem that might have been brewing for more than 20 years.

In late 1996, former Fed Chair Alan Greenspan made his infamous “irrational exuberance” observation about the frothiness in the tech sector.

Many observers seemed to have forgotten that he backed away from that perspective in 1997 and the Nasdaq boomed to new heights until 2000. In any case, many commentators believe that the modern era of the so-called “Fed put” was born then.

The asymmetric bias of central banks toward looser policy than what is otherwise necessary is a debate for another time.

At the outset of the pandemic in 2020, governments and central banks around the world rushed to put measures in place to support their respective economies and indeed, society.

The result of this tsunami of stimulus that was added to the global economy enabled capital to flood into all sorts of risk assets that would normally struggle to get funding. The mainstreaming of the Special Purpose Acquisition Company (SPAC) might best represent this episode of “exuberance”.

 Equity markets also enjoyed a deluge of investor appetite. Companies that rely on debt and fresh rounds of capital raising thrived in this environment. A large percentage of technology companies might fall into this category.

Since the Fed acknowledged that the inflation genie is out of the bottle, an aggressive tightening of monetary policy has unfolded in 2022. This has seen equity market indices descend from their peaks.

The Nasdaq (NDX) could remain vulnerable to the continuing tightening of financial conditions. The Dow Jones Industrial Average (DJIA) might not be as exposed as the technology-laden Nasdaq.

If this is to hold, then trading a long DJIA/short NDX relative value position might best express this view. The ratio of DJIA divided by NDX just moved back above 3 this week. During the pandemic, it visited an all-time low of 2.14 in November 2021.

LONG-TERM DJIA/NDX RATIO

image1.png

While the ratio has already moved up significantly, it might go toward, and possibly above, its long-term average of 5.31 (1995-2022). The 3-year average prior to the pandemic is 3.6 (2017-2020).

While the Fed has made it clear that tight monetary conditions are needed for the foreseeable future to rein in inflation, any material change to this outlook will undermine the prospects for this position.

This article has been written before US CPI data and this number might provide an opportunity.

PANDEMIC DJIA/NDX RATIO, 2020 – 2022

image2.png


XAU/USD Daily Chart

Gold Prices May Fall on October US Inflation Data, Here are Key Levels to Watch

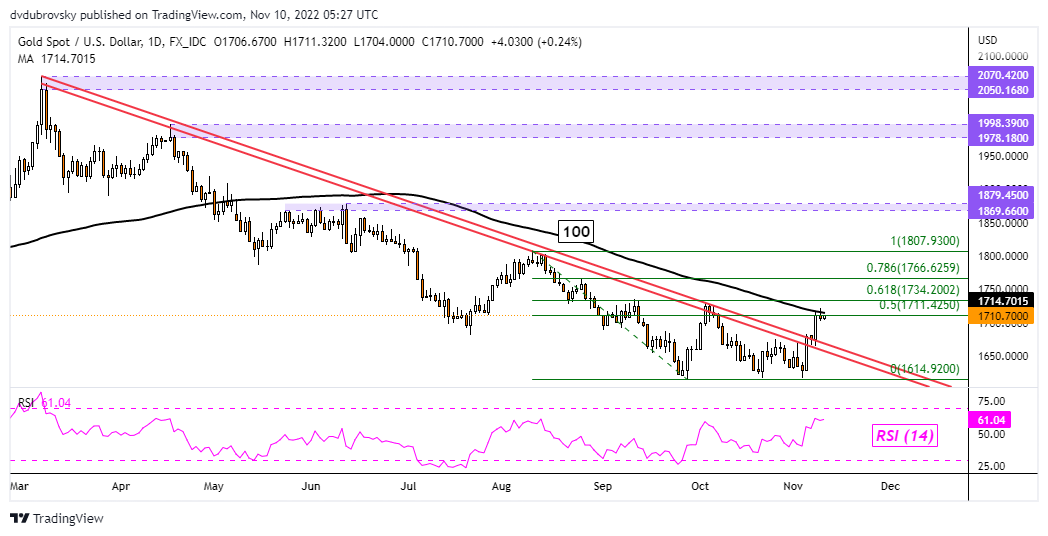
Gold prices were little changed on Wednesday amid a divergence between the US Dollar and Treasury yields. The anti-fiat yellow metal tends to be highly influenced by the latter two moving in the same direction. For example, consider a rising US Dollar and Treasury yields (which has been the case this year). The two moving higher have had a deflationary effect on gold.

Over the past 24 hours, risk aversion struck Wall Street. The S&P 500 ended a 3-day winning streak, falling about 2.1% on Wednesday. A combination of unfolding US mid-term results and a selloff in cryptocurrencies were the likely culprits. Risk aversion boosted the demand for US Dollars, pushing the Greenback higher. Meanwhile, traders took safety in bonds, depressing Treasury yields.

The higher US Dollar and softer government bond rates offered conflicting fundamental forces for the yellow metal. That may change over the coming 24 hours. All eyes are on October’s US inflation report, due to cross the wires at 13:30 GMT. The headline inflation rate is seen slowing to 7.9% y/y from 8.2% in September. Core prices, which exclude food and energy, are seen slowing to 6.5% y/y from 6.6% prior.

Disinflation will be most welcome for the Federal Reserve, but the gap between headline and core CPI will likely continue narrowing amid elevated housing costs. Down the road, this may be a problem for officials. The Citi Economic Surprise Index tracking the US remains in positive territory. That may open the door to a larger-than-expected outcome for CPI. That may boost the US Dollar and Treasury yields, leaving gold at risk.

Gold Technical Analysis

On the daily chart, gold has confirmed a breakout above the falling trendline from March. That is offering a bullish shift for XAU/USD. Still, Wednesday’s performance was rather lackluster in the context of the breakout. Moreover, the 100-day Simple Moving Average held. It may reinstate the downside bias. If not, further gains place the focus on the 61.8% Fibonacci retracement level at 1734. Otherwise, a turn lower has the former falling trendline in focus as potential support.

 XAU/USD Daily Chart

XAU/USD Daily Chart


image1.png

British Pound Pummelled as Crypto Contagion Engulfs Risk Assets. Lower GBP/USD Again?

The British Pound has been swept up in the pandemonium emanating from the turmoil in the crypto currency space. The disintegration of FTX and its inability to strike a rescue deal with Binance saw a meltdown in risk assets.

The US Justice department have said they are looking into the FTX situation and have been touch with the SEC in regard to the matter. There is a concern emerging that there could a knock-on effect from margin calls cascading into a demand for liquidity from other assets.

APAC equities followed Wall Street lower, and the US Dollar resumed it ascendency across the board into the New York close. It has given up a little ground so far in the Asian session.

Tonight’s US CPI could be the key for the US Dollar and markets in general as it could feed into perceptions where the Fed is headed with monetary policy.

Yesterday saw Chicago Fed Chief Evans softened from an ultra-hawkish stance. On the other hand, Richmond Fed President Barkin and Minneapolis Fed Boss Kashkari re-iterated their very hawkish view toward monetary policy.

According to a Bloomberg survey of economists, headline month-on-month CPI for October is forecast to be 0.6% against 0.4% for September and 7.9% for the year-on-year figure against 8.2% previously.

Month-on-month ex-food and energy CPI is forecast to show a slight easing to 0.5% against 0.6% prior, with the annual read expected to be 6.5% versus 6.6% previously.

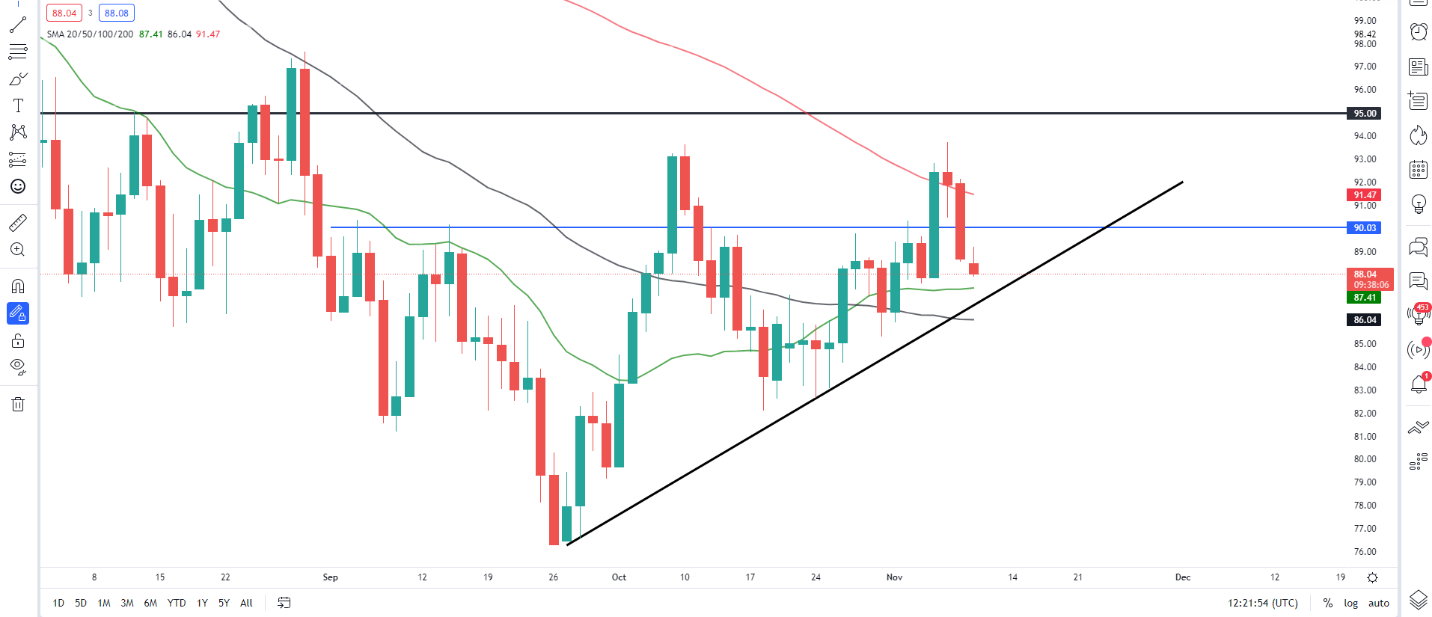
Crude oil continues to languish after the sell-off, with the WTI futures contract under US$ 86 bbl, while the Brent contract is nearing US$ 92.50 bbl. Gold has held up well, trading above US$ 1,700 an ounce.

The full economic calendar can be viewed here.

 GBP/USD TECHNICAL ANALYSIS

GBP/USD collapsed overnight after failing to overcome a recent peak at 1.1646 and that level might continue to offer resistance.

Further up, resistance could at the prior high and breakpoints of 1.1738, 1.1760 and 1.1890.

On the downside, support may lie at the prior lows of 1.1148, 1.1061, 1.0924 and 1.0354.

image1.png


Table  Description automatically generated with low confidence

WTI Crude Oil Retreats as US Inventories Jump and China Covid Fears Escalate

MOST READ: Crude Oil Trading Strategies and Tips

WTI Fundamental Outlook

Crude Oil continues to struggle this week and looks on course for its third successive day of losses. Demand fears have returned as China reported its biggest daily jump in covid cases in six months. This morning news filtered through that China’s Guangzhou has locked down another district which is likely to weigh further on oil prices.

Oman Minister of Energy Salim Al-Aufis initial comments yesterday added further pressure on oil prices. The Minister stated that current prices are not sustainable with his belief that prices will retreat to the $70-$80 a barrel range after the winter season. He commented on the upcoming OPEC+ meeting scheduled for December 4, stating that any decision would largely be based on the economic outlook from Europe. If the message out of Europe regarding a recession and higher interest rates remain the same OPEC+ may decide on further cuts.

US API data on oil stocks released yesterday indicated an increase of inventories by 5.61 million barrels for the week ended November 4. The increase in inventories comes at the wrong time as US domestic demand has showed signs of a slowdown weighing further on prices.

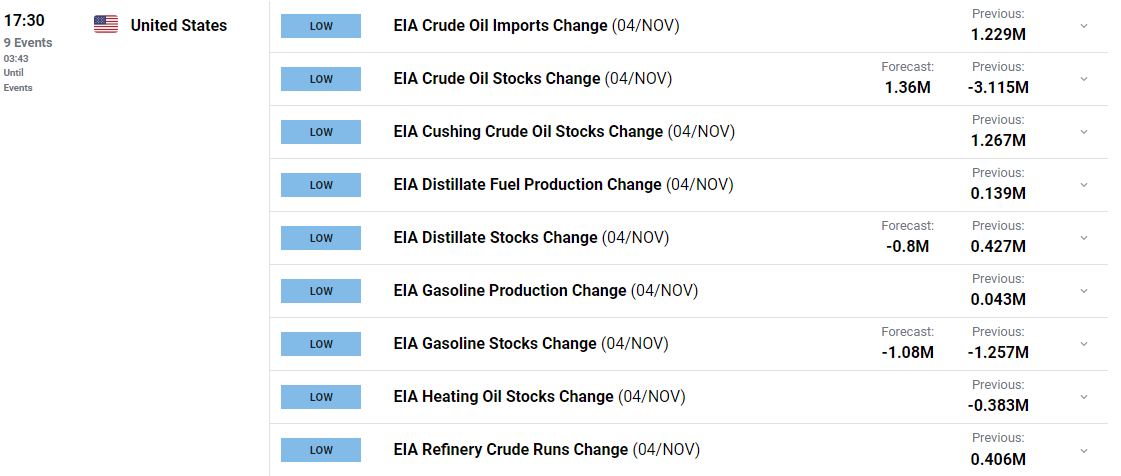
The Energy Information Administration (EIA) meanwhile published its short-term energy outlook yesterday in which it continued its trend of cutting forecasts regarding US supply growth for 2023. The Energy Agency now expects output to grow by 490 million barrels a day YoY in 2023. Later in the day we have a bunch of data from the EIA which could further weigh on oil prices.

Table  Description automatically generated with low confidence

WTI Crude Oil Daily Chart – November 9, 2022

Chart  Description automatically generated

Source: TradingView

image1.png

Gold (XAU/USD) Rally Stalls For Now as The US Dollar Looks to Recover

The precious metal rallied through resistance barriers on Tuesday with relative ease as the US dollar slipped on thoughts that the Federal Reserve may pare back December’s rate hike. The latest market pricing now favors a 50bp hike (56.8%) compared to a 75bp increase (43.2%) as Fed speakers begin reining in further, aggressive tightening talk.

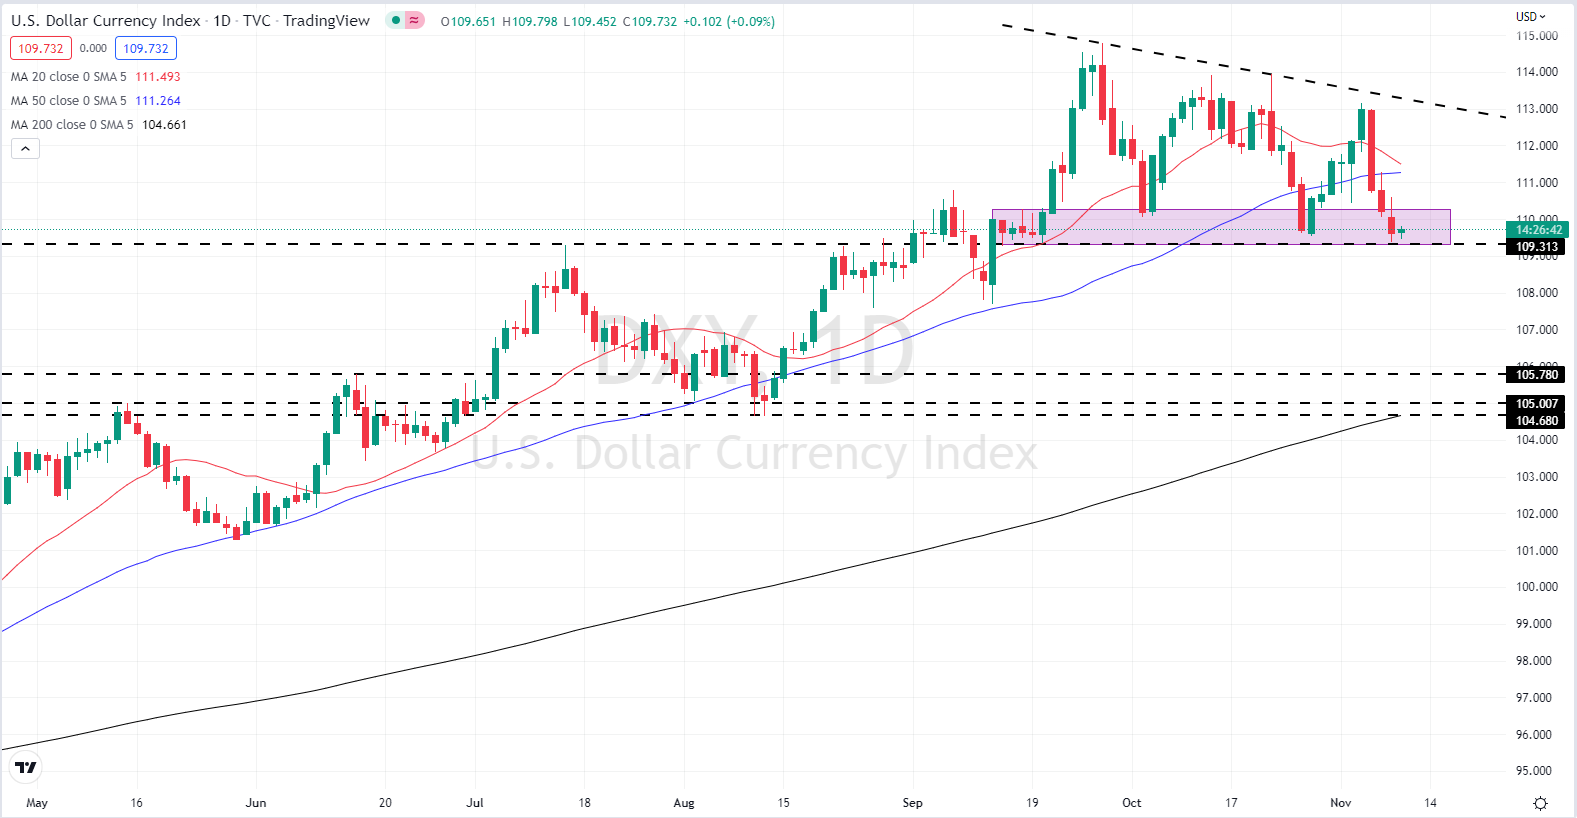
A look at the US dollar daily chart shows the greenback back in a zone of support that has held for the last two months. Since the end of September, the US dollar has failed to break higher with the short-term trend showing a bearish bias. Support remains in place suggesting that the US dollar may become trapped in a narrowing range in the short- to medium term.

 US Dollar Currency Index Daily Chart – November 9, 2022

image1.png

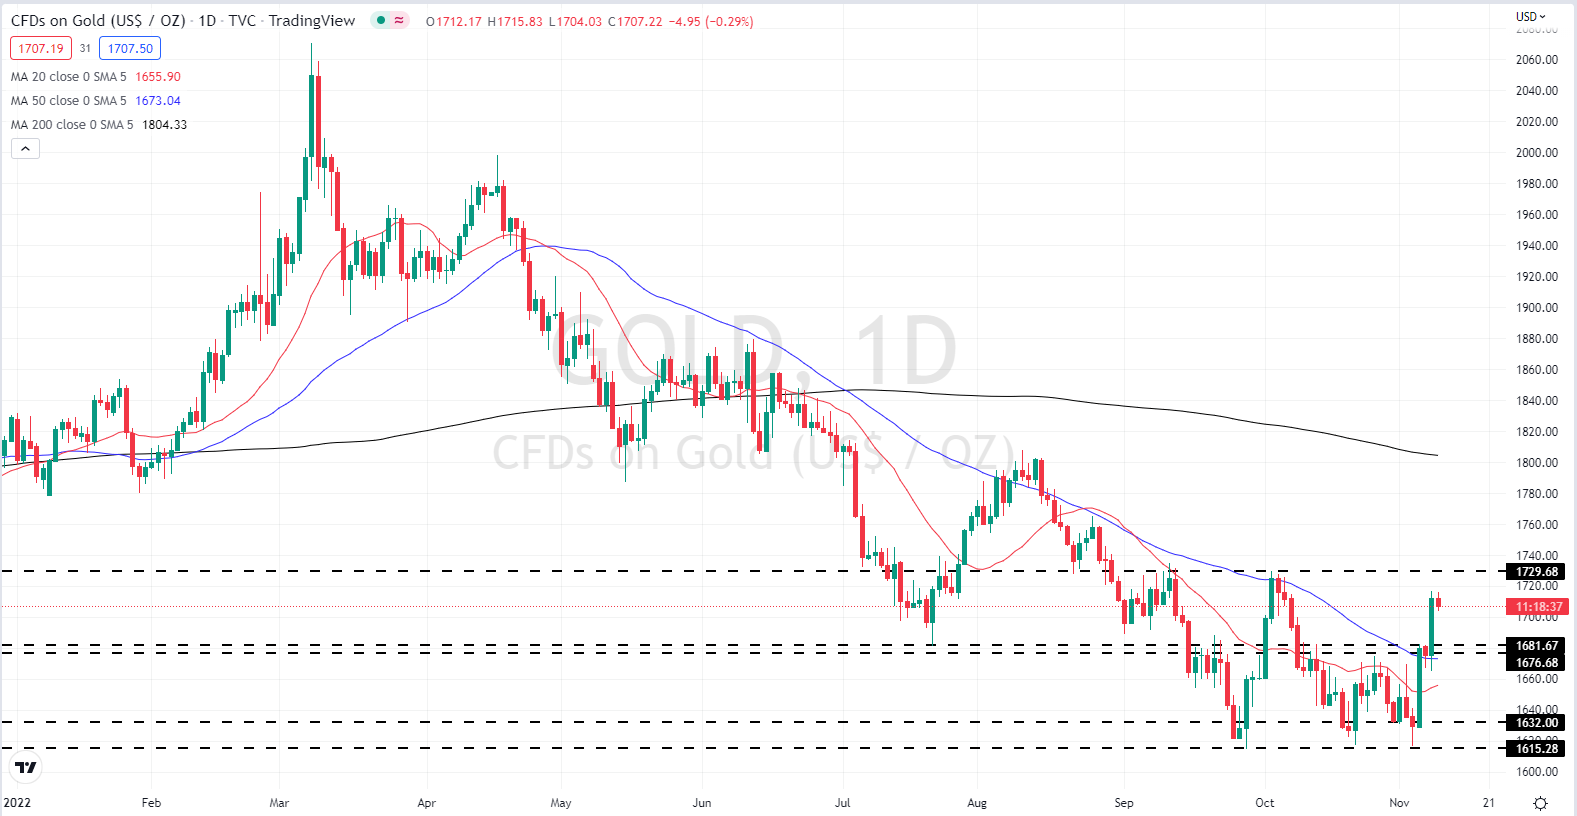
Gold printed a fresh one-month high on Tuesday as the US dollar slipped into support. Gold has added around $100/oz. since last Thursday when the precious metal bounced off support, the third time this level has held in the last six weeks. The daily chart is looking more positive with the multi-month downtrend under pressure. A close and open above $1,730/oz. would break the recent series of lower highs and leave $1,766/oz. as the next upside target. Initial support between $1,676/oz. and $1,682/oz.

Gold Daily Price Chart – November 9, 2022


image2.png

Chart via TradingView

Global Energy Driven Inflation May Ease As China Sees Lower Growth

The key driver of the rising inflation causing economic mayhem across the developed world remains historically elevated oil and gas prices that have been in play since the prospect of Russia’s invasion of Ukraine first came into view, which was in September last year, when the oil price was around US$65 per barrel (pb) of Brent. This rise, when combined with the huge rise in global liquidity caused by the various long-running quantitative easing programs that followed the Great Financial Crisis, have led Western government to embark on a series of dramatic increases in interest rates aimed at capping inflation but which, in themselves, may cause long-lasting economic recessions. One major factor that may serve to mitigate against this, by acting as a drag on oil and gas prices, is the economic outlook of China, which surpassed the U.S. as the largest annual gross crude oil importer in the world in 2017. Part of the problem for China’s economy has been the exceptionally negative effects of its ‘zero-Covid’ policy. This policy, personally championed by President Xi Jinping, is based on ultra-tight lockdowns that are introduced across entire cities immediately that a relatively miniscule number of Covid-19 cases are identified. December 2021 had seen a refinement of the zero-Covid strategy to one incorporating the idea of ‘dynamic clearing’, which provided local governments more flexibility in imposing restrictions, allowing daily increases in symptomatic cases to be capped at around 200 on a national basis. It was thought that this number might be increased, given that in the new outbreaks in March this year alone, 184,000 individuals with possible Covid symptoms had been put under medical observation in isolation in the first two weeks of those outbreaks.

Optimism arose from comments made by several Chinese agencies about a possible softening up of the zero-Covid rules, and then came the publication in the middle of April of the Chinese Center for Disease Control and Prevention (CCDC) guide that outlined measures for quarantining at home. These would have alleviated the economy-paralysing effects of people having to quarantine at centralised state-run facilities, even if suffering from very mild symptoms or none, having tested positive for Covid-19. These hopes were dashed, though, as, when asked for further clarification of these home-quarantining procedures, the CCDC simply reiterated the previous rules. President Xi then personally reiterated that: “We must adhere to scientific precision, to dynamic zero-Covid…Persistence is victory.” As it now stands, China still does not have an effective vaccine against Covid-19, nor does it have an effective post-infection anti-viral, and it still refuses to buy in such supplies from non-domestic suppliers, despite repeated offers from all major producing countries to make such supplies available to it.

The clean sweep of support that President Xi secured at the recent 20th Party Congress to be re-elected as General Secretary of the Chinese Communist Party for a third term almost certainly means that this zero-Covid policy will not change at all. “China’s commitment to its dynamic clearing COVID strategy remains the strongest headwind to growth, and official statements before and during the Party Congress trumpeted the policy as the most appropriate for the country,” Eugenia Fabon Victorino, head of Asia Strategy for SEB, told OilPrice.com last week. “In 2020, China’s economy managed a swift recovery from the first wave of infections as mobility restrictions succeeded in capping transmissions to a limited number of regions, but the increasingly contagious viral strains have led to a substantial rise in regions reporting daily new cases of COVID,” she added. Indeed, as of just over a week ago, 26 out of 31 regions had seen severe outbreaks that threaten to spear to China’s key commercial cities.

Another part of the problem for China is the increasingly perilous position of the country’s property sector and, by extension, of its huge hidden debt burden. The collapse of major Chinese real estate developer, Evergrande, earlier this year, under the weight of over US$300 billion in liabilities, heightened concerns that contagion might spread beyond the property sector, crushing demand in China’s offshore bond markets. As highlighted by OilPrice.com at the time, and well before that by then-Fitch analyst, Charlene Chu, China had long been hiding a mountain of debt, used in part to finance its extraordinary economic growth for the 20 or so years since the 1990s. Combined with the corollary bubbles in China’s housing and other asset markets that have been inflating over the past few years, as analysed in depth in my new book on the global oil markets, the situation in China right now is very similar to the one in the West in 2007/08 to which nobody paid attention until there started to be bankruptcies, which then snowballed into the full-blown Great Financial Crisis. “Before the Congress, Beijing announced yet another raft of policy adjustments to boost housing demand,” said SEB’s Victorino. “However, cash-strapped developers continue to default on offshore bond maturities- in fact, the issuer-based offshore default rate among real estate names continues to climb, to 20.4 percent as of September, from 5.2 percent at the end of 2021,” she added.

In terms of specific negative ramifications for China’s economic growth, the key Purchasing Managers’ Index (PMI) for factory activity fell unexpectedly in October, to 49.2, a decrease of 0.9 from the previous month, and indicative of an outright contraction. In line with this, China’s crude oil imports for the first three quarters of the year fell 4.3 percent year-on-year to mark the first annual decline for the period since at least 2014. As at the end of the first half of this year, then, the economic outlook for China was already deteriorating more than had previously been expected, with SEB’s Victorino and TS Lombard’s head of China and Asia research, Rory Green, having already downgraded their GDP growth estimates for China earlier in the year, to just 3.5 percent in SEB’s case, and only 2.5 percent in TS Lombard’s.

image1.png

USD/CAD AUD/USD & Gold Technical Trade Setups

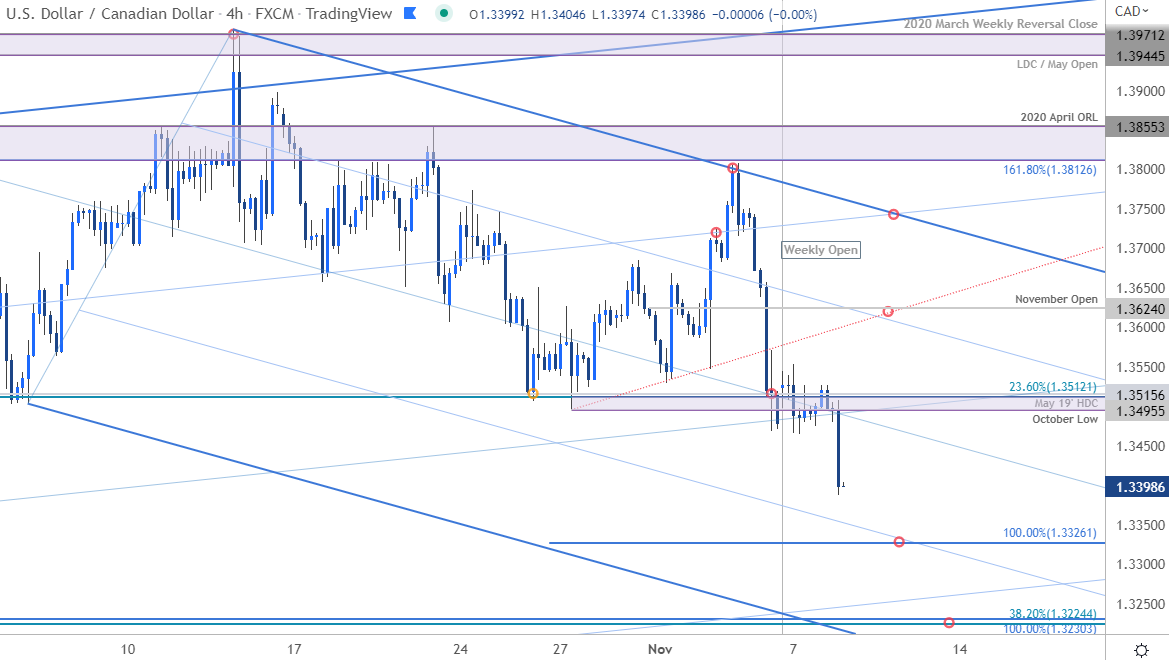
In last month’s Canadian Dollar Short-term Outlook, I noted that USD/CAD, “responded to technical resistance and the focus is on this pullback within the broader uptrend. From at trading standpoint, rallies should be limited to the weekly open (1.3870) IF price is heading lower on this stretch- look for a larger reaction on a test of the 1.35-handle with a breakout of the October range to offer further guidance here.” Price registered a high at 1.3854 in the following day with the subsequent reversal breaking below support this week the 23.6% Fibonacci retracement of the 2021 rally / May 2019 high-week close and the October lows around 1.3495-1.3515.

image1.png

The focus is on initial support at the 100% extension of the yearly October decline at 1.3326 with subsequent support objective eyed at 1.3224/30– look for a larger reaction there IF reached. Weekly open resistance stands at 1.3525 backed by the November open at 1.3624. Ultimately a breakout of this descending pitchfork is needed to mark resumption of the broader uptrend.

Bottom line: A break below key support at the October range lows threatens a larger correction in USD/CAD. From a trading standpoint, look to reduce portions of short-exposure / lower protective stops on test of 1.3326. Rallies should be limited to the monthly open IF price is heading lower on this stretch. Review my latest USD/CAD Weekly Price Outlook for a closer look at the longer-term Canadian Dollar technical trade levels.

Australian Dollar Price Chart – AUD/USD 240min

image2.png

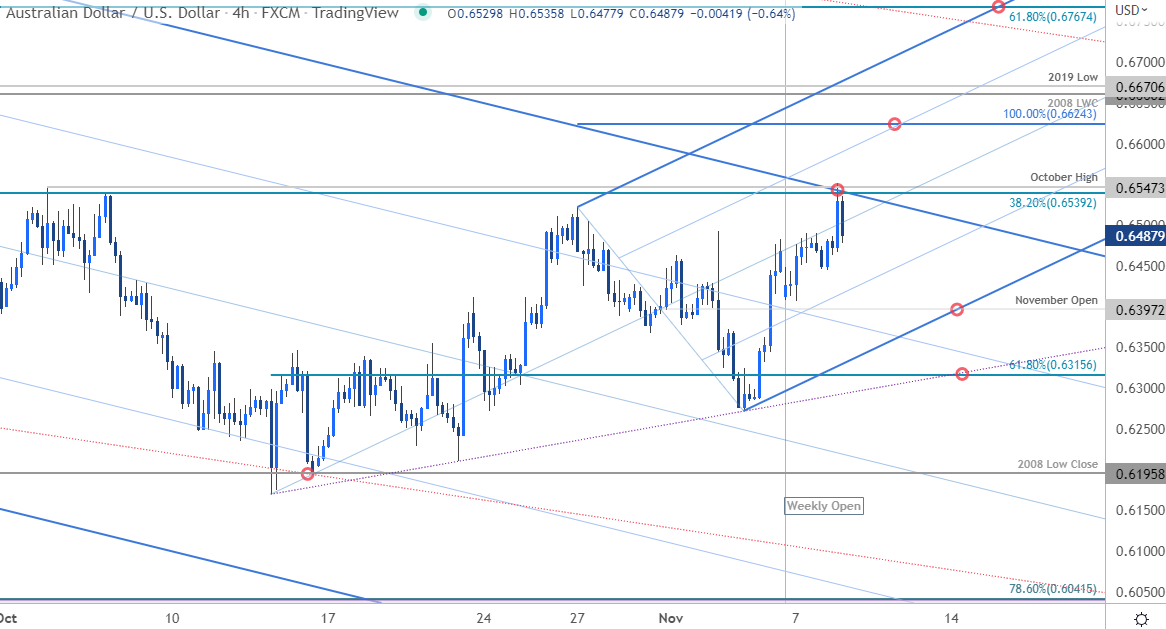
In last week’s Australian Dollar Short-term Outlook, I noted that Aussie was testing the “last line of defense” at the October trendline- that level held with AUD/USD reversing sharply higher to mark the largest single-day advance since November of 2011. The rally extended into the weekly open with price now testing confluent resistance at the 38.2% retracement of the August decline / October highs at 6539/47– looking for a reaction here with a daily close above needed to keep the immediate long-bias viable.

Initial support rests with the monthly open at 6397 with broader bullish invalidation at the 61.8% retracement at 6315. A topside breach from here keeps the focus on the 100% extension of the advance at 6624 backed by the 2008 low-week close / 2019 low at 6660/70 and the 61.8% retracement at 6767.

Bottom line: Aussie has extended into confluent resistance. From at trading standpoint, a good zone to reduce long-exposure / raise protective stops- losses should be limited to the monthly open IF price is indeed heading higher on this stretch. Review my latest Australian Dollar Weekly Forecast for a closer look at the longer-term technical trade levels.

Gold Price Chart – XAU/USD Daily

image3.png

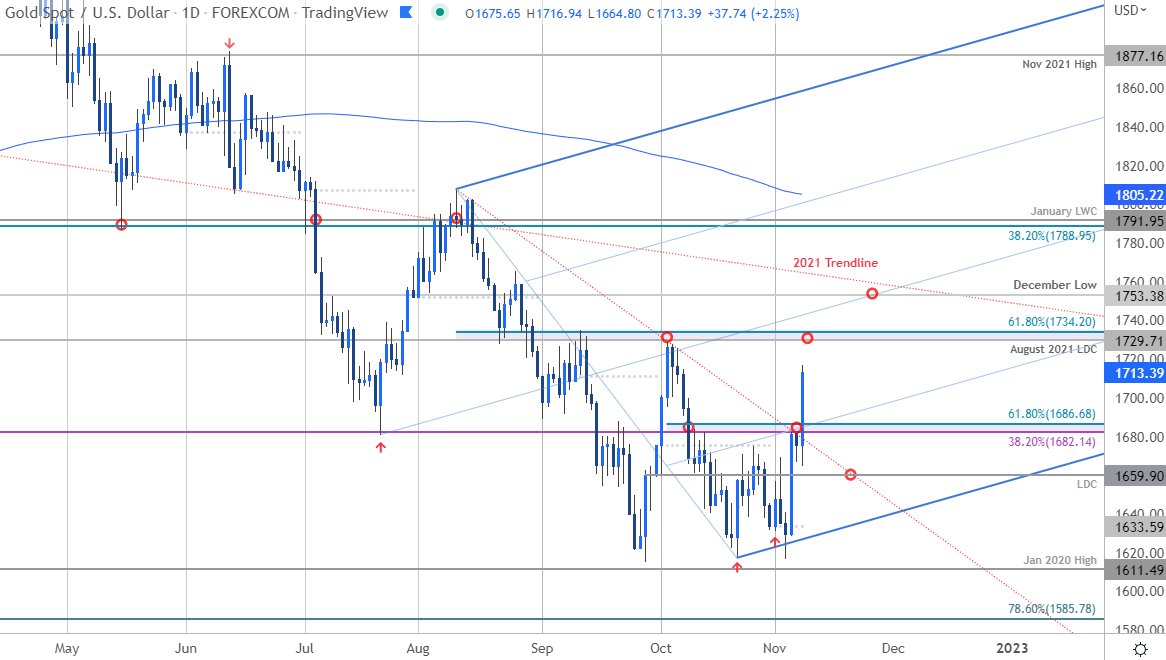
In last month’s Gold Short-term Technical Outlook I noted that the gold recovery was approaching a key pivot zone and that, “Ultimately, a breach / close above confluent Fibonacci resistance at 1682/86 is needed to suggest a larger reversal may be underway with such a scenario exposing the August low-day close / 61.8% retracement at 1729/34– look for a larger reaction there IF reached.” XAU/USD ripped through resistance today with the rally now within striking distance of the September / October highs around the 1682/86 objective.

Bottom line: A breakout of yearly trend resistance threatens a broader recovery in gold prices in the days ahead. From a trading standpoint, look to reduce long-exposure / raise protective stops on a stretch towards 1729/34 IF reached – ultimately a breach above the 38.2% retracement / January low-week close at 1788/91 would be needed to suggest a larger trend reversal is underway. Review my latest Gold Weekly Forecast to take a closer look at the longer-term XAU/USD technical trade levels.