
China President Xi: As Big Nations With Influence, China And Germany Should Work Together All The More In Times Of Change And Turmoil To Make A Greater Contribution To World Peace And Development – State Media
— LiveSquawk (@LiveSquawk) November 4, 2022
AUD/USD Aims Lower on Rising Recession Bets as US Dollar, Yields Rise
A move lower may be in store for Asia-Pacific markets after sentiment deteriorated overnight during US trading hours. A surprise drop in the number of initial jobless claims for the week ending October 29 intensified bond selling as FOMC rate hike bets hardened. Fed funds futures are pricing a +5% terminal Fed funds rate by March. The policy-sensitive 2-year US rate rose by nine basis points, while the US Dollar DXY Index.
The British Pound fell 2% against the USD despite a 75 basis point rate hike from the Bank of England (BoE). BoE Governor Andrew Baily warned that economic activity would be flat or negative for “some time.” The United Kingdom faces some of the sharpest price pressures among developed economies ahead of a potentially dire energy crunch this winter.
On Thursday, European natural gas prices eased lower to trade at 125.45 euros per megawatt hour (MWh). US Henry Hub prices shed nearly 6% as traders digested an unexpectedly strong 107 billion cubic feet (Bcf) inventory build for the week ending October 28. Crude oil prices fell around 2%. That weighed on oil-linked currencies; against the USD, the Canadian Dollar and Norwegian Krone fell 0.3% and 1.04%, respectively. Canadian oil is trading at its largest discount since December 2013 against US oil, according to the Western Canadian Select (WCS) price at -30.3 per barrel. The record flows out of the US SPR have made the heavy crude oil less attractive to refiners.
The Reserve Bank of Australia’s monetary policy statement is due at 00:30 UTC. The RBA raised its cash rate by 25 basis points earlier this week, disappointing a slim chance that the bank would return to larger hikes after last week’s inflation report. Australia posted a better-than-expected trade balance yesterday, fueled by export strength from natural gas and metal ores. However, China’s Caixin services PMI dampened forward-looking sentiment after revealing a deeper contraction occurred in October (48.4).
Asia-Pacific equity indexes may trade lower today as traders take a cautious stance ahead of the US jobs report, but prices should remain in positive territory for the week. China’s CSI-300 is up 3% since last Friday, and iron ore prices are slightly higher in early trading. China’s third-quarter account balance and an inflation rate update for the Philippines are on today’s calendar. India’s October trade balance will wrap up this week’s economic docket for the APAC region.
Australian Dollar Technical Outlook
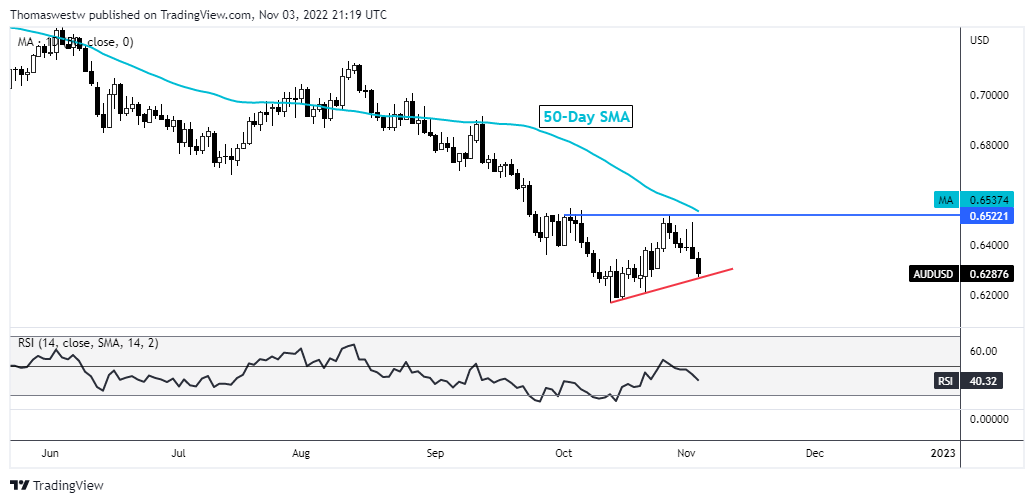
AUD/USD turned lower last week after prices failed to clear resistance from the early October levels. The downward move accelerated overnight, and prices may break a short-term trendline. That would threaten the October swing low. Alternatively, a potential rebound faces the falling 50-day Simple Moving Average (SMA).

EUR/USD Rate Susceptible to Strong US NFP Report
EUR/USD Rate Susceptible to Strong US NFP Report
EUR/USD trades back below the 50-Day SMA (0.9873) after failing to test the September high (1.0198), and the exchange rate may struggle to retain the advance from the yearly low (0.9536) as it appears to be tracking the negative slope in the moving average.
At the same time, the NFP report may drag on EUR/USD as the US economy is anticipated to add 200K jobs in October, and signs of a resilient labor market may provide the Federal Open Market Committee (FOMC) with greater scope to pursue a highly restrictive policy as Chairman Jerome Powell emphasizes that “it is very premature” to pause the hiking-cycle.
s a result, the FOMC may maintain its existing approach to achieve price stability as Chairman Powell acknowledges that “we haven’t seen inflation coming down,” and it remains to be seen if Fed officials will project a steeper path for US interest rates as the central bank is slated to release the updated Summary of Economic Projections (SEP) at the next rate decision on December 14.
Until then, EUR/USD may face headwinds as the European Central Bank (ECB) shows little interest in pursuing a restrictive policy, while the tilt in retail sentiment looks poised to persist as traders have been net-long the pair for most of the year.

The IG Client Sentiment (IGCS) report shows 66.90% of traders are currently net-long EUR/USD, with the ratio of traders long to short standing at 2.02 to 1.
The number of traders net-long is 14.20% higher than yesterday and 29.94% higher from last week, while the number of traders net-short is 18.53% lower than yesterday and 26.66% lower from last week. The rise in net-long interest has fueled the crowding behavior 53.29% of traders were net-long EUR/USD last week, while the decline in net-short position comes as the exchange rate trades to a fresh weekly low (0.9730).
With that said, another uptick in US employment may keep EUR/USD under pressure as it fuels speculation for another 75bp Fed rate hike, and the exchange rate may struggle to retain the advance from the yearly low (0.9536) as it appears to be tracking the negative slope in the 50-Day SMA (0.9873).
EUR/USD Rate Daily Chart

Using the Rising Wedge Pattern in Forex Trading
What is a rising wedge pattern?
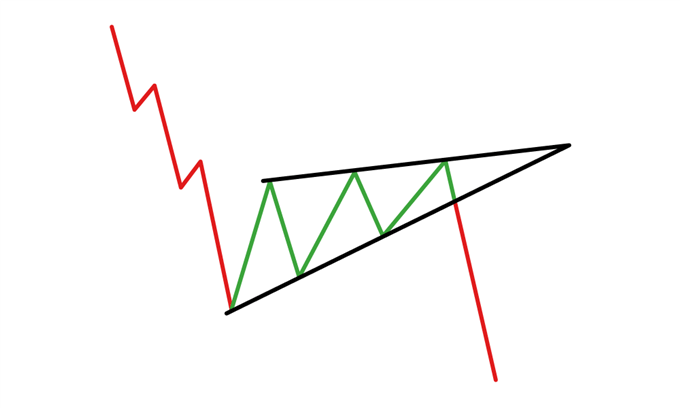
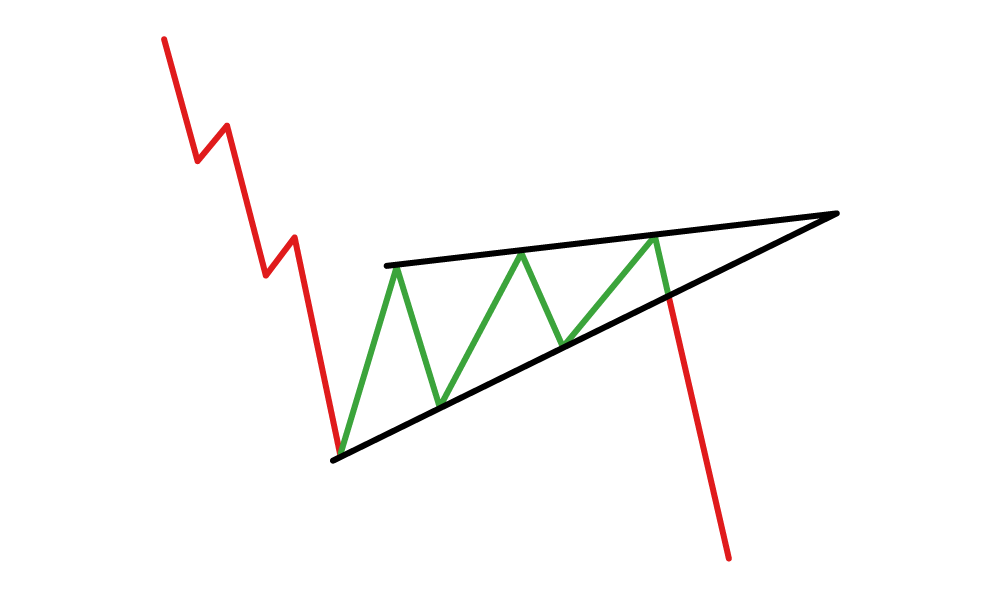
The forex rising wedge (also known as the ascending wedge) pattern is a powerful consolidation price pattern formed when price is bound between two rising trend lines. It is considered a bearish chart formation which can indicate both reversal and continuation patterns – depending on location and trend bias. Regardless of where the rising wedge appears, traders should always maintain the guideline that this pattern is inherently bearish in nature (see image below).
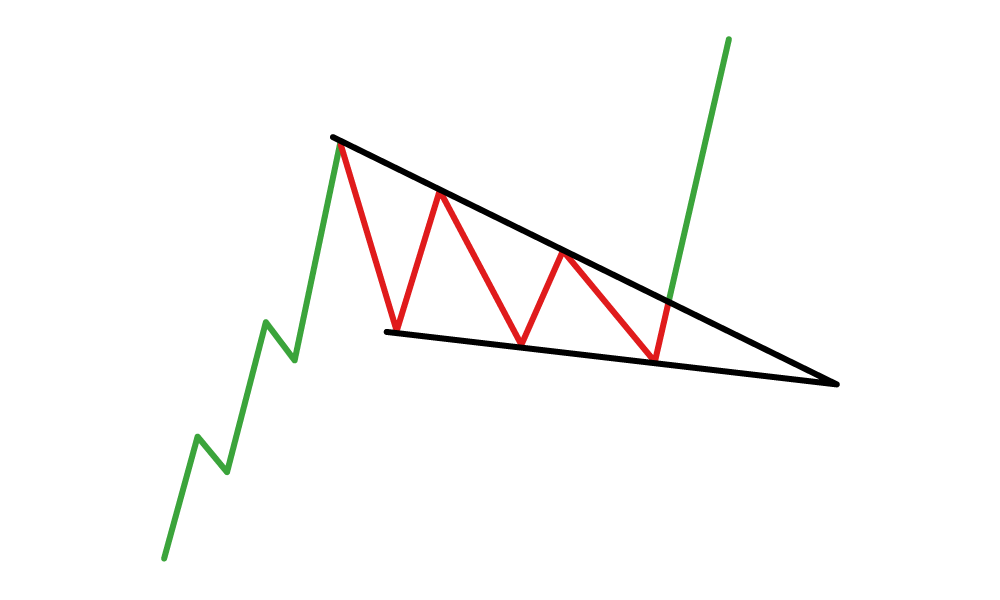
The falling (descending) wedge differentiates itself from the rising wedge by the slant of the triangle. The falling wedge declines downwards between two converging trend lines to reach an apex point which is respected as a bullish pattern (see image below).
How to identify a Rising Wedge Pattern on Forex Charts
The rising wedge pattern is interpreted as both a bearish continuation and bearish reversal pattern which gives rise to some confusion in the identification of the pattern. Both scenarios contain a different set of observation dynamics which must be taken into consideration.
Continuation Pattern:
- Established downtrend
- Rising wedge consolidation formation
- Linking higher highs and lower lows using a trend line assembling towards a narrowing point
- Confirm divergence between price and volume using volume function – MACD may also be used
- Overbought signal can be confirmed by other technical tools like oscillators
- Look for break below support for short entry
Reversal Pattern:
- Established uptrend
- Rising wedge consolidation formation
- Linking higher highs and lower lows using a trend line assembling towards a narrowing point
- Confirm divergence between price and volume using volume function – MACD may also be used
- Overbought signal can be confirmed by other technical tools like oscillators
- Look for break below support for short entry
How to Trade the Rising Wedge Pattern
The rising wedge forex pattern is linked with both continuation and reversal patterns as mentioned above. The example below shows the formation of a rising wedge on a forex pair depicting a continuation.
EUR/USD rising wedge forex chart pattern:
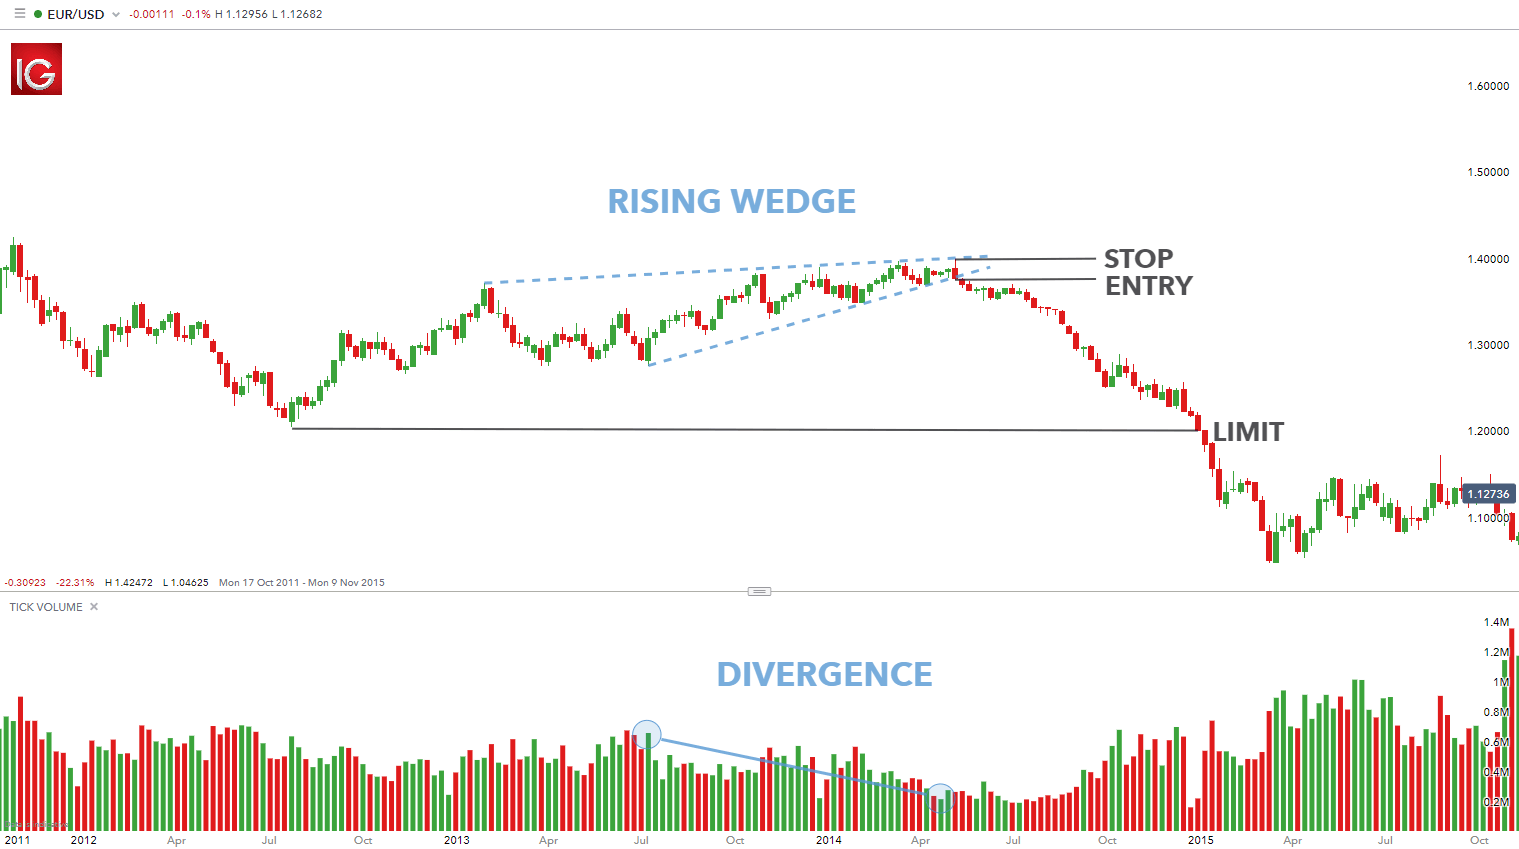
The chart above shows a rising wedge ‘continuation’ pattern after a determined downtrend. The rising wedge is outlined by the blue dashed lines showing diminishing bull strength in the uptrend. Confirmation of the uptrend waning in strength can be seen using the volume tool on the chart which depicts fading volume in concurrence with the ascending price in the market. This is known as divergence, showing that the upward movement is coming to an end.
The entry point (labelled) occurs once the trend support line of the rising wedge has been breached. There are two common methods of entry:
- Wait for a candle close below the support trend line before entry
- Enter into the short position as soon as the price breaks the support line, regardless of the candle close
The stop level as highlighted on the chart is elected from the high point of the rising wedge located on the resistance trend line. This identification point makes it relatively simple to locate the stop level for novice traders. The limit in this example was taken from the previous swing low giving this trade an extremely positive risk-reward ratio.
Gold Prices Await Non-Farm Payrolls Data, Will the US Dollar Rally?
Gold prices aimed cautiously lower over the past 24 hours, continuing to digest the aftermath of Wednesday’s Federal Reserve monetary policy announcement. There, Chair Jerome Powell inspired markets to add about a 25-basis point rate hike to the projected path for tightening by the middle of 2023. This helped push up Treasury yields and the US Dollar.
XAU/USD can be quite sensitive to situations when both bond yields and the Greenback move in the same direction, whether it is up or down. That is because the yellow metal bears no inherent yield for an investor who holds the asset. When the rate of return on cash rises, as it has been this year, that tends to bode poorly for gold.
With that in mind, all eyes now turn to Friday’s US non-farm payrolls report. The country is seen adding about 200k positions, down from 263k in September. The unemployment rate is seen ticking higher to 3.6% from 3.5%. Meanwhile, average hourly earnings are set to weaken slightly to 4.7% y/y from 5.0% prior.
The Citi Economic Surprise Index tracking the US remains in an uptrend since the summer. This means that overall, economists have been underestimating the health and vigor of the economy. That may open the door to a rosier outcome for NFPs. If such is the case, bond yields and the US Dollar may rise, placing the yellow metal at risk.
Gold Technical Analysis
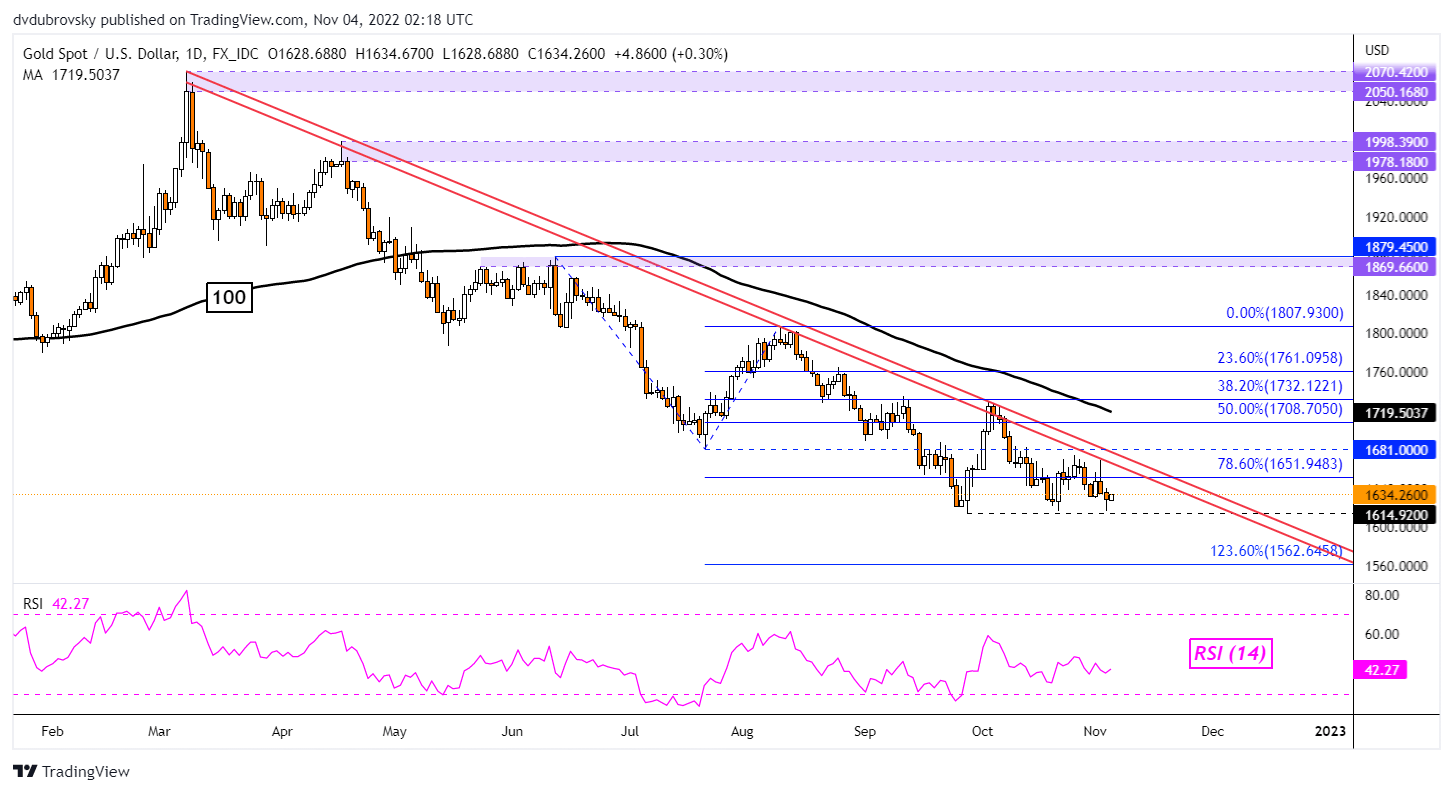
From a technical standpoint, gold is consolidating just above the September low at 1614. Prices are also contained under the long-term falling trendline from March. Breaking lower opens the door to perhaps testing the 123.6% Fibonacci extension at 1562. Otherwise, breaking above the trendline exposes the 100-day Simple Moving Average. The latter may hold as resistance.
XAU/USD Daily Chart
Gold Sentiment Analysis – Bearish
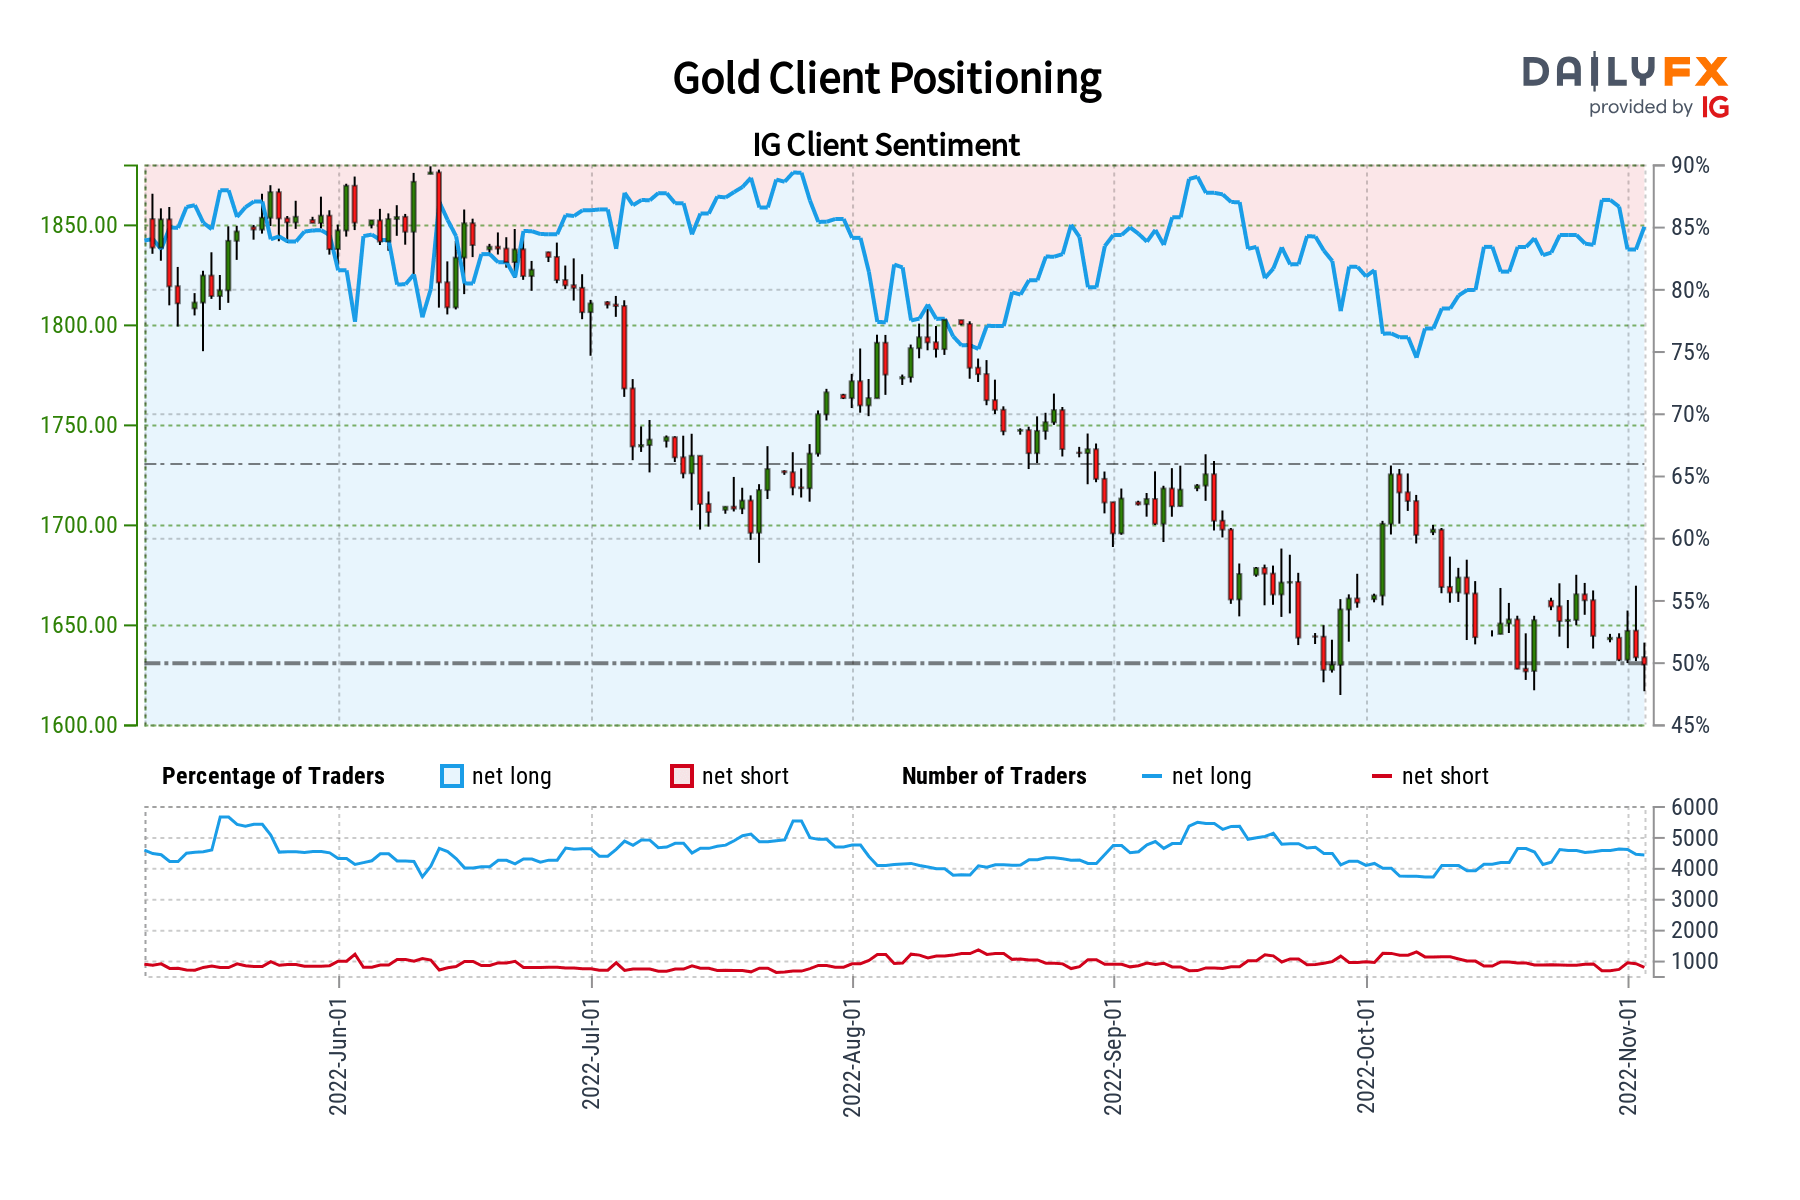
IG Client Sentiment (IGCS) shows that about 86% of retail traders are net-long gold. IGCS tends to behave as a contrarian indicator. Since most traders are biased to the upside, this hints that prices may continue falling. This is as upside exposure increased by 10.37% and 7.45% compared to yesterday and last week, respectively. With that in mind, the combination of current sentiment and recent changes offers a stronger bearish contrarian trading bias.
GBP/USD Technical Outlook: Has the British Pound Run its Course?
GBP/USD SHORT-TERM TECHNICAL FORECAST – BULLISH
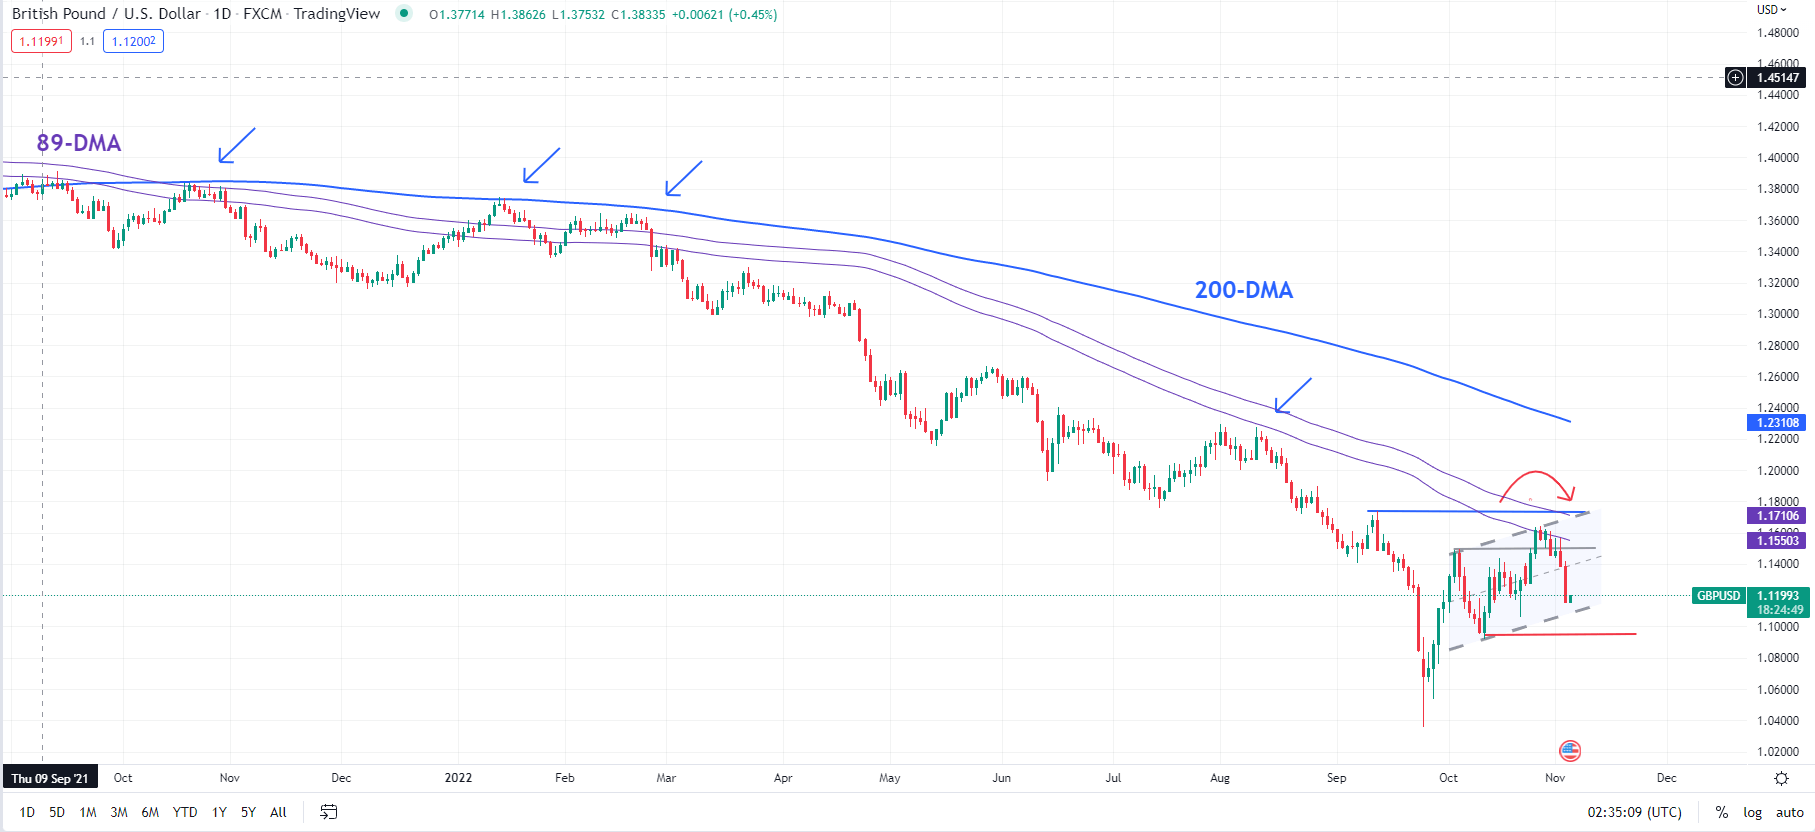
The British pound’s retreat against the US dollar from near-key resistance has taken the sting out of the recent rally. After briefly rising above resistance at the early-October high of 1.1495, GBP/USD succumbed to gains near strong converged resistance at about 1.1700-1.1750 (including the 89-day moving average and the mid-September high of 1.1740. The last time the pair was above the average was in 2021.
GBP/USD Daily Chart
The retreat now brings GBP/USD to the lower edge of a minor ascending channel from early October (now at about 1.1000). A break below would confirm that the short-term upward pressure had faded, risking a drop toward a vital cushion at the October low of 1.0925. Cable needs to hold above 1.0925 for the recovery trend to remain intact. That’s because a decisive break below 1.0925 could expose downside risks towards the September low of 1.0385.
On the weekly charts, the fall this week below last week’s bottom of 1.1255 is a weak indicator. If the pair closes lower next week on the weekly chart (relative to this week), then the chances of a retest of 1.0925 would rise (see chart).
GBP/USD Weekly Chart
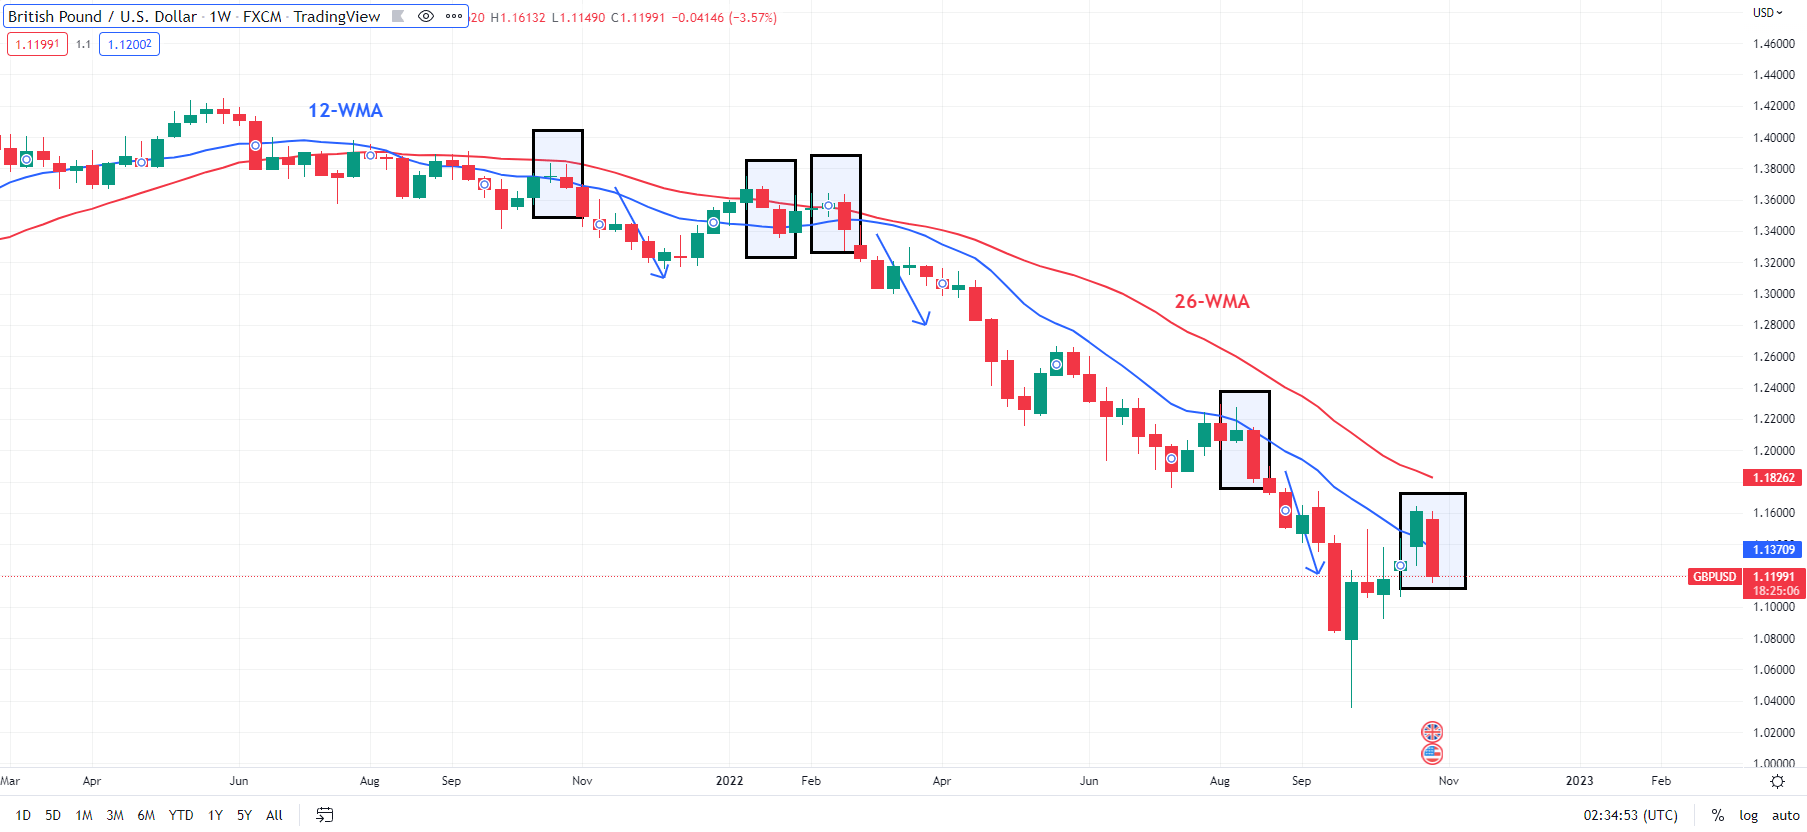
On the positive side of things, GBP/USD’s rise end of October to a six-week high is an encouraging signal. Despite the choppiness associated with the rebound from September (which in a way is understandable given the heavy damage in recent months), GBP/USD has maintained a higher-high-higher-low formation on the daily charts. So, it would be too soon to conclude that the uptrend has reversed, even though this week’s slide could be a warning message.
Looking beyond the immediate term, GBP/USD appears to have made an interim low (first highlighted in early October). What is unclear, however, is whether / how likely is a retest of the September low of 1.0385 (or below). In this regard, 1.0925 could offer some guidance. For one, a break below the cushion would disrupt the higher-high-higher-low pattern on the daily chart. Secondly, it would imply a lower low on the weekly chart (relative to this week), raising the risk of a retest of 1.0385.
oE’s Bailey: Substantial Upside Risks to Inflation Path; We Should Not Increase Bank Rate Too Far
BoE’s Bailey:
– Substantial Upside Risks to Inflation Path
– We Should Not Increase Bank Rate Too Far— *seven (@sevenloI) November 3, 2022

GBP Breaking News: Pound Steady as BoE Hike Rates by 75bp
The Bank of England unleashed its biggest interest-rate hike in 33 years as it warned that inflation is likely to peak around 11% in Q4. The vote was unanimous in terms of a hike, however, policymaker Dhingra voted for 50bp while Tenreyro voted for a 25bp hike. The bank predicts the UK economy will contract by 1% in 2024 compared to previous estimates of 0.25%. The forecasts are based on a peak market rate of around 5.25%.
The BOE insist that the peak rate is probably less than markets are currently pricing while warning they will act forcefully on persistent inflation. The central bank says the recession began in the third quarter as GDP dropped 0.5%, with it expected to last until 2023.
While markets continue to wait on the new medium-term fiscal plan, pressure on the Bank of England (BoE) has been reduced. The bank did not deliver a 75bp hike in September and since then the pound has strengthened against the greenback. Recent rhetoric from the BoE and some policymakers have hinted at their uneasiness at the amount of hikes markets are pricing. BoE policymaker Mann (a hawk) recently stated that markets are too aggressively priced at this stage. The BoE forecast from August of a recession was based on a peak rate of 3% with markets now pricing around 5%. According to Deputy Governor Broadbent this could result in a near 5% hit to GDP over the coming years.
Focus will now shift to the ‘Autumn Statement/Fiscal plan’ scheduled for November 17 as the government looks to plug the borrowing gap. Markets are a lot calmer with PM Sunak and Chancellor Hunt at the wheel of the fiscal plan, with taxes and the energy price guaranteed to be key points. Given yesterday’s Fed meeting it seems the US will continue hiking rates albeit in smaller increments, which could add further afflictions to the pound.
GBPUSD 15M Chart
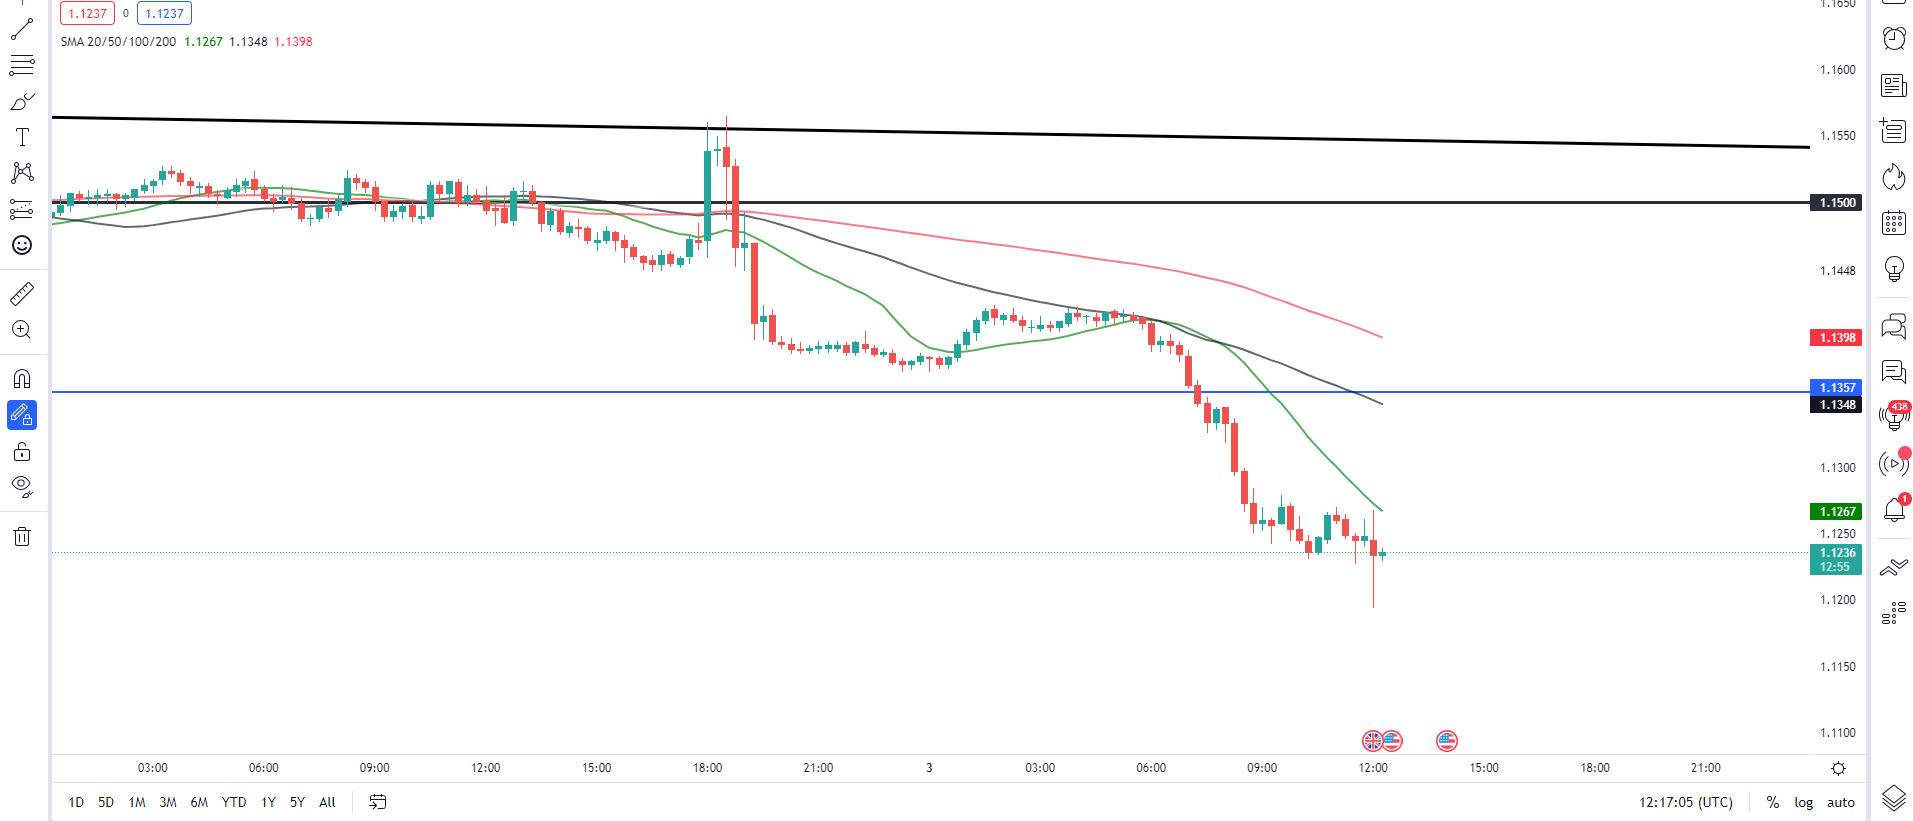
GBPUSD initial reaction saw a spike lower before recovering to trade relatively flat. Downside pressure remains on the pair as the dollar index continues its move higher.
Key Intraday Levels Worth Watching:
Support Areas
- 1.1175
- 1.1000
- 1.0750
Resistance Areas
- 1.1300
- 1.1500
- 1.1750
U.S. International Trade in Goods and Services, September 2022
September exports were $258.0 billion, $2.8 billion less than August exports. September imports were $331.3 billion, $4.8 billion more than August imports.
The September increase in the goods and services deficit reflected an increase in the goods deficit of $6.6 billion to $92.7 billion and a decrease in the services surplus of $1.0 billion to $19.5 billion.
Year-to-date, the goods and services deficit increased $125.6 billion, or 20.2 percent, from the same period in 2021. Exports increased $378.1 billion or 20.2 percent. Imports increased $503.6 billion or 20.2 percent.
Three-Month Moving Averages (exhibit 2)
The average goods and services deficit decreased $2.5 billion to $69.8 billion for the three months ending in September.
- Average exports decreased $0.3 billion to $259.5 billion in September.
- Average imports decreased $2.8 billion to $329.3 billion in September.
Year-over-year, the average goods and services deficit decreased $3.2 billion from the three months ending in September 2021.
- Average exports increased $45.6 billion from September 2021.
- Average imports increased $42.4 billion from September 2021.
Exports (exhibits 3, 6, and 7)
Exports of goods decreased $3.7 billion to $180.2 billion in September.
Exports of goods on a Census basis decreased $3.4 billion.
- Industrial supplies and materials decreased $2.3 billion.
- Crude oil decreased $1.0 billion.
- Nonmonetary gold decreased $0.8 billion.
- Foods, feeds, and beverages decreased $2.1 billion.
- Soybeans decreased $1.7 billion.
- Capital goods increased $1.2 billion.
- Telecommunications equipment increased $0.6 billion.
- Semiconductors increased $0.4 billion.
Net balance of payments adjustments decreased $0.3 billion.
Exports of services increased $0.9 billion to $77.8 billion in September.
- Travel increased $0.6 billion.
- Transport increased $0.1 billion.
- Financial services increased $0.1 billion.
Imports (exhibits 4, 6, and 8)
Imports of goods increased $2.9 billion to $272.9 billion in September.
Imports of goods on a Census basis increased $2.8 billion.
- Capital goods increased $3.3 billion.
- Semiconductors increased $1.1 billion.
- Civilian aircraft increased $0.8 billion.
- Telecommunications equipment increased $0.7 billion.
- Consumer goods increased $1.1 billion.
- Cell phones and other household goods increased $1.4 billion.
- Pharmaceutical preparations increased $1.4 billion.
- Industrial supplies and materials decreased $2.0 billion.
- Fuel oil decreased $0.8 billion.
- Crude oil decreased $0.5 billion.
- Other petroleum products decreased $0.5 billion.
Net balance of payments adjustments increased $0.1 billion.
Imports of services increased $1.9 billion to $58.4 billion in September.
- Travel increased $1.6 billion.
- Transport increased $0.3 billion.
Real Goods in 2012 Dollars – Census Basis (exhibit 11)
The real goods deficit increased $6.7 billion to $103.8 billion in September.
- Real exports of goods decreased $1.3 billion to $162.9 billion.
- Real imports of goods increased $5.4 billion to $266.8 billion.
Revisions
Revisions to August exports
- Exports of goods were revised up $1.4 billion.
- Exports of services were revised up $0.5 billion.
Revisions to August imports
- Imports of goods were revised down $0.1 billion.
- Imports of services were revised up $0.3 billion.
USD Forecast: DXY Pushes Upper Bounds of Key Technical Pattern Post-FOMC
USD FUNDAMENTAL BACKDROP
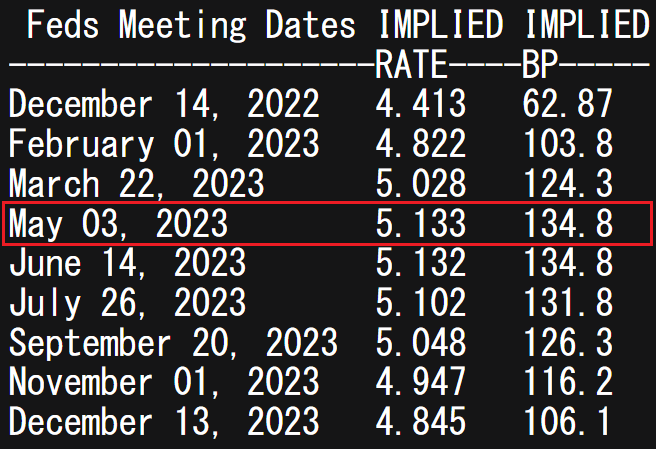
The Dollar Index’s (DXY) rallied after last nights Federal Reserve interest rate decision bringing the Fed funds target rate to 3.75-4% after the 75bps increase. Fed Chair Jerome Powell reinforced the Fed’s intention to stamp out entrenched inflationary pressures while mentioning that the size of future hikes will likely be reduced but at a higher end point. This higher ‘end point’ is what surprised markets somewhat as pre-announcement, money markets had the peak around 5% in May 2023 which has now increased to 5.133% as of this morning – see table below.
FEDERAL RESERVE INTEREST RATE PROBABILITIES
The continued rate hikes (albeit less aggressive) will not bode well for Emerging Market (EM) currencies as their traditional carry trade appeal will be diminished with most of these economies unable to keep up with the pace of rate hikes in the U.S..
Later today, ISM services PMI for October is due which is the primary driver of the U.S. economy. After Monday’s manufacturing print, a services beat would likely add additional upside support for the greenback. Prior to FOMC, ADP employment figures surprised higher heightening the importance of Friday’s NFP release.
ECONOMIC CALENDAR

TECHNICAL ANALYSIS
U.S. DOLLAR INDEX DAILY CHART
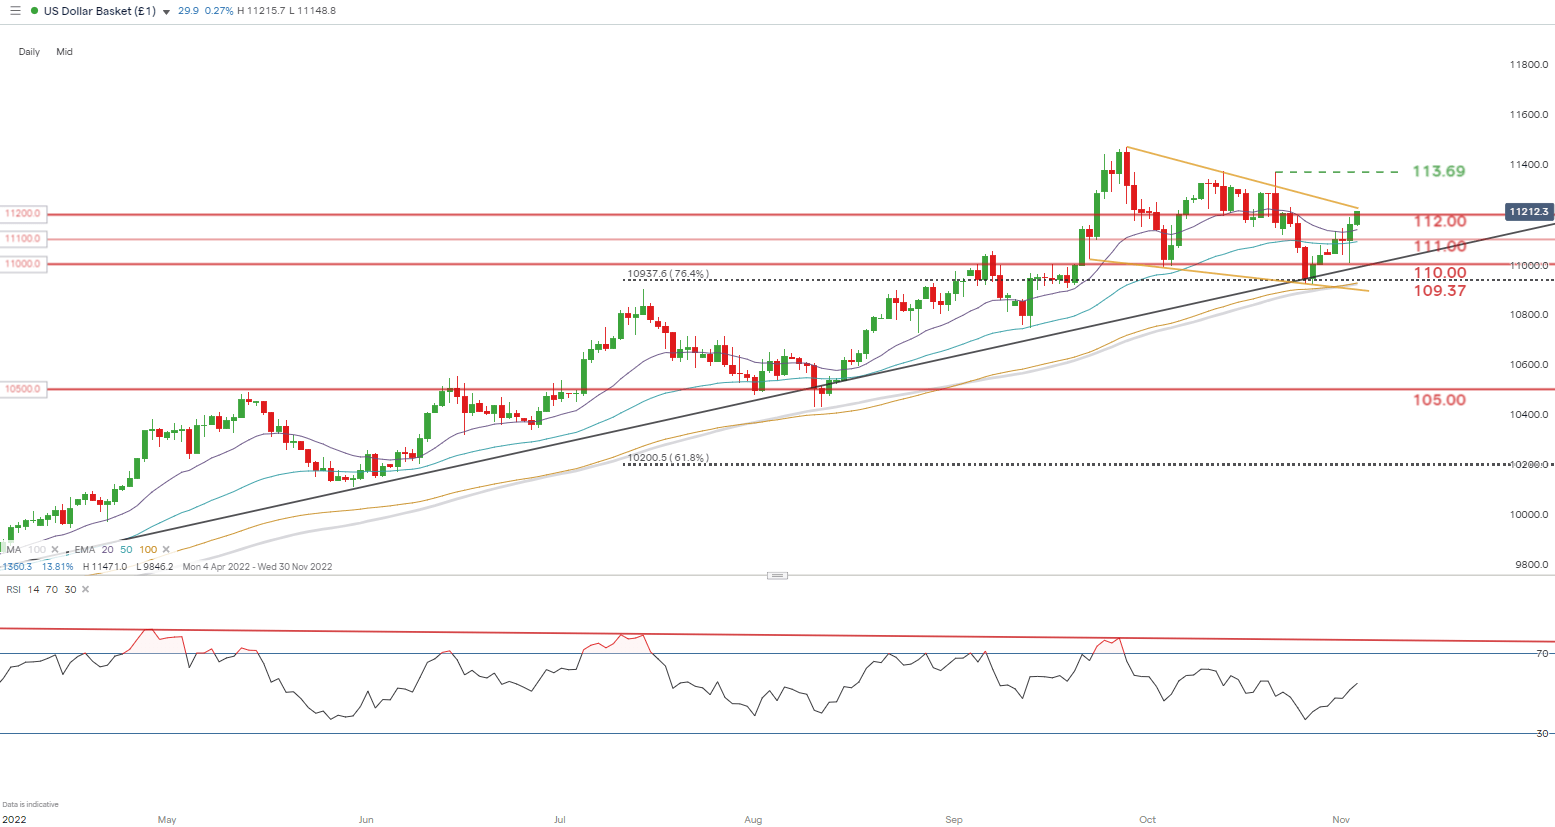
Price action on the daily DXY chart shows bulls testing the developing falling wedge chart pattern (yellow) after surpassing the psychological 112.00 handle. A confirmation daily candle close above wedge resistance could spark a extended run up to subsequent resistance zones – highly dependent on fundamental economic data (NFP on Friday).
shows bears defending the 76.4% Fibonacci (taken from July 2001 high to March 2008 low) level at 109.37. The Relative Strength Index (RSI) shows signs of bearish divergence suggesting an impending reversal. This could fall in line with a hawkish ECB rate decision on Thursday but longer-term it is difficult to see a buck of the enduring upward trend.
Resistance levels:
- 113.69 – recent swing high
- Wedge resistance (yellow)
Support levels:
- 112.00
- 20-day EMA (purple)
- 111.00
 Chat now!