AUD/USD and NZD/USD Fundamental Daily Forecast – NZ Jobless Rate Stays Near Record Low, Wages Rise

The New Zealand and Australian Dollars are inching higher early Wednesday as investors adjust positions ahead of today’s major U.S. Federal Reserve monetary policy and interest rate decisions.  The announcements will be made at 18:00 GMT.

The Fed is widely expected to raise interest rates by 75-basis points and then signal that it could reduce the size of its rate hikes starting as soon as December. The key word is “could”. This means traders are going to have to interpret the tone of the Fed, which could be the source of volatility later in the session.

Trading Derivatives carries a high level of risk to your capital and you should only trade with money you can afford to lose. Trading Derivatives may not be suitable for all investors, so please ensure that you fully understand the risks involved, and seek independent advice if necessary. A Product Disclosure Statement (PDS) can be obtained either from this website or on request from our offices and should be considered before entering into a transaction with us. Raw Spread accounts offer spreads from 0.0 pips with a commission charge of USD $3.50 per 100k traded. Standard account offer spreads from 1 pips with no additional commission charges. Spreads on CFD indices start at 0.4 points. The information on this site is not directed at residents in any country or jurisdiction where such distribution or use would be contrary to local law or regulation.

At 02:51 GMT, the NZD/USD is trading .5862, up 0.0023 or +0.39% and the AUD/USD is at .6410, up 0.0017 or +0.27%. On Tuesday, the Invesco CurrencyShares Australian Dollar Trust ETF (FXA) settled at $63.33, up $0.04 or +0.06.

New Zealand also released key employment data earlier in the day. The reports showed New Zealand’s job market remained tight in the third quarter, with the unemployment rate remaining near record lows and wages soaring.

New Zealand’s Job Market Remains Tight in Third Quarter

According to Stats NZ in a report released early Wednesday, New Zealand’s jobless rate stood at 3.3% in the third quarter, unchanged from the second quarter, while labor underutilization eased slightly.

The underutilization rate, a broader measure of spare labor capacity, dipped slightly to 9.0%, from 9.2% last quarter.

The labor force participation rate rose to 71.7% and the employment rate rose to 69.3%. Both are the highest rates recorded since the job market survey began in 1986, Stats NZ added.

Finally, over the year to the third quarter, the labor cost index increased 3.7%, compared with 3.4% in the prior quarter.

Daily Forecast

All eyes will be on the Fed at 18:00 GMT. We expect the Fed to follow-through with market expectations and announce a 75-basis point rate hike.

We also think Fed Chair Powell, in his post-meeting press conference, will say that policymakers discussed slowing the pace of rate hikes but did not commit to it. Furthermore, he may suggest that the decision to reduce the size of the December rate hike to 50-basis points will be data dependent.

This means traders will be flip-flopping between 75-basis points and 50-basis points in reaction to Friday’s Non-Farm Payrolls report and next week’s consumer inflation report. The Fed will also be monitoring growth data such as PMI and GDP reports.

We’re probably going to enter a period of heightened volatility because if the Fed can’t commit to a 50-basis point rate hike in December then investors are not likely to commit either until they see how the upcoming reports on labor and inflation play out.

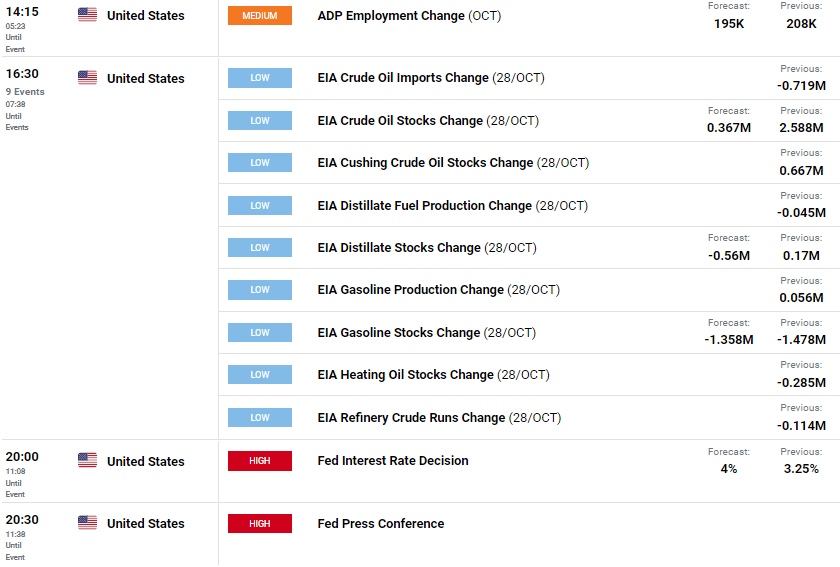
image1.png

Crude Oil Forecast: Brent Bid on Possible Reduction in China’s COVID Policies, API & FOMC

BRENT CRUDE OIL FUNDAMENTAL BACKDROP

Brent crude oil received a significant lift as we enter November after a surprise miss on the API crude oil weekly stock report yesterday (see economic calendar below). The data showed a decline in inventories by 6.53m barrels per day against a projected increase of 0.267m barrels per day. The EIA release later this evening shows a similar increase estimate with another disappointing print likely extending brent price appreciation.

image1.png

Source: DailyFX economic calendar

Brent prices gained further traction this morning on the back of unconfirmed news that China may look to ease their ‘zero tolerance’ COVID-19 rules that have plagued the economy as well as contributing to demand destruction limiting upside on global commodities including brent crude.

image2.png

From a dollar perspective, and the focus for today is the Fed’s interest rate decision. Money market are pricing in a 75bps incremental hike with a high degree of probability (98.4%) but markets will shift their attention to the post-announcement press conference. Forward guidance will likely be delivered from this platform and with much talk around a Fed ‘pivot’, any dovish slant to the speech could see the dollar decline giving brent some support.

FEDERAL RESERVE INTEREST RATE PROBABILITIES

image3.png

TECHNICAL ANALYSIS

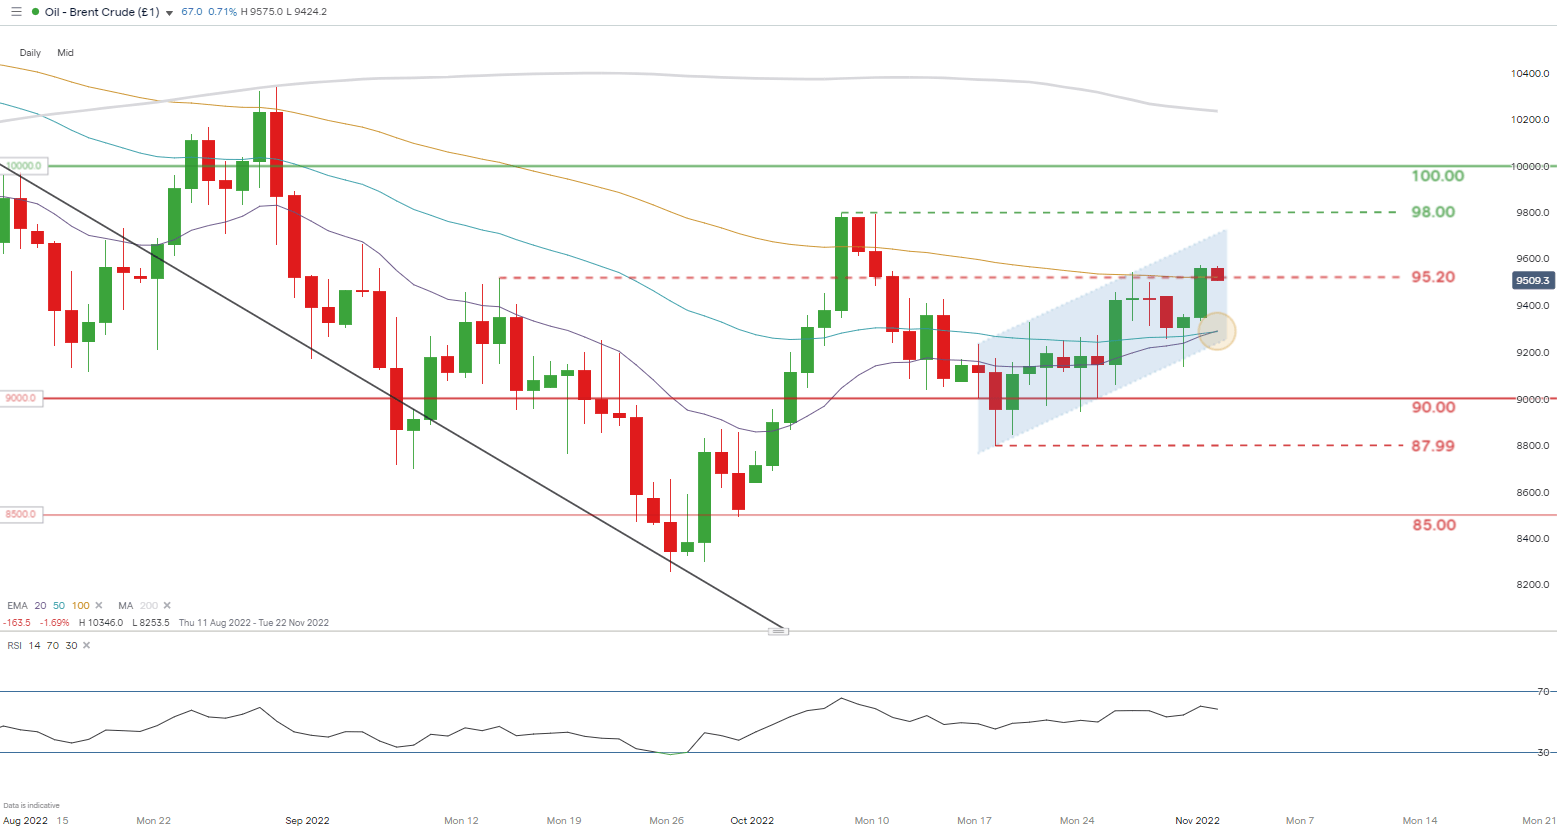
BRENT CRUDE (LCOc1) DAILY CHART -UNDATED

image4.png

image1.png

USD/JPY Technical Outlook: Growing Chance Uptrend May Pause

USD/JPY SHORT-TERM TECHNICAL FORECAST – NEUTRAL

Tuesday’s retreat from key intraday resistance has raised the odds of a minor setback in USD/JPY.

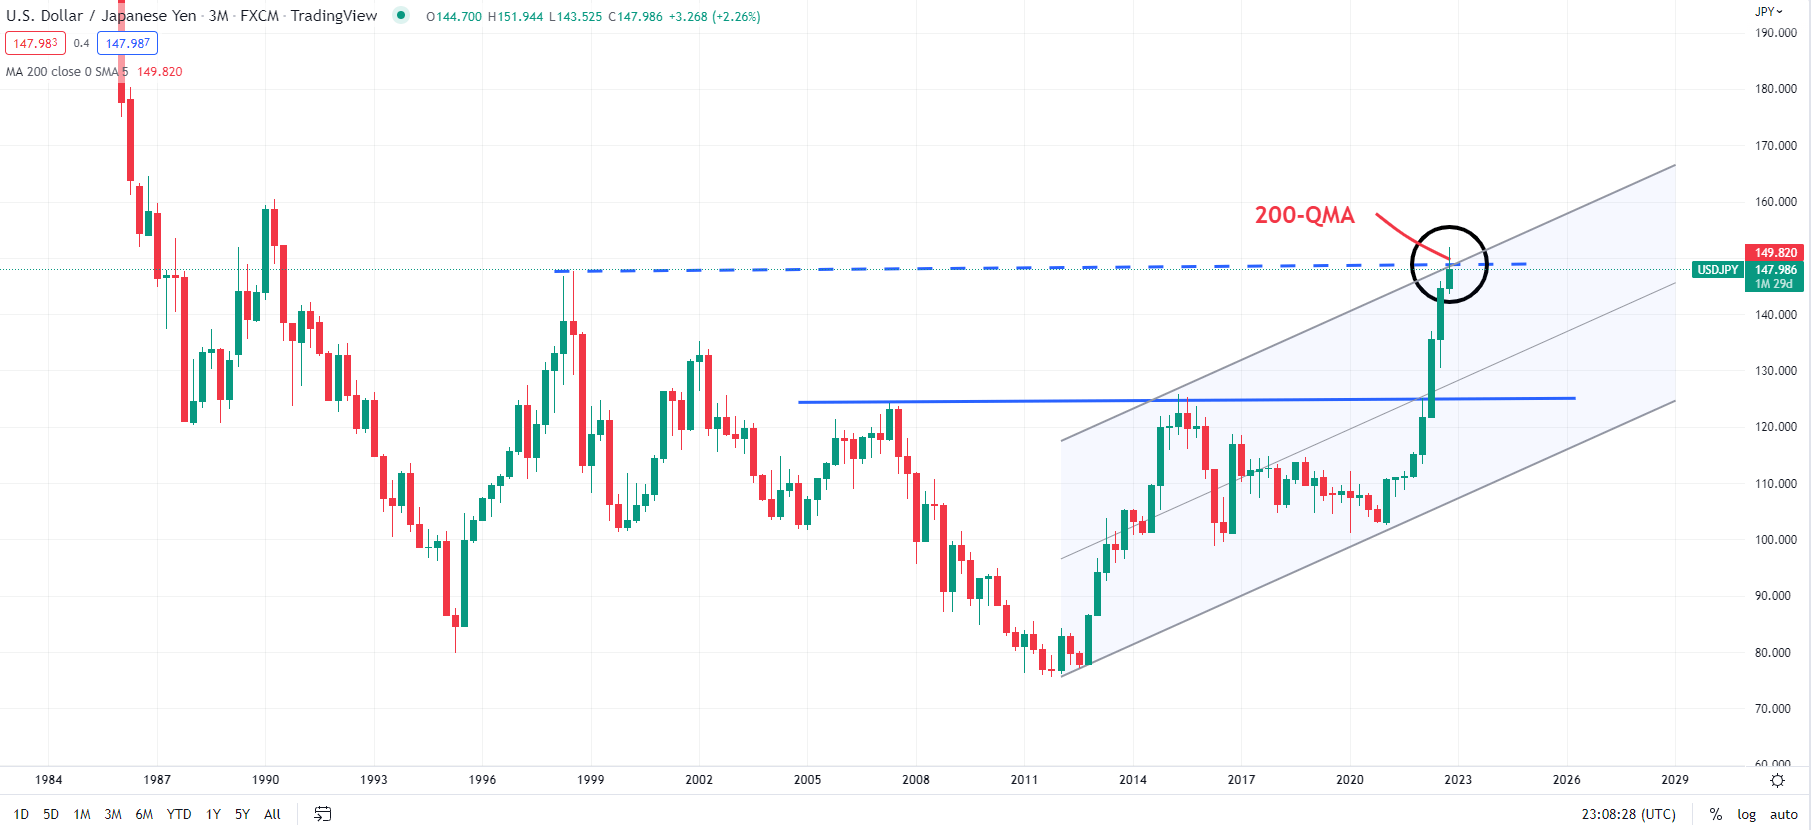
Notwithstanding the recovery in the New York session, USD/JPY continues to hold below key resistance at the October 25 high of around 149.00. This follows a solid bearish reversal on October 21, which came about from a major resistance area: the 1998 high of 147.65, coinciding with the 200-quarter moving average and the upper edge of a rising channel from 2012 (see chart).

USD/JPY Quarterly Chart

image1.png

Furthermore, back-to-back long-legged candles on the weekly charts at the October highs reflect indecision at major resistance, especially given the context of the sharp gains in recent months. Greater conviction – that is, big candles with small wicks or none at all – tends to increase the probability of a resistance break. However, small candle bodies with long wicks telegraph reduced chances of an imminent break of resistance, as they tend to reflect a lack of confidence. This is further reinforced by negative divergence on the daily and weekly charts (rising price associated with stalling or declining momentum). That may speak to rally fatigue.

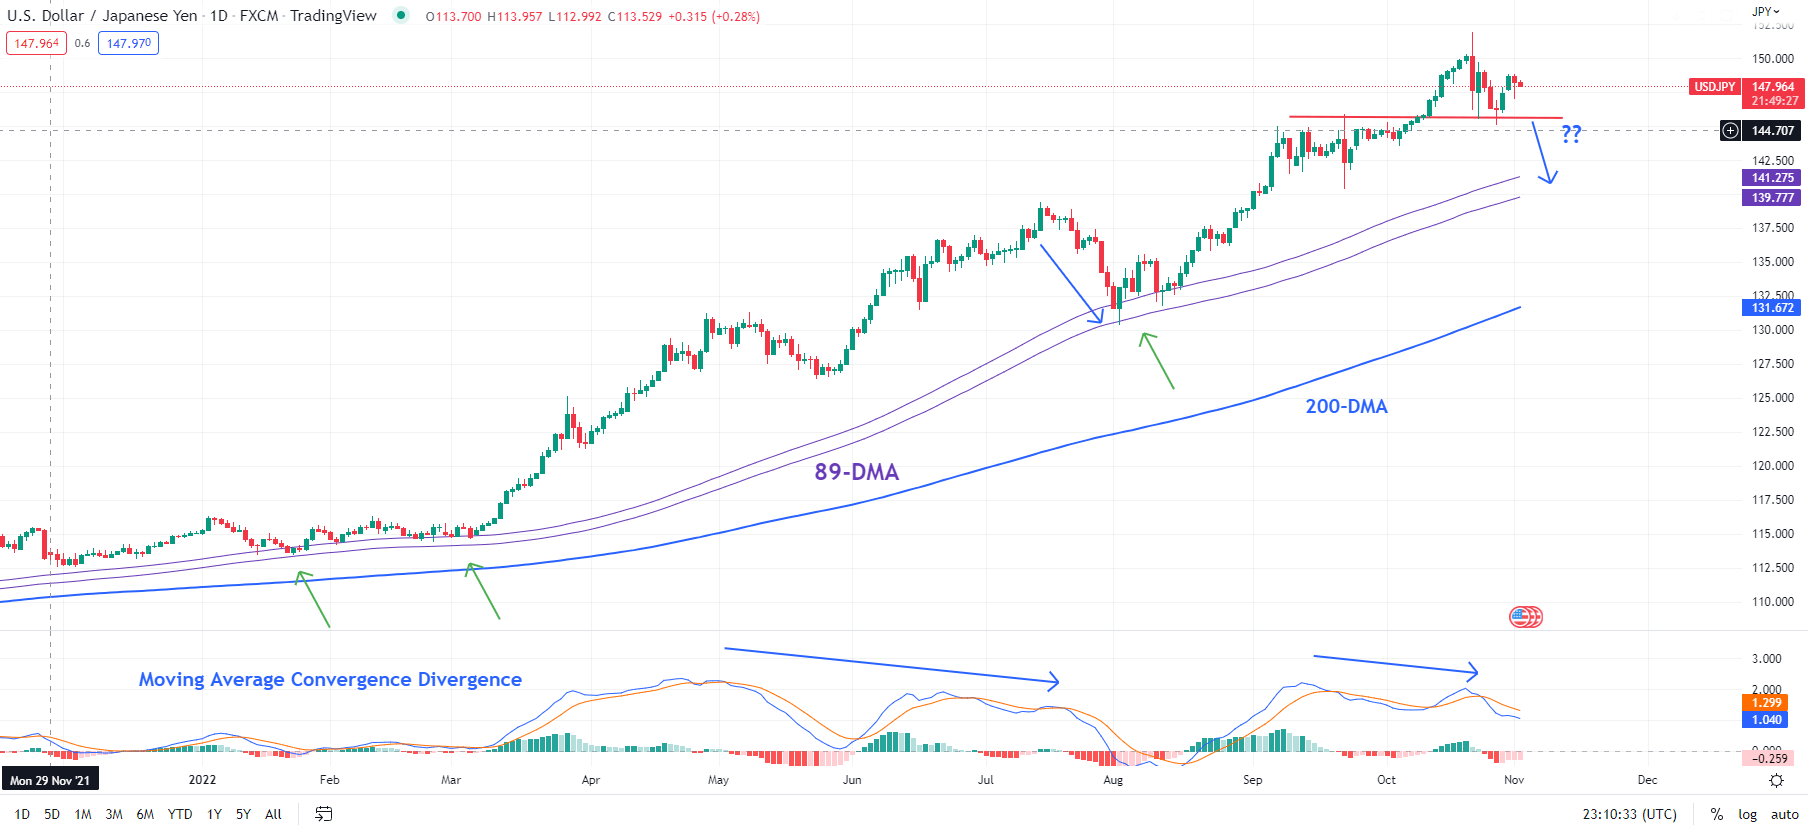
The focus is now on immediate support at the September highs of 145-146. A decisive break below this barrier would confirm that the short-term upward pressure had faded, raising the prospect of some consolidation or a minor retreat. Any further downward pressure could open the way toward the September intervention low of 140.35 near the 89-day moving average (DMA) and the July high. As the chart below shows, the last time USD/JPY was decisively below the average was in early 2021 before the surge began.

USD/JPY Daily Chart

image2.png

Zooming out, any potential setback could be viewed as a correction within an overall uptrend. The upward momentum on longer-term charts, including monthly and quarterly, remains strong, and any retreat could be short-lived. In this regard, a key signpost would be the 89-DMA – USD/JPY would need to break below this threshold for an extended drop toward the 200-day moving average (now at 131.50).

GBP/USD Sentiment Outlook - Bearish

British Pound Outlook: GBP/USD, GBP/JPY May Fall as Retail Traders Boost Long Bets

The British Pound has been enjoying a push higher since prices found a bottom in the middle of September. As GBP/USD and GBP/JPY rallied, retail traders increased their downside exposure, perhaps hoping for a turn lower. This can be seen by looking at IG Client Sentiment (IGCS), which tends to function as a contrarian indicator. Recently, investors have been starting to increase upside exposure. Could this be a sign of weakness to come for GBP?

GBP/USD Sentiment Outlook – Bearish

The IGCS gauge shows that only about 59% of retail traders are net-long GBP/USD. Since most traders are net-long, this suggests that prices may continue falling. Upside exposure has increased by 1.86% and 7.45% compared to yesterday and last week, respectively. With that in mind, the combination of current sentiment and recent changes offers a stronger bearish contrarian trading bias.

GBP/USD Sentiment Outlook - Bearish

Daily Chart

GBP/USD faces the critical long-term falling trendline from the beginning of this year. That has been maintaining the broader downside focus. Meanwhile, near-term rising support from September seems to be offering an immediate upside bias. With that in mind, a breakout seems to be imminent. Clearing the 1.1639 – 1.1738 resistance zone opens the door to facing August highs. On the other hand, falling under rising support opens the door to revisiting the September low down the road.

image2.png

GBP/JPY Sentiment Outlook – Bearish

The IGCS gauge reveals that about 28% of retail traders are net-long GBP/JPY. Since most traders are net-long the currency pair, this suggests that prices may continue rising. The number of traders net-long is 2.56% and 28% higher compared to yesterday and last week, respectively. With that in mind, recent changes in sentiment warn that the price trend may soon reverse lower despite most people being net short.

GBP/JPY Sentiment Outlook - Bearish

Daily Chart

On the daily chart, GBP/JPY appears to be attempting to confirm a breakout under rising support from September. That may open the door to a reversal. Immediate support appears to be the former 167.63 – 168.72 resistance zone. Breaking under the latter may accelerate such a reversal toward the October low. Otherwise, extending gains places the focus on the 78.6% Fibonacci extension at 173.

Daily Chart


image1.png

Gold and Silver Technical Outlook: Upside Could be Capped

GOLD SHORT-TERM TECHNICAL OUTLOOK – NEUTRAL

Gold appears to have found a short-term floor and could settle in a range with a modest upward bias in the coming days.

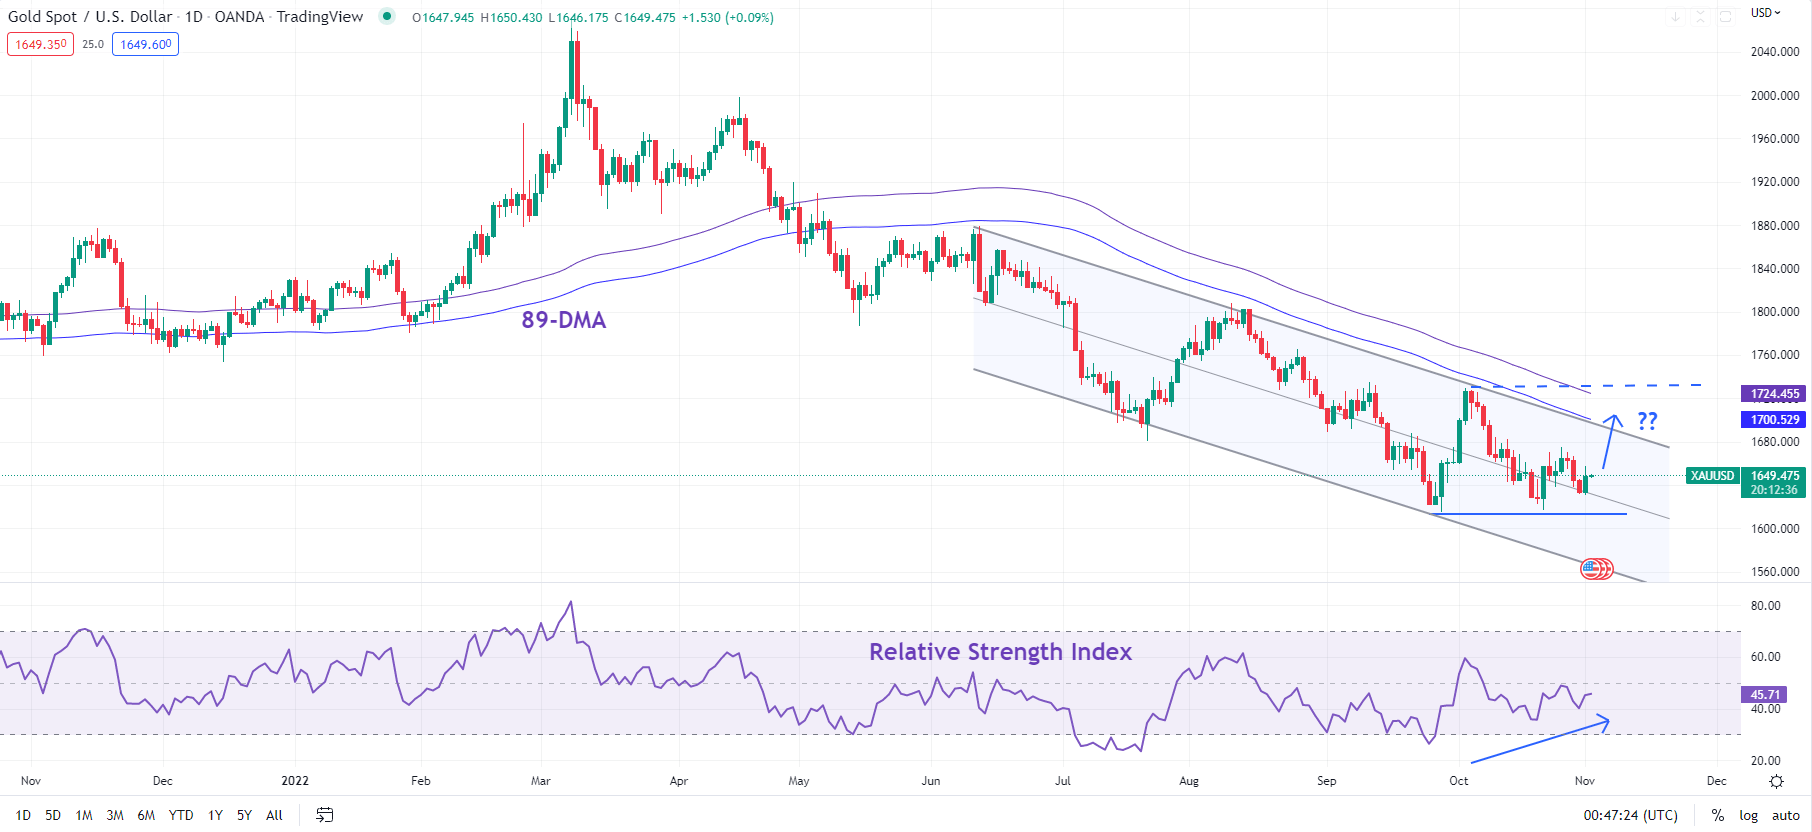
The yellow metal continues to flirt with key converged support: a horizontal trendline from 2021 at about 1675-1680, roughly coinciding with the 200-week moving average. While losses stalling recently could be interpreted as a sign of rejection at lower levels (that is, a lack of conviction below the September low of 1614), it could well be a matter of time before XAU/USD resumes its next leg lower. In this regard, tonight’s US Federal Reserve rate decision and the accompanying tone would be closely watched.

The Fed is widely expected to hike by another 75 basis points after the conclusion of its two-day meeting on Wednesday. If the US central bank doesn’t signal a slowdown in its aggressive monetary tightening cycle, gold could witness a minor relief rally. Markets have been expecting a pivot in the monetary policy after minutes of the last Fed meeting in September stated that participants observed it would become appropriate at some point to slow the pace of rate increases.

XAU/USD Daily Chart

image1.png

Broadly, XAU/USD continues to remain in a range,as highlighted two weeks ago. The upper end of the recent range is at 1725. The lower edge of the range is around 1614. Most recently, positive momentum divergence on the daily charts (falling/sideway price action associated with rising momentum) raises the odds that XAU/USD could rise toward the upper end of the range.

{{GUIDE|HOW_TO_TRADE_GOLD}}

SILVER SHORT-TERM TECHNICAL OUTLOOK – NEUTRAL

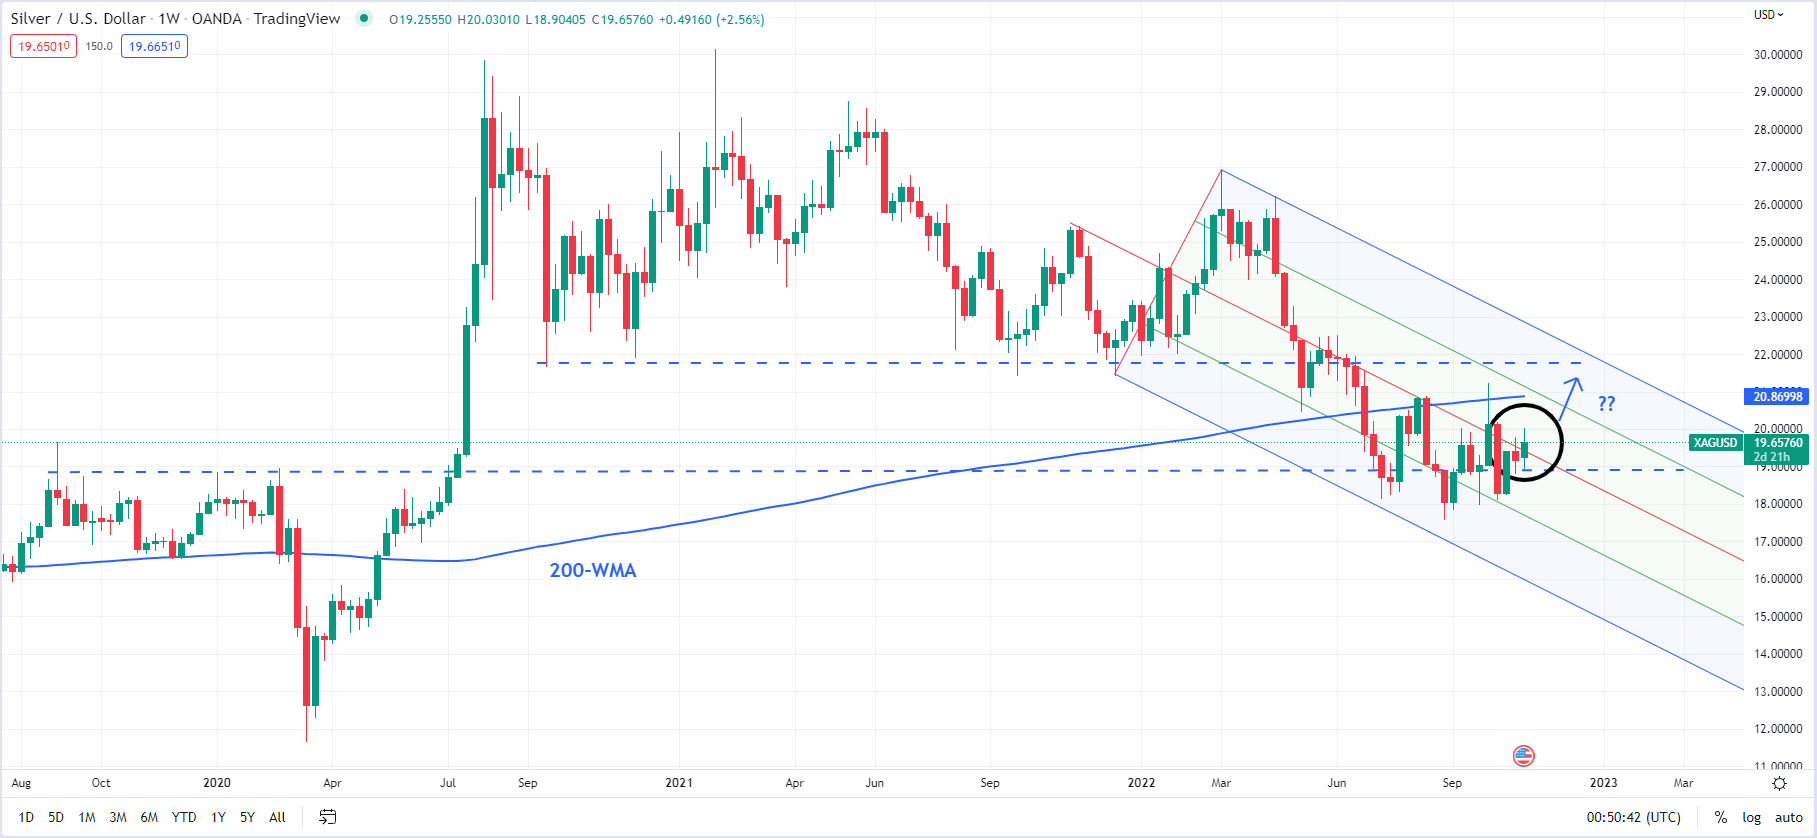
The range in Silver is perhaps more defined compared to gold. Since July, XAG/USD has been hovering in a 17.50-21.25 range, holding above horizontal trendline support from 2019-2020 highs, and the 200-week moving average to cap its upside.

XAG/USD Weekly Chart

image2.png

While the overall bias for Silver continues to be neutral, a minor rally toward the upper edge of the range is possible. After a failed attempt on Tuesday to break above immediate resistance at last week’s high of 19.80, Silver is yet again retesting the resistance. A decisive break above the resistance could push XAG/USD toward 21.25, close to the 200-day moving average (now at about 21.50).

Beyond the short term, however, the balance of risks is tilted towards the downside for XAG/USD. There is tough resistance at 21.25-21.50 (including the 200-day moving average), and Silver would need to break above this resistance for the medium-term downward pressure to fade.

Chart, histogram  Description automatically generated

US Dollar Technical Analysis Ahead of the FOMC Meeting

US Dollar Technical Analysis Ahead of the FOMC Meeting

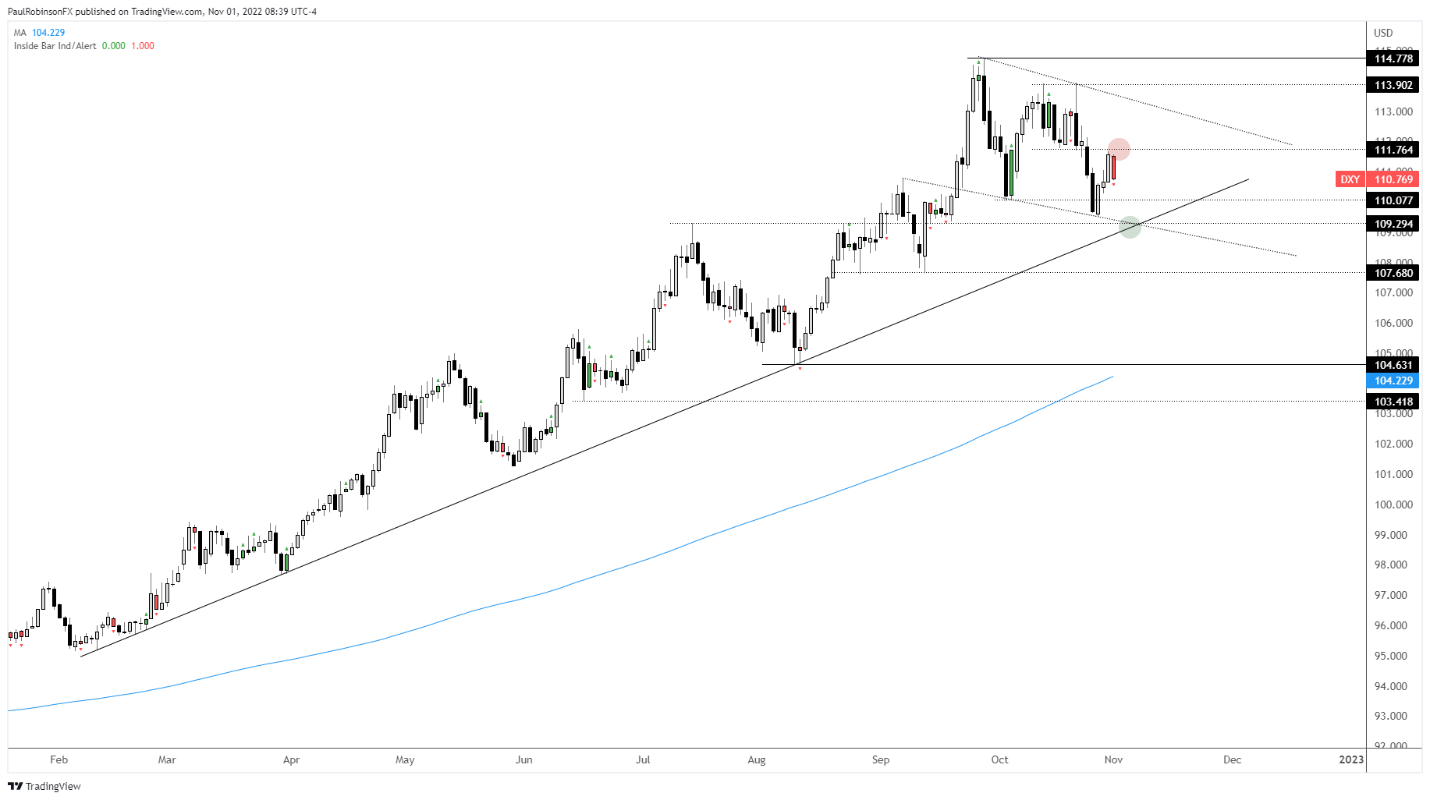
The US Dollar Index (DXY) continues to look vulnerable to more selling as the FOMC outcome nears tomorrow. The overall technical structure is still bearish within the context of a broader uptrend. How far the downward move continues will likely hinge on how support is treated.

Below the recent low there is a slope from early in the year that while not tested on numerous occasions does look sturdy. What helps fortify the trend-line in the low 109s as support is the July high at 10929 and a slope from late September.

A drop into the low 109s and strong rejection, or a breach that is quickly recovered, will keep the DXY downside in check and could signal that the correction is drawing to an end. However, should we see support break then the downside is likely to open up quite a bit.

A break of support could send the DXY down 3-4% more before it finds a low, an outcome we have to be prepared for given how extreme the trend and sentiment was prior to this bout of weakness. Overall, though, the broader uptrend is still up, nothing moves in a straight line.

For now, leaning towards lower levels and a support test at the least. Tomorrow’s Fed outcome could be rather significant in helping determine how levels want to play out.

US Dollar Index (DXY) Daily Chart

Chart, histogram  Description automatically generated


Chart, line chart  Description automatically generated

WTI Oil Poised for Triangle Breakout as Economic Headwinds Mount

Crude Oil is on the march higher this morning following yesterday’s less than stellar start to the week. Losses incurred yesterday were not enough to prevent WTI posting its first month of gains since May. Today’s rally coincided with better-than-expected Caixin Manufacturing PMI numbers out of China, potentially renewing hope around persistent demand concerns.

In a further boost from China in regard to its “Zero-Covid” policy, Chinese city Zhengzhou which plays host to Foxxconn’s iPhone factory announced the loosening of some covid controls from 6AM this morning. There still remains skepticism around demand from China as crude imports in the first three quarters of the year declined for the first time since 2014. YoY imports declining around 4.3%. This is undoubtedly an area of concern as WTI prices look to make their way higher.

WTI Crude Oil-US Domestic Production

Chart, line chart  Description automatically generated

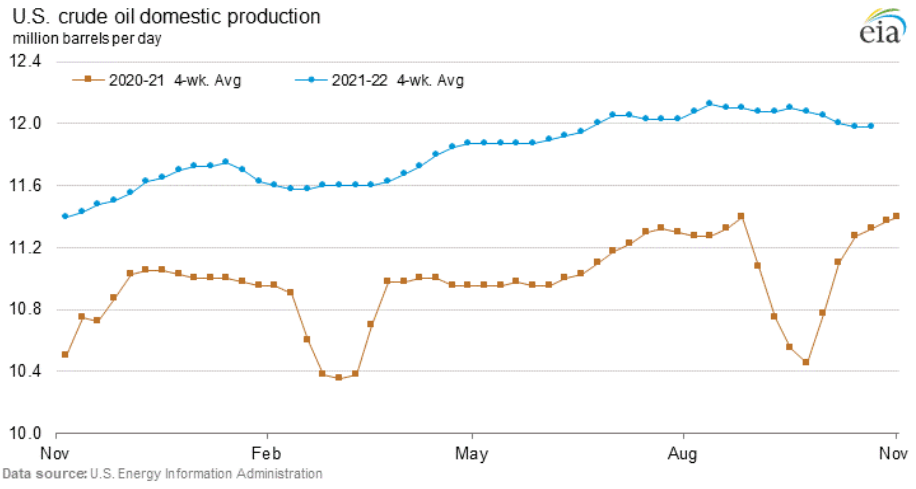
The continued back and forth between OPEC+ and the United States continues following the announced production cuts on October 5th. The US responded in kind with a 1.9 million barrels release from the strategic petroleum reserve (SPR) last week which did not seem to have the desired effect on oil prices. This comes as US crude production rose 0.9% in August to 11.98 million barrels a day, its highest since the beginning of the pandemic. OPEC+ for its part looks likely to announce further cuts to production moving forward as it expects a slowdown in demand from the Eurozone as a recession looms and winter approaches.

The remainder of the week brings a lot of promise in terms of volatility as well as in regard to WTI’s next move. We first have crude oil inventory data from EIA on Wednesday followed by the Federal Reserve meeting expected to provide clues as to the tightening cycle and US outlook for the rest of the year. Any hint of dovishness from Fed policymakers could propel WTI higher.

WTI Crude Oil Daily Chart – November 1, 2022


Chart, histogram  Description automatically generated

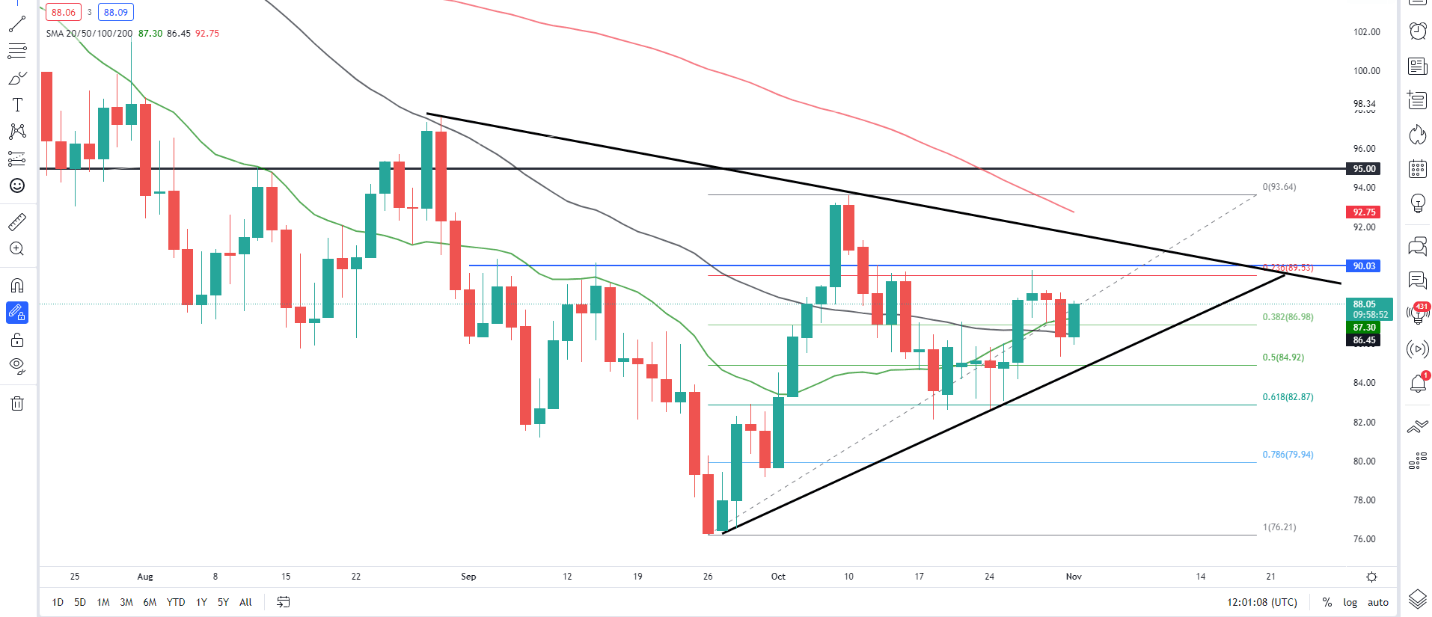
From a technical perspective, WTI arrested its slide on the monthly timeframe with its first month of gains since May. The positive month propelled the price back above the 20-SMA having dipped below it in September. The weekly reinforced the idea of higher prices with a bullish engulfing candle close above the 38.2% fib level.

The daily timeframe gives us a good view of the triangle pattern in play. A breakout could occur as early as this week given the host of data events expected. A bullish daily candle close should see price remain above the 20 and 50-SMA while maintaining momentum with the $90.00 psychological level back in play.

GBPUSD battles with descending trendline

GBPUSD has been in a prolonged downtrend since the beginning of the year, plummeting to an all-time low of 1.0324 in mid-September. Although the pair has been in a recovery mode since then and lately crossed above its descending trendline, its latest advance failed to strengthen further, with the pair retracing back to its bearish pattern.

The short-term oscillators are currently indicating a cautiously bullish near-term tone. Specifically, the RSI is hovering slightly above its 50-neutral mark, while the MACD histogram is softening above both zero and its red signal line.

To the upside, bullish actions could propel the price towards the recent resistance of 1.1645. Piercing through this region, the price could challenge the June support of 1.1763, which could now act as resistance. Even higher, the July peak of 1.2290 could curb any further advances before 1.2400 comes under examination.

Alternatively, should the positive momentum fade and the price reverse downwards, initial support could be met at 1.1260. Sliding beneath that floor, the bears might target 1.1060 before the spotlight turns to the October low of 1.0922. A violation of the latter could open the door for the all-time low of 1.0324.

Overall, GBPUSD appears to be losing steam after managing to break above its long-term restrictive trendline. Therefore, if the price falls again below the latter, the pair will most likely extend its downtrend, while a bounce to the upside could increase bulls’ bets for a sustained rebound.

USD/JPY Slips Back As Market Looks To Fed Chair Powell

USD/JPY, US Federal Reserve, Bank of Japan, Inflation—Talking Points

  • USD/JPY has seen record monthly levels of official intervention
  • However the Japanese Yen still lacks fundamental support
  • The Fed will provide near-term direction with markets expecting rate hikes, but less hawkish commentary

The Japanese Yen saw some modest gains in Tuesday’s trade in a market clearly settling down to hear what the United States Federal Reserve will do and, perhaps as importantly, say, at the end of its midweek meeting Wednesday.

The market is looking for another three-quarter point hike in US interest rates, the latest in a series aimed at bringing rampant inflation to heel. Assuming this is delivered, market attention will be firmly on the Fed’s tone. It’s widely expected by economists that the central bank will ratchet back from any aggressively hawkish commentary, emphasizing instead that future rate rises will depend squarely on how inflation now responds.

Rising US interest rates this year have of course lent the Dollar extraordinary support against all major currencies. The Yen has been particularly hard-hit, though with the Bank of Japan still unwilling to raise its own ultra-low borrowing costs. The resultant widening yield spread to the greenback’s advantage has seen USD/JPY rise back to levels around 150, not previously seen since 1990.

Japan’s Authorities Have Gone Big On Intervention

For their part, the Japanese authorities have opted to act in the market to try and cushion the Yen’s fall. Japanese Finance Minister Shunichi Suzuki reportedly said on Tuesday that the country’s interventions in the currency space have been ‘stealth operations’ in order to maximize their effects. This comment came after Tokyo spent a record $43 billion supporting the embattled Yen last month alone. It is likely to spend a lot more in the months ahead.

Long-serving Bank of Japan Governor Haruhiko Kuroda said on Tuesday that ultra-loose monetary policy must be retained to support a Japanese economy still struggling with the aftermath of Covid 19. With this in mind, the Yen looks likely to remain in the bears’ sights, at least while other central banks are tightening their own monetary screws. There may be some scope for a modest fightback if the Fed sounds more dovish than the market expects this week, but for now the Yen’s main fundamental hope probably lies in that aggressive but stealthy official intervention continuing.

USD/JPY Technical Analysis

The USD/JPY’s daily chart shows the pair has yet to recover from the strong falls seen at the end of last week, which were unusual and possibly bolstered by official action to bring the Dollar down a little.

Assuming that Dollar bulls are now on watch for this action on any approach to 150, the pair may well struggle for traction to the upside in the near term, although exploratory upward forays remain likely, targeting that key psychological level.

To the downside, meaningful support looks rather limited at current market levels, although a cluster of props from the trading action between September 6 and October 4 looks likely to guard the first, 23.6% Fibonacci retracement of the long rise up from the lows of August 2021 to last month’s historic peaks. That comes in at 141.611, the base of the red area on the chart, but the 142-145 region above it is likely to be sternly contested by Yen bears.

The market may return more durably to that region in a consolidation move before pushing on higher, however.

US data awaited ahead of tomorrow’s Fed decision

OVERNIGHT

Asian equity markets traded higher, led by the rebound in Chinese tech stocks, with the Hang Seng index gaining more than 5%. The Reserve Bank of Australia raised interest rates by 25bp to 2.85%, as expected. China’s Caixin manufacturing PMI rose more than expected but remained in contraction territory at 49.2 in October, likely reflecting ongoing economic dislocations from Covid lockdowns.

THE DAY AHEAD

Markets will likely be biding time ahead of policy updates from the US Federal Reserve tomorrow and the Bank of England on Thursday. The BoE’s active gilt sales (quantitative tightening) is scheduled to begin today. This morning’s UK October manufacturing PMI is expected to confirm the earlier ‘flash’ estimate showing output contracting for a fourth month in a row and a sharp deceleration in new orders. Due mostly to the drop in demand, the headline index fell to 45.8 from 48.4 in September, the weakest for 29 months during the early stage of the pandemic. Inflationary pressures eased slightly but remained elevated despite the weakening outlook for activity.

The US October ISM manufacturing survey is expected to fall towards the 50 no-change threshold. That would be broadly in line with the alternative S&P Global manufacturing PMI reading of 49.9 led by weakening demand and despite signs of improvement in supply chain disruptions. It would also be consistent with most regional Fed surveys. We forecast the ISM manufacturing to fall to 50.2 from 50.9 in September.x

Also out is US construction spending and the JOLTS survey. Construction spending in September is forecast to have contracted again on the back of a weakening housing market. Job openings, meanwhile, are expected to have fallen below 10 million in September for the first time since mid-2021, suggesting tentative signs of cooling of the buoyant labour market. The data releases are unlikely to change expectations for the Fed to raise interest rates by 75bp tomorrow.

MARKETS

US Treasury yields and the dollar edged lower overnight ahead of tomorrow’s Fed policy decision. The pound moved back above $1.15 and was marginally firmer against the euro. UK gilt yields closed higher yesterday but they remain well below levels during the aftermath of the mini-budget.