Japanese Yen Slips as New BoJ Governor Takes the Helm. Where to for USD/JPY?

Japanese Yen Slips as New BoJ Governor Takes the Helm. Where to for USD/JPY?

The Japanese Yen dipped on Monday and Tuesday with USD/JPY trading at its highest level since early January at 133.32.

The appointment of Kazuo Ueda to be the new Governor of the Bank of Japan (BoJ) on Tuesday was somewhat of a surprise.

His tenure will begin on April 8th when current Governor Haruhiko Kuroda steps down after serving two 5-year terms.

Little is known about Ueda’s approach to monetary policy and whether or not the current ultra-loose stance will be maintained.

The 71-year served several years on the bank’s board and is currently Professor at Kyoritsu University. Some commentators have been sceptical of an academic being assigned to the role, but former Finance Minister Eisuke Sakakibara espoused a positive view on Bloomberg television.

Known as Mr Yen for his respected stewardship during his term in office, Sakakibara said that Ueda knows the structure of the bank and he is likely to initially keep monetary policy steady.

He speculated that Ueda might raise rates in the fourth quarter, but it will depend on the state of the Japanese economy and if inflation remains around 2%, as he expects it to be.

Mr Yen said that there isn’t much worry about holding financial assets and that the sale of such assets was unlikely at this stage.

There has been some speculation that an eventual tightening by the BoJ may see a significant repatriation of funds by Japanese investors.

While this might be plausible, interest rates in other developed markets are hundreds of basis points higher. Given the relatively anaemic economic growth rate in Japan, the BoJ would need to be hyper-aggressive to get those levels quickly.

This would seem to risk snuffling out hopes of a recovery from the so-called ‘lost decades’ that have seen Japan’s Nikkei 225 equity index never eclipse the peak seen in 1990 due to a struggling economy.

So, while a tightening by the BoJ later this year is now on the radar, an aggressive change of policy might be a while off.

Nonetheless, USD/JPY could be in for a bumpy ride until the market has a firmer grasp of the new Governor’s intentions. If Japanese yields start heading north, it could have a considerable impact on the exchange rate.

USD/JPY TECHNICAL ANALYSIS

image1.png

EUR/USD Price Action Setup After US CPI

EUR/USD Price Action Setup After US CPI

After a choppy session, EUR/USD ended largely flat after US CPI data provided little cues on the future path of Fed policy, reasserting the broader consolidation backdrop in EUR/USD.

While consumer prices rose 6.4% on-year in January, the smallest rise since late 2021, but gained 0.5% on-month, a tad faster than the 0.4% expected. The US rate futures market continues to price in two more Fed rate hikes, in March and mid-2023. Hawkish remarks by Fed officials on Monday suggested the Fed isn’t close to pausing its rate hiking cycle. The key focus is now on US retail sales data which would provide some guidance on consumer spending amid lingering recession concerns.

EUR/USD Daily Chart

image1.png

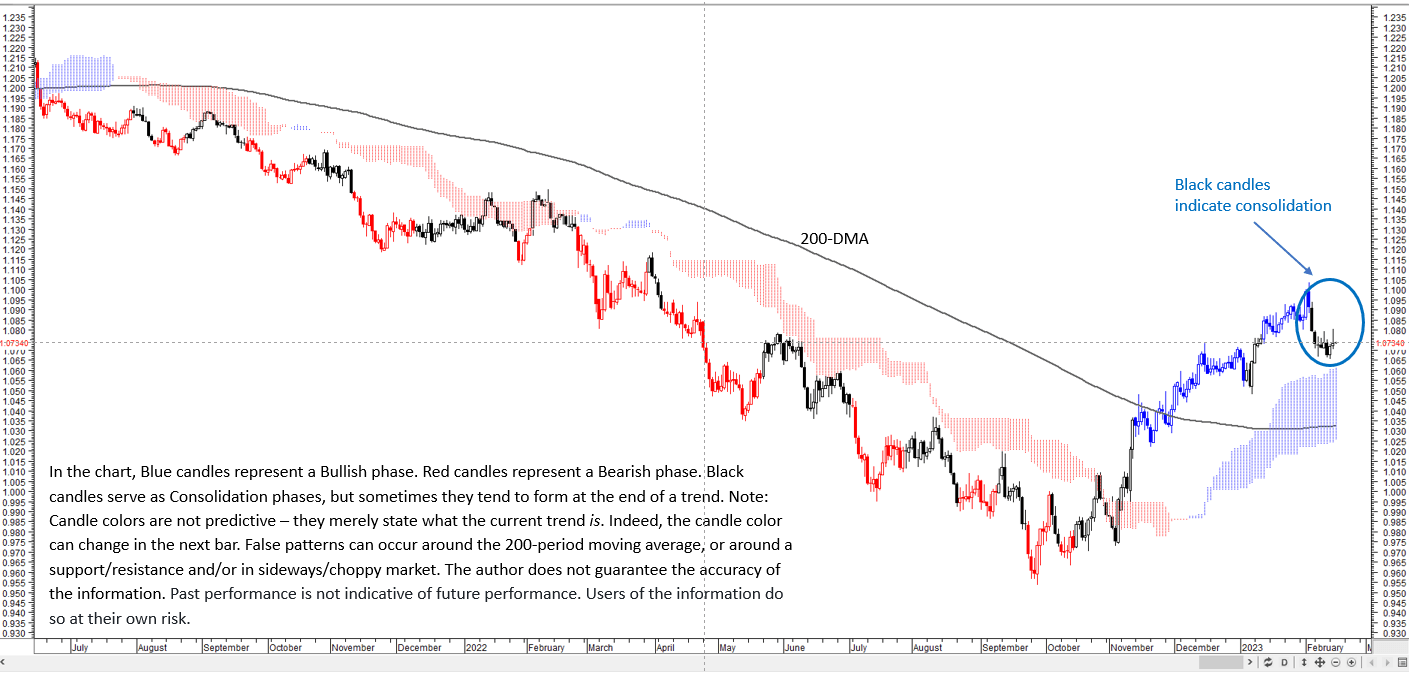
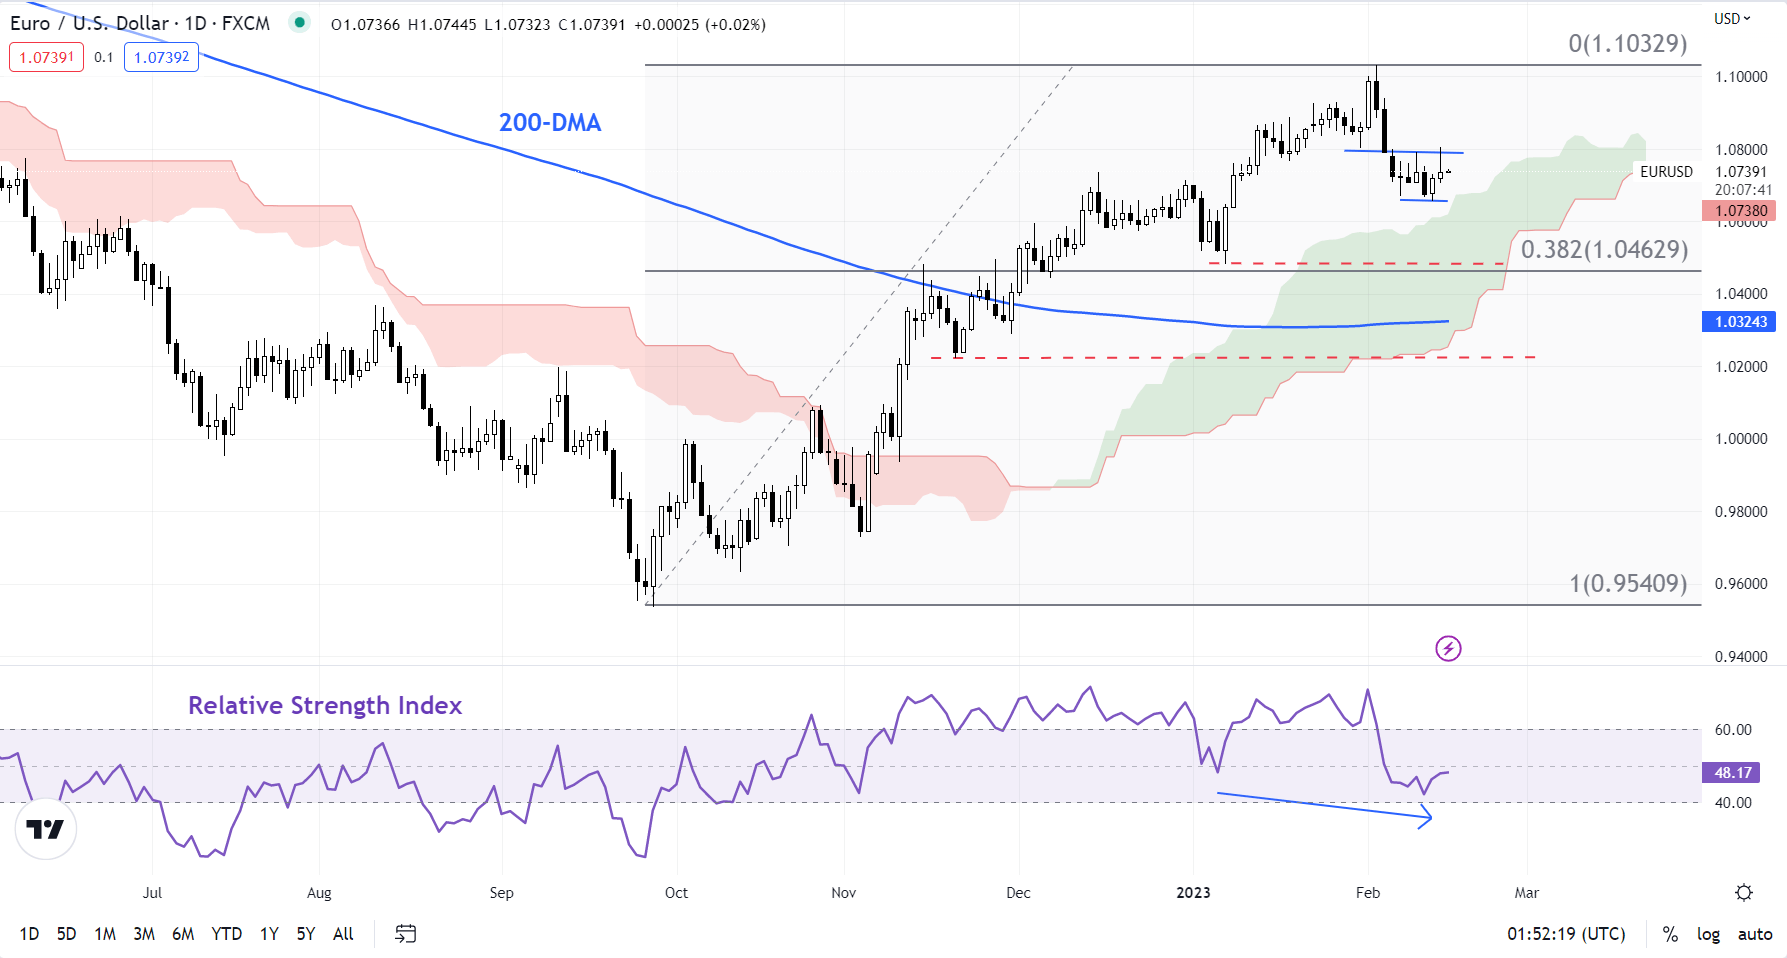
On technical charts, as the color-coded candles based on trending/momentum indicators suggest the overall trend remains up and the retreat this month is a consolidation within the uptrend (see “EUR/USD Technical Outlook: Short-term Setback”, published Feb. 6). Despite the retreat, EUR/USD hasn’t broken any significant price pivot yet, and the pair hasn’t yet retraced even a third of its gains since late 2022 – retracements of 38.2%-50% are considered to be reasonable, and don’t necessarily imply a reversal of the trend.

EUR/USD Daily Chart

image2.png

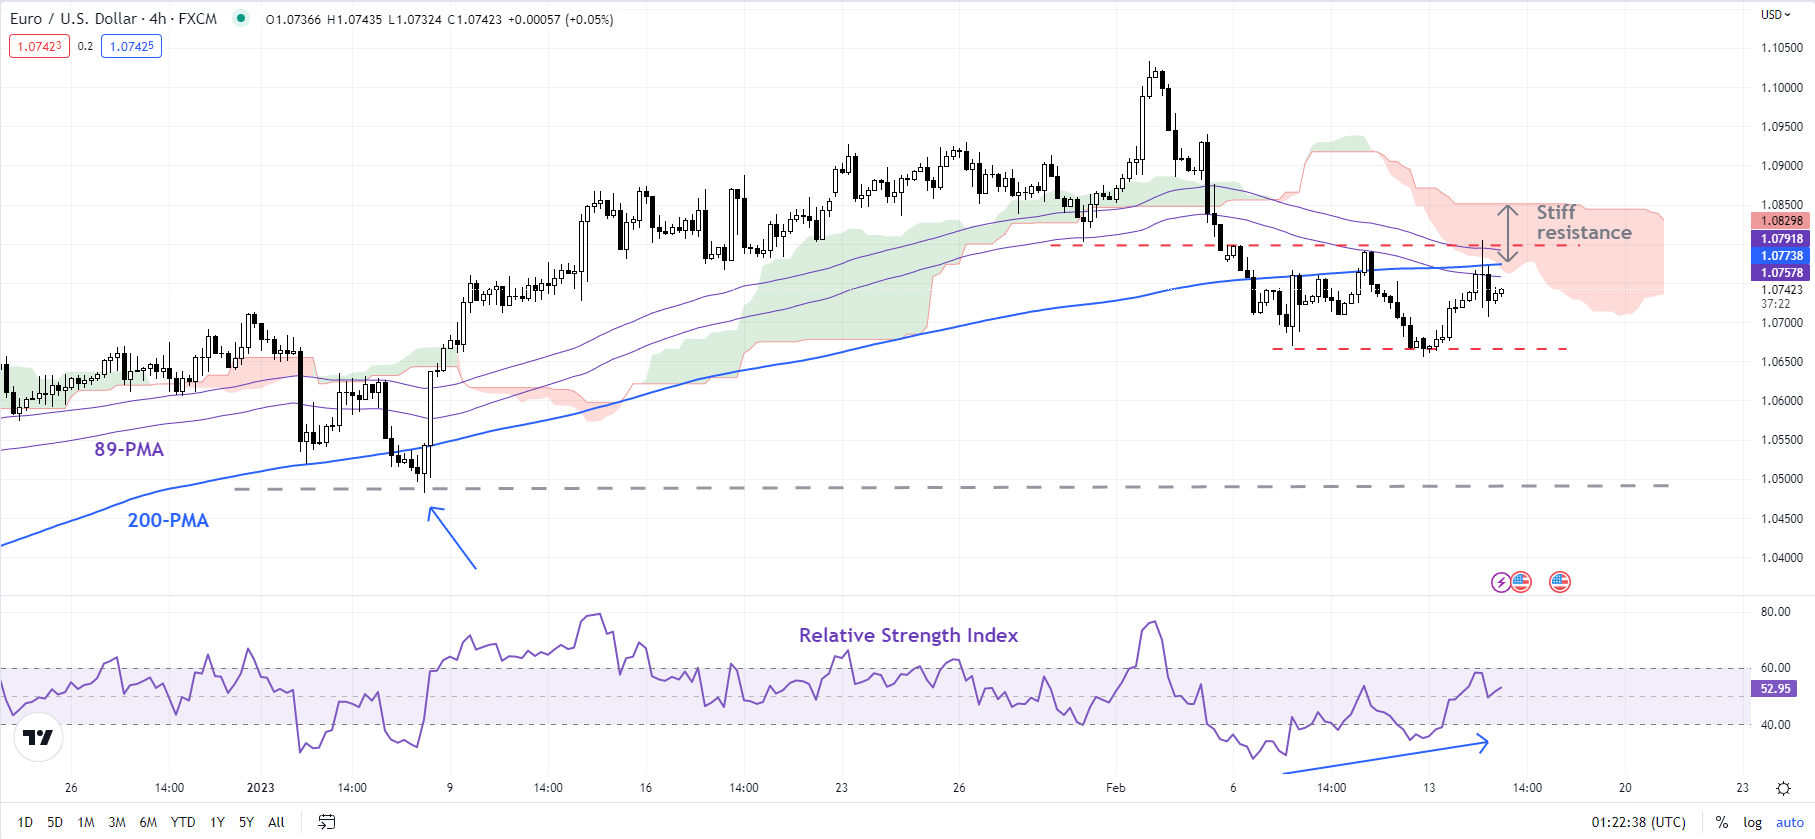
Most recently, EUR/USD has been hovering in a 1.0650-1.0850 range, also capped by the 200-period moving average on the 4-hourly charts. A potential positive momentum reversal – lower lows in the 14-day Relative Strength Index associated with higher lows in price – raises the prospect of a rebound in EUR/USD (see the daily chart).

Any break above the immediate resistance area of 1.0800-1.0850 could trigger a minor double bottom (the February lows), opening way toward 1.0950. Importantly, the breakout would confirm the immediate downward pressure was fading.

EUR/USD 4-Hour Chart

image3.png

On the downside, there is immediate support at the lower end of the recent range of 1.0650. Subsequent support is at the January low of 1.0480. Strong support is on the 200-day moving average (now at about 1.0320). The uptrend since late 2022 is unlikely to reverse while EUR/USD holds above the long-term moving average.

US dollar

US Dollar Trades Up Post CPI Beat as Markets Grapple Fed Hikes. Higher USD?

The US Dollar is firmer today heading into the European session after yesterday’s US CPI data overshot the mark. The headline number came in at 6.4% y/y rather than 6.2% due to an upward revision in the December read.

The January increase in prices of 0.5% m/m hit forecasts but the December number was upped from -0.1% m/m to 0.1%.

Three Federal Reserve speakers took to the podium with two of them sticking to the script of rates need to go higher and stay there for a while but one

Richmond Fed President Thomas Barkin and New York President John Williams kept their hawkish credentials intact while Philadelphia Fed President Patrick Harker appeared slightly dovish. He said that once the target rate is above 5% it will depend on the data for further hikes.

At the end of the day, the market added to the odds of a third 25 basis point lift in this cycle. While the March and May meetings already have a lift baked in, the June gathering is now live for a potential tightening of policy.

Treasury yields across the curve marched higher with notes in the 1-to-5-year part of the curve notching up the largest gains. The 2s 10s yield curve inversion tracked down to its lowest level since 1980. A concerning harbinger of a potential recession.

The higher interest rates underpinned the US Dollar, and the Australian Dollar has been the largest loser

Reserve Bank of Australia (RBA) Governor Philip Lowe testified in front of the Senate estimates committee today. The questioning was largely as anticipated around the timing of successive rate hikes from pandemic-induced lows, and he wasn’t drawn to any possibly inflammatory remarks.

USD/JPY is trading at its highest level since early January after visiting 133.32 overnight. It remains above 133.00 at the time of going to print as the markets digest yesterday’s announcement that Kazuo Ueda will be the new Governor of the Bank of Japan (BoJ).

APAC equity indices are a sea of red and futures are pointing toward a sift start for Wall Street later today.

Crude oil is a touch weaker with the WTI futures contract under US$ 78.50 bbl while the Brent contract is below US$ 85 bbl.

Looking ahead, after UK inflation data, the US will retail sales data.

DXY, (USD) INDEX, 2-YEAR AND 10-YEAR TRESUTIES AND 2s 10s CURVE

image1.png


Gold Prices Looked Past an Inflation Beat, But Broader Outlook Remains Bearish

Gold Prices Looked Past an Inflation Beat, But Broader Outlook Remains Bearish

Gold prices finished the past 24 hours relatively flat as critical competing headlines fought for the attention of the yellow metal. First, all eyes were on January’s US CPI report. Headline inflation clocked in at 6.4% y/y against the 6.2% estimate. This was also higher than a prediction I made using a lag analysis model. Still, it was within the error region. More importantly, the model sees February CPI at 6.3% y/y.

Combined with a stronger-than-anticipated core reading, this is not terribly great news for the Federal Reserve, which is trying to bring inflation down to a medium-term average target of about 2%. Financial conditions have been easing since the end of last year as markets priced in the conclusion of the tightening cycle and then some (in the form of anticipated rate cuts towards the end of this year).

Including today’s CPI report, markets have added about 3 rate hikes to the 2-year outlook since the day before January’s non-farm payrolls report blowout. As a result, the 2-year Treasury yield has rallied almost back to highs from November. This is as the US Dollar found some support. Unsurprisingly, this combination has not been working out great for gold.

Despite the unexpectedly sticky CPI report, gold prices were relatively mute. That is likely due to Fedspeak. Philadelphia Fed President Patrick Harker noted on Tuesday that the central bank was zeroing in on where rates could be restrictive enough – a sign that peak rates might be soon around the corner. But, he also added that the Fed might have to do more.

Put together, this likely points to a Fed that might keep rates restrictive for longer. Despite what occurred with gold over the past 24 hours, down the road, this may continue spelling more trouble for the anti-fiat yellow metal. Later today, the US will release January retail sales. Solid outcomes could risk adding further downside pressure to XAU/USD.

Gold Technical Analysis

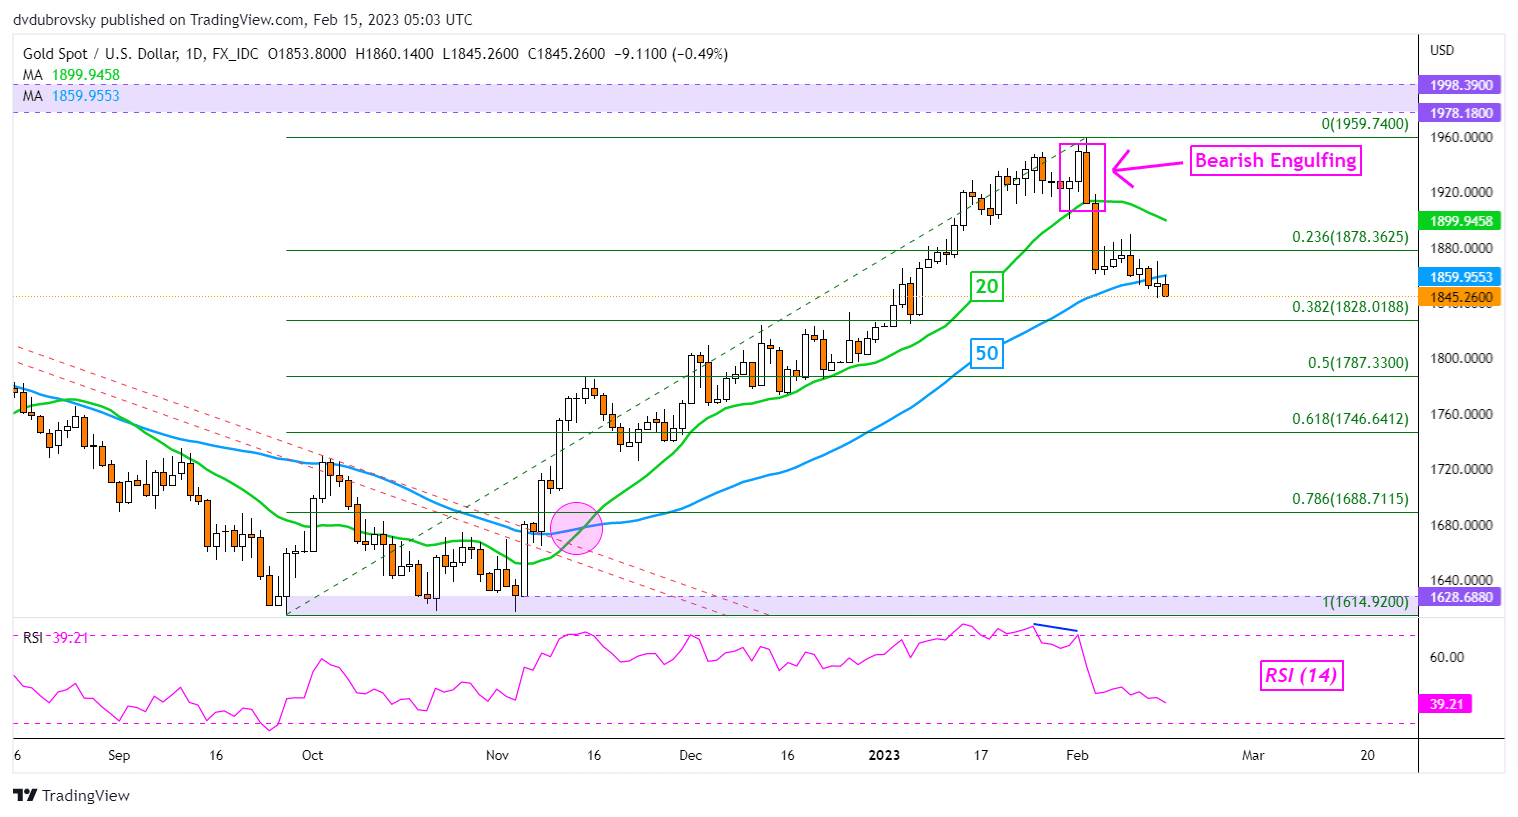
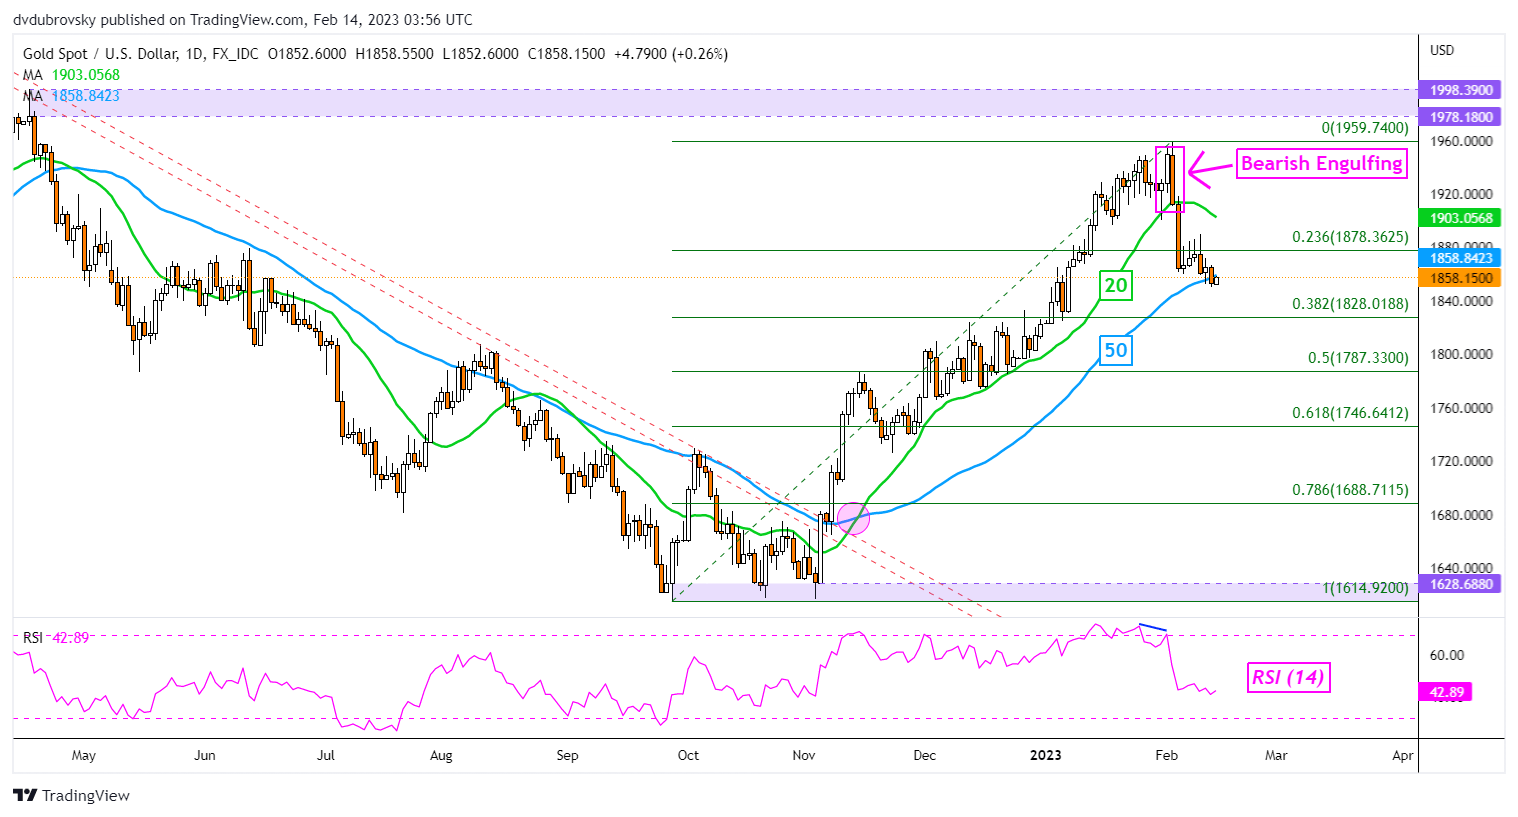
On the daily chart, gold is trying to extend losses under the 50-day Simple Moving Average (SMA). That is offering an increasingly bearish perspective, placing the focus on the 38.2% Fibonacci retracement level at 1828. In the event of a turn higher, the 20-day SMA could hold as resistance, maintaining the near-term downside focus.

XAU/USD Daily Chart

image1.png

SAFE deposit account – earn up to 20% per annum with LiteFinance

SAFE deposit account – earn up to 20% per annum with LiteFinance

Use SAFE account to earn up to 20% on your deposit per annum

Make profits in your trading accounts and pay free money into a SAFE deposit account to earn interest. Earn up to 20% per annum. The interest rate is floating, depending on your trading volumes.

What is a SAFE account?

SAFE is a non-trading savings account that LiteFinance’s client can open and top up to earn interest.

The profit and interest you can earn in a SAFE account is higher than at a bank.

Open a savings account with LiteFinance and earn up to 20% per annum. Interest payments are made every day!

SAFE benefits

  • Deposit account in US dollars
  • Floating rate, up to 20%
  • Interest rate depends on your trading volume
  • Daily interest payments
  • No minimum or maximum deposit limits
  • Withdrawals at any time

How does a SAFE account work?

  • The client tops up their SAFE account in the Client Profile area using a transfer from their trading accounts or any available payment system.
  • The client trades every day or copies trades in their trading account with LiteFinance
  • The interest rate is subject to the trading volume the client accomplishes in their trading accounts
  • The interest on the money held in a SAFE account is calculated and paid every day

How is a floating interest rate calculated?

Deposit interest depends on the client’s trading volume accomplished in their trading accounts.

The maximum interest rate is 20%.

Floating Interest Rate (FIR,% per annum) is calculated daily according to the formula:

FIR% = (K × L) / T, where

K is the company’s participation factor set at 10.1

L is the number of lots traded and completed in the past 30 days in the client’s trading accounts

T is the current deposit in a SAFE account increased by 5%

The client receives an interest payment daily based on the annual interest rate calculated. The daily interest payment is calculated as follows:

DailySUM = ((Balance × FIR%)/100) / 360, where

Balance – SAFE account minimum balance on the previous day, for which a daily payment is calculated.

How is deposit interest % generated?

To earn higher interest, the client needs to trade actively. The more lots the client trades, the higher their floating interest rate is.

Australian Dollar Trends Remain Intact Despite Some Stalls. Where to for AUD/USD?

Australian Dollar Trends Remain Intact Despite Some Stalls. Where to for AUD/USD?

AUD/USD TECHNICAL ANALYSIS

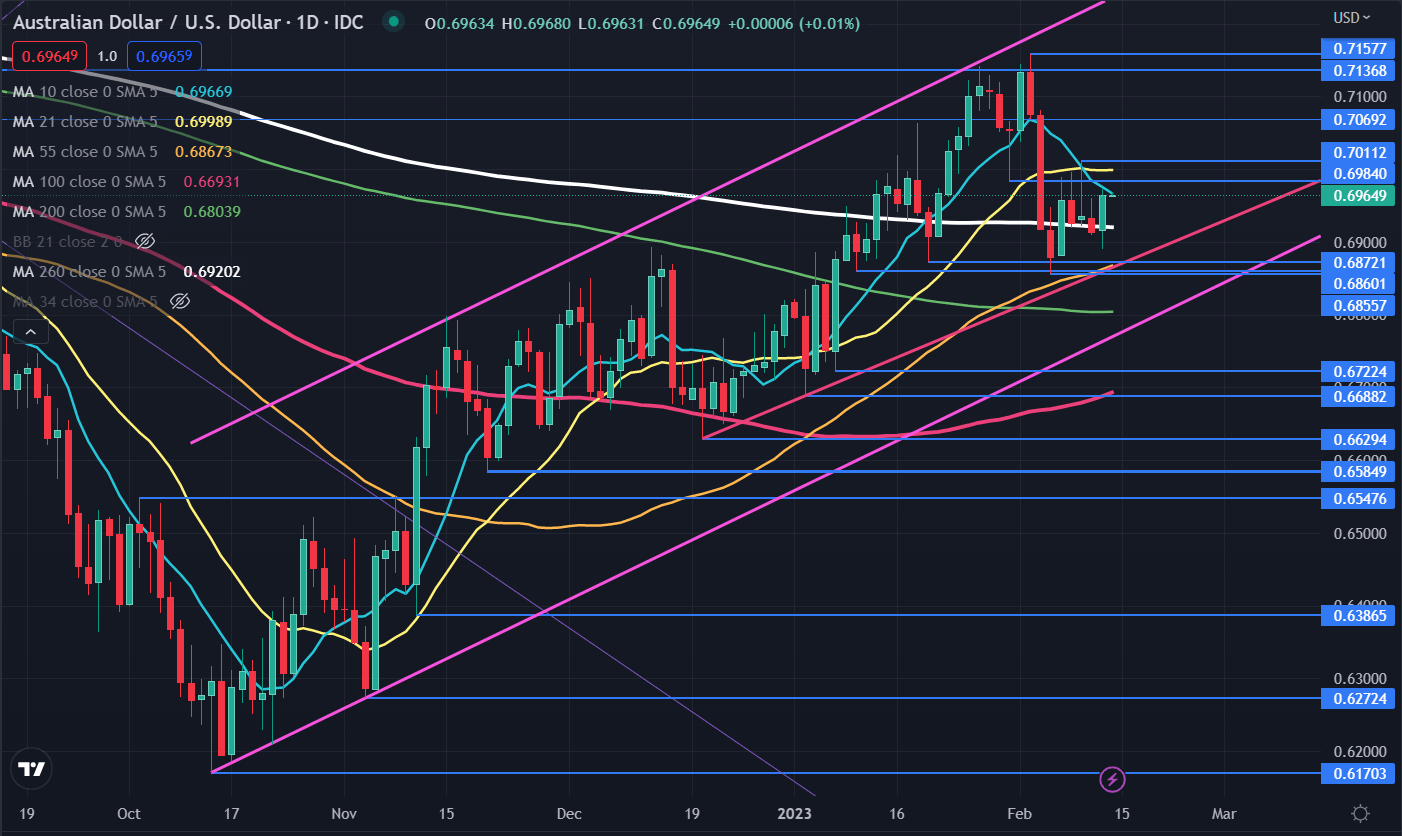
The Australian Dollar has steadied this week and it remains within an ascending trend channel.

AUD/USD had a look lower last week as it briefly dipped below 2 previous lows, but it was unable to sustain the bearish tilt.

That move also went below the long-term 260-day simple moving average (SMA). The inability to follow through could suggest that the dip has been rejected for now.

This has set up a potential support zone in the 0.6855 – 0.6870 area which currently coincides with a short-term ascending trend line and the 55-day SMA.

Further down, support might be at the 200-day SMA which is currently near the psychological level of 0.6800.

Below there is a longer-term ascending trend line at 0.6750 ahead of the previous lows of 0.6722 and 0.6688. The 100-day SMA lies between those price points and may lend support.

On the topside, resistance could be offered at the breakpoints and prior peaks of 0.6984, 0.7011, 0.7137 and 0.7158. The latter is the 12-month high that failed to break the topside of the ascending trend channel. That line might continue to provide resistance, currently dissecting at 0.7240.

Looking at momentum, the SMAs could indicate some sideways price action with a possible slight bullish bias. While the price is above the medium and long-term 55-, 100-, 200- and 260-day SMAs, it is below the short-term 10- and 21-day SMAs.

AUD/USD DAILY CHART

image1.png

AUD/JPY TECHNICAL ANALYSIS

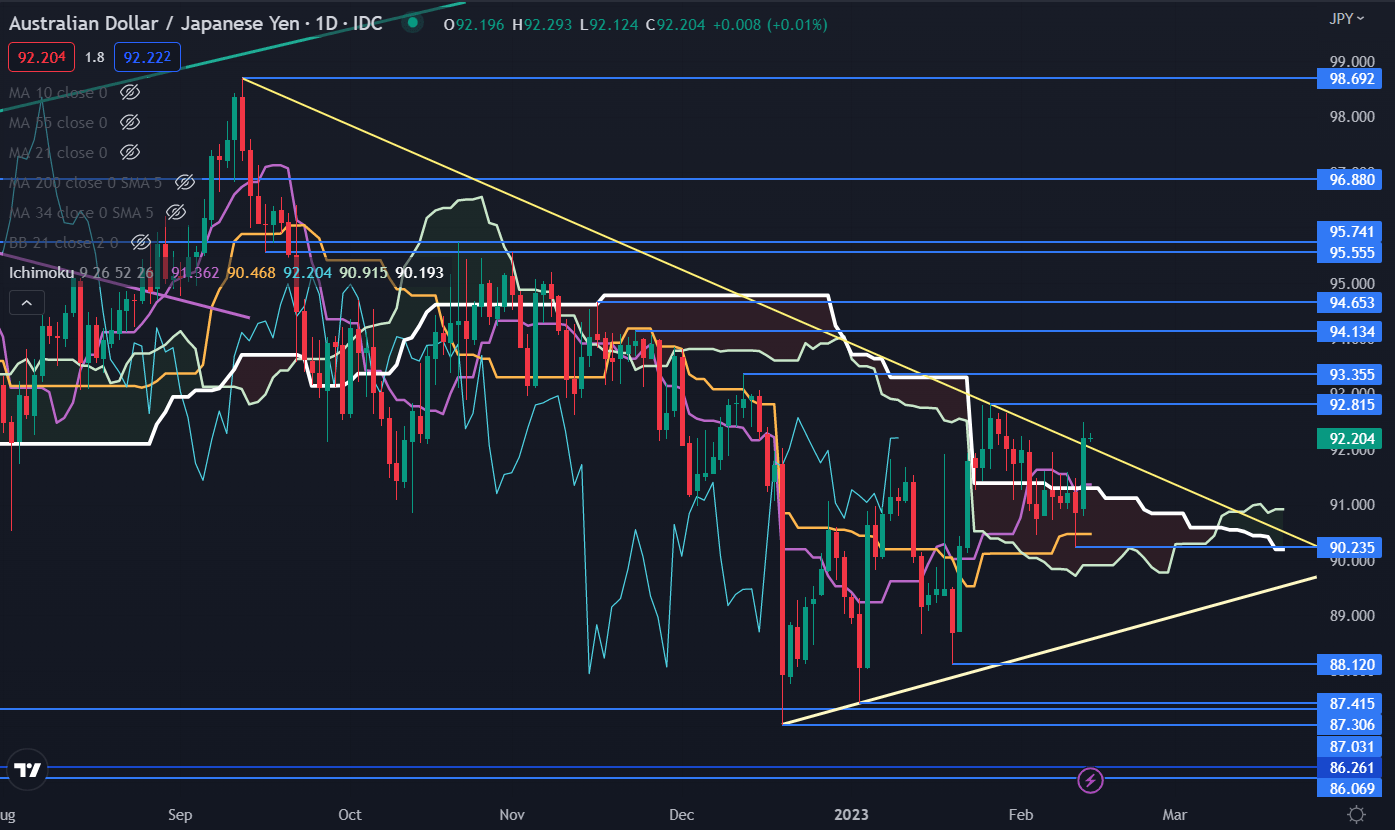
AUD/JPY has broken above a descending trend line and made a 2-week high overnight.

If it remains above the trend line, it may indicate that bearish momentum is fading, and a possible reversal could unfold.

The price once again moved above the Ichimoku Kinko Hyo, which is often referred to as the Ichimoku Cloud, which might suggest that bullishness may evolve.

A move back below the Senkou Span A (Leading Span A) could question the bullish slant.

Resistance might be at the previous peaks of 92.82, 93.36, 94.13 and 94.65.

On the downside, support may lie at the prior lows of 90.23, 88.12, 87.41, 87.30 and 87.03. An ascending trend line could provide support, currently at 88.60.

AUD/JPY DAILY CHART

image2.png


US Dollar Price Action Setups: EUR/USD, AUD/USD, USD/JPY, GBP/USD

US Dollar Price Action Setups: EUR/USD, AUD/USD, USD/JPY, GBP/USD

EUR/USD Daily Chart – Rising Wedge Breakout Still in Focus

The Euro may remain vulnerable to the US Dollar from a technical standpoint. That is because last week, EUR/USD continued to make downside progress after clearing under a Bearish Rising Wedge chart formation. Immediate support is the 23.6% Fibonacci retracement level at 1.068, which was reinforced over the past 24 hours as prices were unable to clear this floor. Further upside progress, especially through the 1.0713 – 1.0787 inflection zone, would place the focus on the floor of the wedge. Otherwise, extending losses exposes the 38.2% level at 1.0461.

EUR/USD Daily Chart – Rising Wedge Breakout Still in Focus

AUD/USD Daily Chart – Head & Shoulders Brewing

The US Dollar could be readying to extend gains against the Australian Dollar. In addition to a Rising Wedge, a bearish Head & Shoulders chart formation is brewing on the daily chart below. The neckline seems to have been reinforced around 0.6893. A confirmatory breakout under this price could open the door to extending losses toward the 100-day Simple Moving Average (SMA). Otherwise, pushing above 0.7009 – the right shoulder – opens the door to revisiting the January high where key resistance stands around 0.7137.

AUD/USD Daily Chart – Head & Shoulders Brewing

USD/JPY Daily Chart – Trendline Breakout Remains in Focus

The US Dollar remains higher against the Japanese Yen since USD/JPY broke above the falling trendline from the end of last year. Still, the 50-day SMA is holding as critical resistance, maintaining the broader downside focus. A confirmatory push above the 23.6% Fibonacci retracement level at 133.05 would likely offer an increasingly bullish outlook, placing the focus on the 38.2% Fibonacci retracement level at 136.66. Otherwise, a turn lower places the focus on the January low at 127.22.

USD/JPY Daily Chart – Trendline Breakout Remains in Focus

GBP/USD Daily Chart – Prices Bounce off Double Top Neckline

The US Dollar continues consolidating against the British Pound. GBP/USD recently bounced off the neckline of a Double Top chart formation around 1.1951. This followed an emergence of a Doji candlestick pattern, which showed indecision as prices hit support on the way down. That has opened the door for prices to revisit the critical 1.2293 – 1.2444 resistance zone. Key resistance is the 50-day SMA. Clearing the latter opens the door to face last month’s high. Otherwise, breaking under the neckline exposes the 100-day SMA.

GBP/USD Daily Chart – Prices Bounce off Double Top Neckline


Natural Gas Price Setup: Is it Beginning to Build a Base?

Natural Gas Price Setup: Is it Beginning to Build a Base?

NATURAL GAS PRICE SETUP

It may be too soon to conclude that the worst for US natural gas prices is over. But a minor rebound or an extended range is plausible in the interim.

To be sure, beyond the hourly timeframes, the trend remains down across multiple timeframes. Indeed, as arecent update highlighted, a major double-top pattern (the 2022 highs) triggered at the end of last year points to further downside, potentially toward the 2020 low of around 1.45 (see weekly chart).

Natural Gas Weekly Chart

image1.png

Moreover, zooming in on the 240-minute charts, there is very little evidence to suggest that natural gas prices are reversing their bearish course. However, tentative signs of an extended consolidation have started to emerge recently.

Natural Gas 240-minutes Chart

image2.png

ays are a sign that attempts by bulls to push prices higher have been unsuccessful so far. Despite that prices haven’t made a new low in recent days, unlike the pause in January (where the price had a bearish bias within the range).

Natural Gas Daily Chart

image3.png

Given oversold conditions on higher timeframe charts, and improving upward momentum on lower timeframe charts, the recent price action could be a precursor to the start of an extended pause in the slide, or perhaps a minor rebound.

As the 240-minute chart shows, natural gas has been in a sideway range of 2.35-2.65 since the start of the month. Any break above the immediate barrier at 2.65-2.75 (including the Ichimoku cloud on the 240-minute charts) could pave the way toward the 200-period moving average (at about 3.20).

Gold Prices Turn to US CPI Report, Will Softer Inflation Rekindle XAU/USD?

Gold Prices Turn to US CPI Report, Will Softer Inflation Rekindle XAU/USD?

Gold prices sank about 0.6 percent on Monday, extending losses from last week. The anti-fiat yellow metal inversely tracked a boost to 2-year Treasury yields during the first half of the day. XAU/USD can be quite sensitive to the direction of US Treasury rates. That is because of gold’s inherent lack of return for holding the precious metal, compared to something that either pays a dividend or yield.

Over the past 24 hours, it seems traders were focused on a survey from the Federal Reserve Bank of New York on consumer anticipation. Specifically, median anticipated growth in household income was seen falling 1.3 percentage points to 3.3% as of January. But, respondents continue to see inflation elevated, unchanged at 5%. That would speak to deteriorating real incomes and more signs that people are feeling discouraged about beating inflation.

Markets rallied on the news, with the Dow Jones, S&P 500 and Nasdaq 100 finishing in the green. The tech sector outperformed. From this perspective, if people believe wage growth will slow, that could be another sign that further disinflation could be in store for the economy. Although, there could also be a debate about stagflation instead.

For gold, this matters because over the remaining 24 hours, January’s US CPI report will cross the wires. Headline inflation is seen slowing further to 6.2% y/y from 6.5%. For those interested, I created a model that tries to predict CPI using lag analysis. The model has a slight bias to a downward surprise. Such an outcome may further boost year-end Fed pivot bets. If that sends the US Dollar and bond yields lower, gold could be looking at a green day.

Gold Technical Analysis

On the daily chart, gold broke under the 50-day Simple Moving Average. Confirmation is lacking at this moment, but further downside progress would open the door to extending a reversal of the uptrend from November. Otherwise, a turn higher places the focus on the 20-day SMA. The latter could hold as resistance, maintaining the near-term downside focus.

XAU/USD Daily Chart

XAU/USD Daily Chart

Gold Price Setup Ahead of US CPI: Bear Flag Hints at Further Downside

Gold Price Setup Ahead of US CPI: Bear Flag Hints at Further Downside

Gold Selloff Stagnates Ahead of Major Event Risk: US CPI

The weekly gold chart shows a marked slowdown in the gold selloff, particularly last week which produced a doji candle – representative of indecision in the market. Reluctance to push higher above the 1910 zone was evident via the multiple upper wicks on the weekly candles which ultimately resulted in a massive swing lower.

Gold (XAU/USD) Weekly Chart

image1.png

The daily chart shows the massive selloff which ensued the day after the FOMC which continued after a massive beat in US jobs data and stellar PMI ‘new orders’ data. The double hit of optimism caused a knock-on effect which resulted in more hawkish repricing in dollar-linked assets and gold was no different.

With the market bidding up the value of the dollar and US treasury yields – particularly the 2-year yield – gold became relatively less attractive as it does not provide a yield.

In the days that followed the massive selloff, gold prices produced what appears to be a bear flag, as bulls attempted to regain some lost ground. There is still a fair distance to go if we are to see this pattern fill out but a continued grind lower suggests a move towards the 200 simple moving average (SMA) at 1775 cannot be ruled out.

However, bears will have to push prices past the psychological 1800 level first. Risks to the bearish gold outlook appear in the form of US CPI at 13:30. If the rate of disinflation increases and we get a surprise to the downside, there may be another round of dollar repricing, but this time to the downside which could support gold in the short-term. Resistance lies at 1875, followed by 1910/1915.

Gold (XAU/USD) Daily Chart

image2.png