Natural Gas Price Forecast: 7 Weeks of Losses, Momentum Shows Few Signs of Slowing

Natural Gas Price Forecast: 7 Weeks of Losses, Momentum Shows Few Signs of Slowing

Weekly Chart – Prices Plunge for a 7th Week

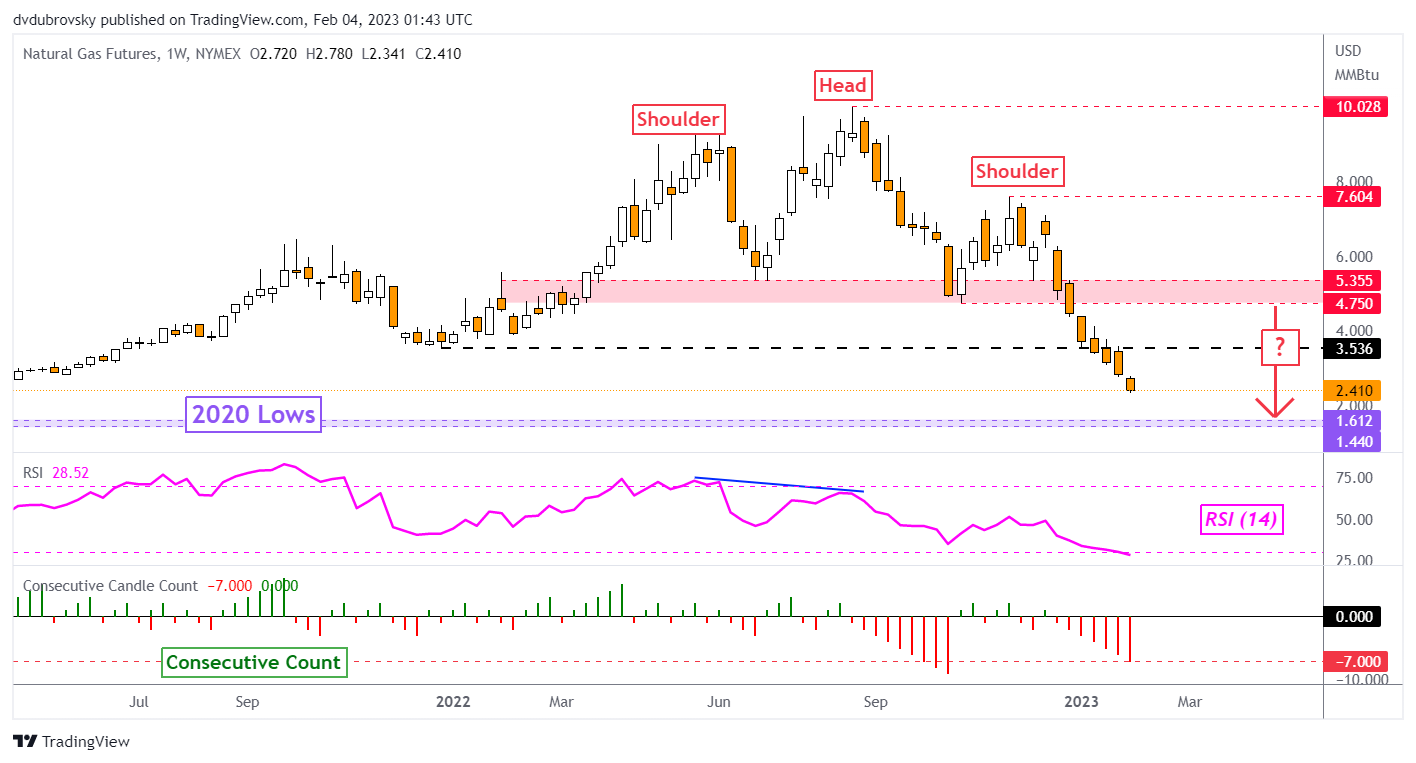
Natural gas prices are down 46.15% since the beginning of this year. If losses hold throughout February, the heating commodity will be looking at its worst 2-month performance since 2001! This past week alone was the 7th consecutive decline, marking the longest losing streak since the beginning of October. Natural gas fell 15.41% last week amid a milder United States weather upgrade.

Looking at the chart below, prices are continuing lower in the direction of the bearish Head & Shoulders implied target. If natural gas follows the outlook of the chart formation, we could see prices reach lows from 2020. That makes for a range of support between 1.44 and 1.61. Let us take a closer look at the daily chart to see what are key levels to watch in the week ahead.

Weekly Chart – Prices Plunge for a 7th Week

Chart Created Using TradingView

Daily Chart – Another Doji Emerges

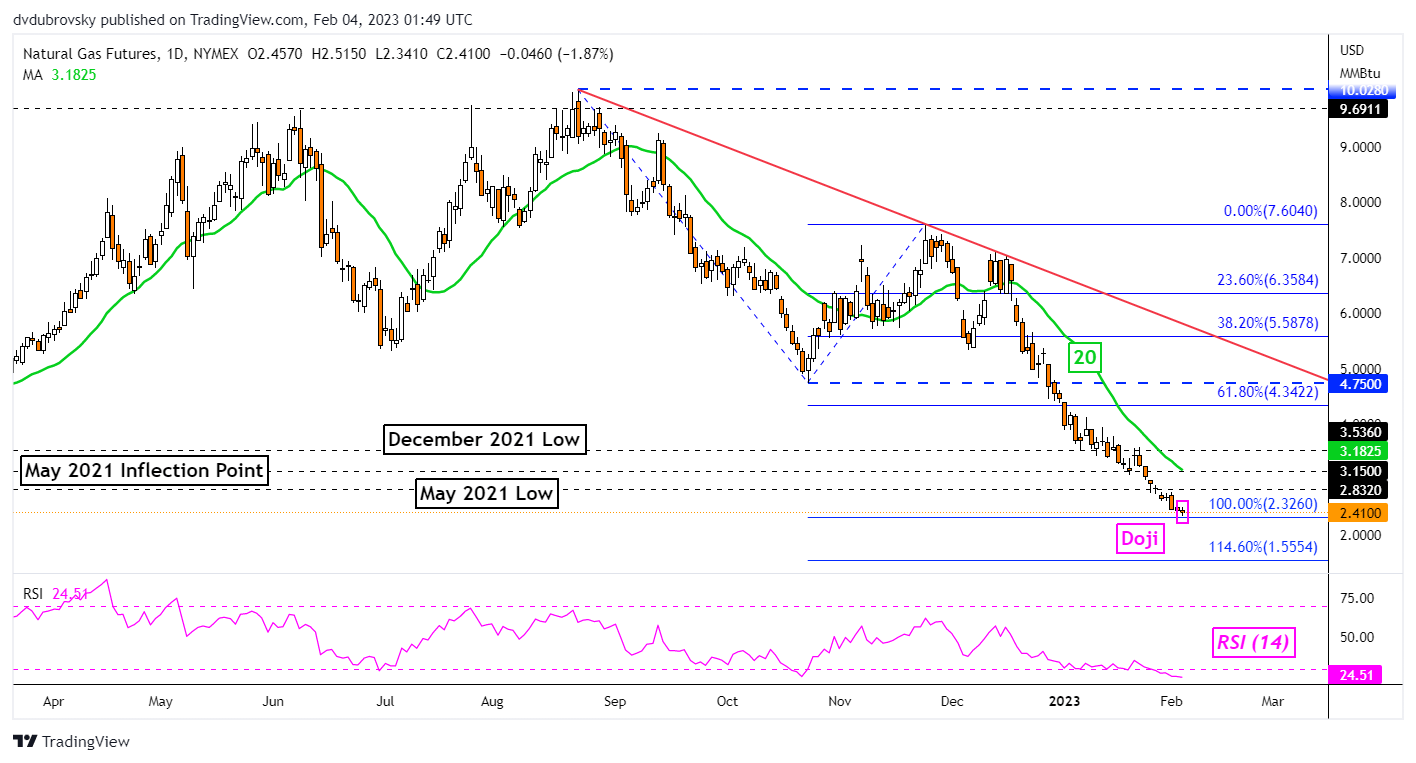
Another Doji candlestick pattern made itself present after prices closed on Friday. This is not the first time we have seen a Doji in a while. In fact, something like the latter has appeared on numerous occasions throughout the most recent downtrend since December. The Doji is a sign of indecision, not necessarily a reversal warning.

What matters is after the Doji. Upside follow-through could be an increasing sign of a turn higher. At this time, momentum is favoring the downside given a lack of RSI divergence. Prices now face immediate support which is the 100% Fibonacci extension level at 2.326. A confirmatory breakout under this price exposes the 114.6% level at 1.555.

In the event of a turn higher, keep a close eye on the 20-day Simple Moving Average (SMA). The latter is helping maintain the near-term downside focus. It may hold as resistance, pivoting natural gas back lower. Otherwise, extending gains would place the focus on the December 2021 low at 3.536. The latter may establish itself as new resistance.

Daily Chart – Another Doji Emerges

EUR/USD Forecast: No Let Up for Euro Post-NFP, What Fed Pivot?

EUR/USD Forecast: No Let Up for Euro Post-NFP, What Fed Pivot?

EURO FUNDAMENTAL BACKDROP

The euro really suffered at the hands of the USD last week post-Non-Farm Payrolls (NFP) which showed a significant rise in jobs (517000) for January over the expected figure (188000) thus reinforcing the tight labor market in the U.S..

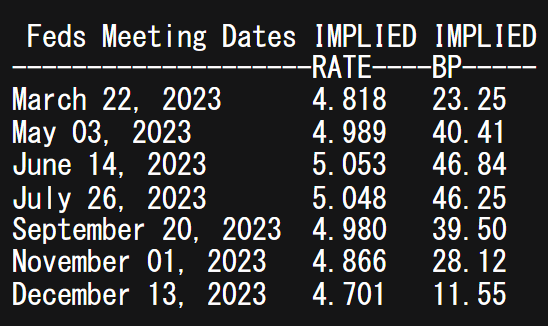
Money markets have already pushed the 2023 Fed terminal rate up above 5% for the first time in many weeks (see table below), now underpinning what the Fed has been saying all this time? Leading up to the Fed’s interest rate decision last week, guidance from the majority of Fed officials have been rather hawkish with frequent reference to the 5% mark however, at the time markets had dismissed any such counsel leaving upbeat releases on data points open to large upward swings in the greenback.

FEDERAL RESERVE INTEREST RATE PROBABILITIES

image1.png

The day ahead looks to be centered around the eurozone with retail sales data and yet another address from the ECB’s President Christine Lagarde. It is likely we will receive more aggressive talk from Lagarde citing higher core inflation and growth(GDP) forecasts within the region but it could be too early to impact a surging dollar.

EUR/USD ECONOMIC CALENDAR

image2.png

Source: DailyFX economic calendar

Throughout the week, attention will be largely directed to Fed officials who are scheduled to speak throughout. Hawks will surely come out in force but it will be interesting to see how less aggressive individuals react to the recent data.

This Monday also involves a hint of risk-off sentiment stemming from U.S.-China tensions after the U.S. shot down an alleged Chinese spy balloon so it will be important to monitor the situation closely as any further escalation could bolster the greenback.

TECHNICAL ANALYSIS

EUR/USD WEEKLY CHART

image3.png

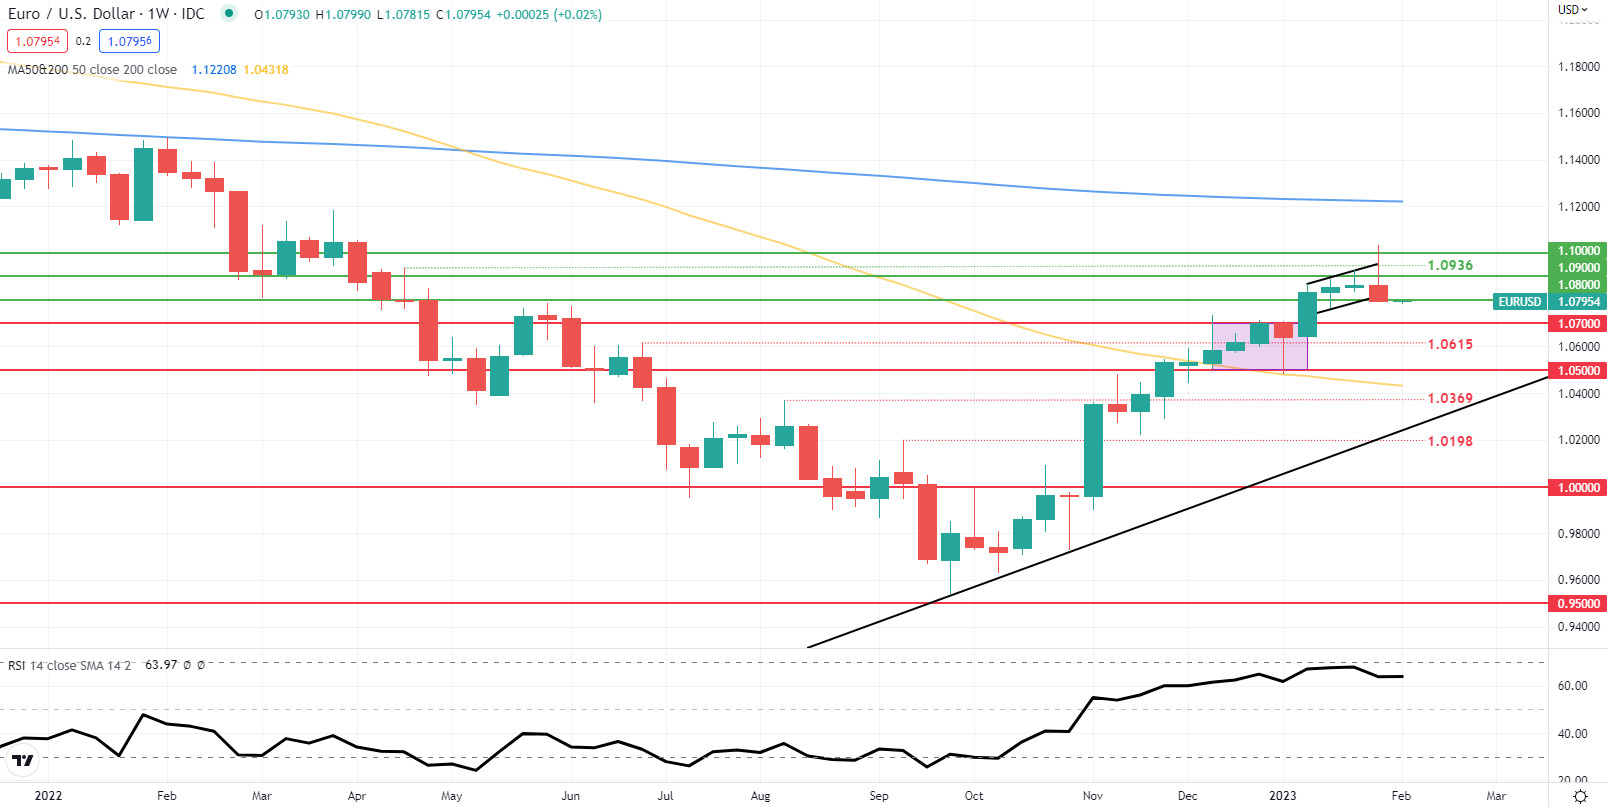
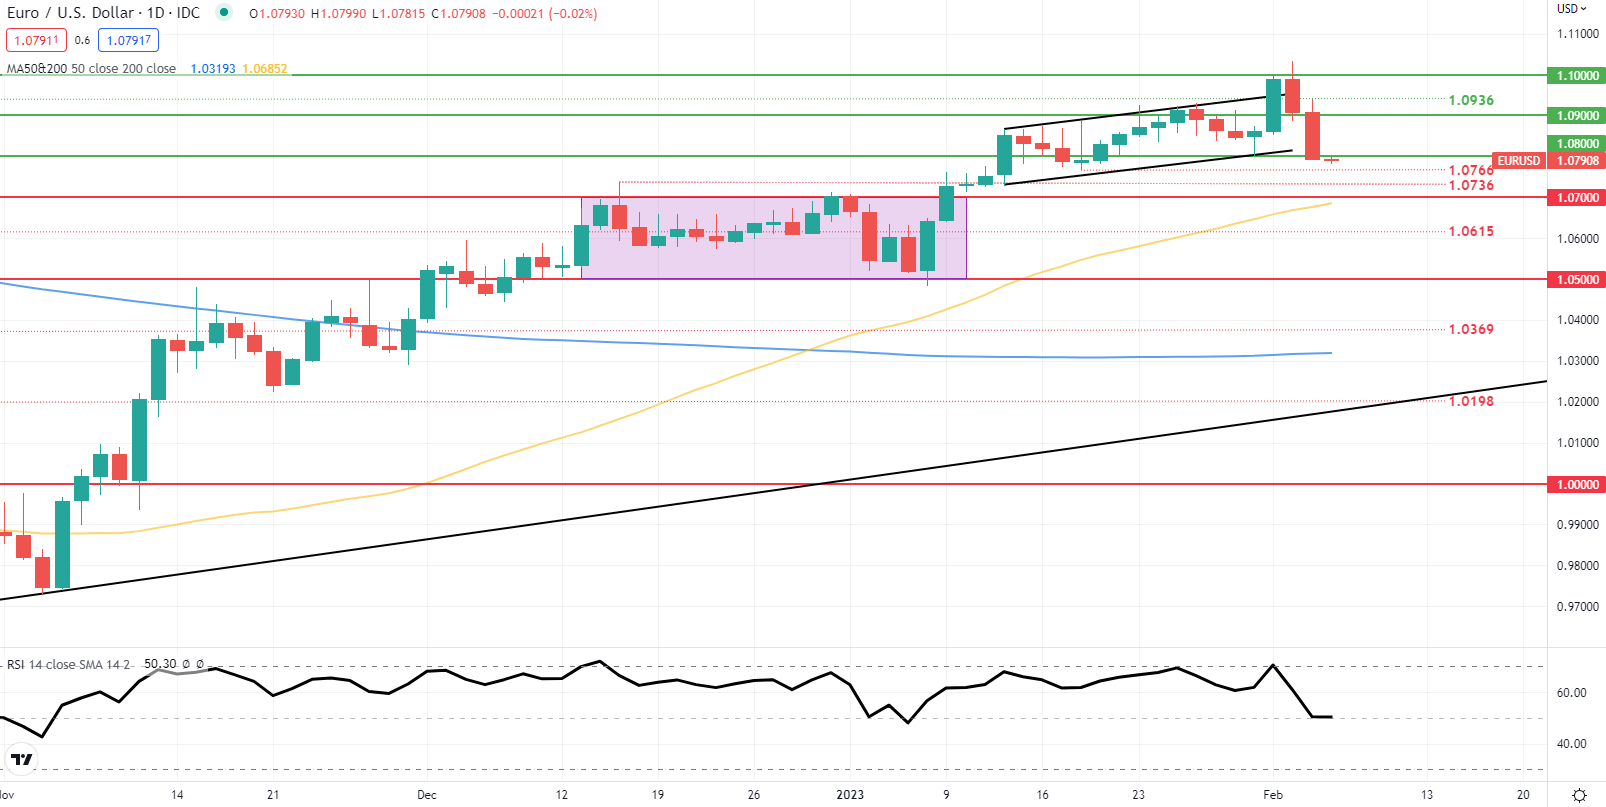
The EUR/USD weekly chart above shows price action hovering around overbought territory as indicated by the Relative Strength Index (RSI). Last week’s candle closed with a long upper wick that traditionally points to subsequent downside leaving support zones in danger of being breached.

EUR/USD DAILY CHART

image4.png

The shorter-term daily chart emphasizes the recent break below the 1.0800 psychological handle and today’s candle close could point to a near-term directional bias. A close below 1.0800 could find the euro slipping down towards 1.0700 and possibly testing the 50-day SMA as well (yellow).

US Dollar Blazes Higher on Solid Data as Geopolitics Play Out. Where to for USD?

US Dollar Blazes Higher on Solid Data as Geopolitics Play Out. Where to for USD?

The US Dollar continues to fight back after a blistering jobs report on Friday showed that the Fed might have more heavy lifting ahead to rein in inflationary pressures.

The ramifications of the massive beat of US total nonfarm payrolls (NFP) data continued to play out through the Asian session on Monday.

517k jobs were added in January according to the US Bureau of Labour Statistics, way above the 188k anticipated and last month’s read of 223k was also revised up to 260k. This put the unemployment rate at 3.4%, below the 3.6% forecast and 3.5% previously.

Treasury yields are higher, adding to large gains seen at the end of last week with the 2-year part of the curve seeing a generous uptick as it traded back above 4.35% after visiting 4.04% last week.

The Aussie and Kiwi Dollars have been hardest hit in the currency space as high beta risk assets tumble on the prospect of tighter monetary policy from the Fed.

USD/JPY is notably higher after the Nikkei newspaper reported that the Bank of Japan (BOJ) Deputy Governor Masayoshi Amamiya has been sounded out to take the top job when Haruhiko Kuroda steps down in April.

He is seen as maintaining the current relatively loose monetary policy. The Nikkei 225 equity index bucked the broader weakness in stock markets, trading in the green. Hong Kong’s Hang Seng index was down over 2.3% at one stage. Futures are pointing to a soft start to the Wall Street cash session.

The backdrop to market gyrations today is engulfed by the Chinese balloon saga that has Sino-US relations turning icy once more. The cancellation of Secretary of State Antony Blinken’s visit to Beijing might disrupt China’s smooth economic transition out of the pandemic era.

Gold is languishing near Friday’s low under US$ 1,870 an ounce. Similarly, crude oil is struggling to make headway with the WTI futures contract trading near US$ 73.50 bbl while the Brent contract is around US$ 80 bbl.

Looking ahead, there will be a number of speakers from the Bank of England today.

DXY (USD) INDEX TECHNICAL ANALYSIS

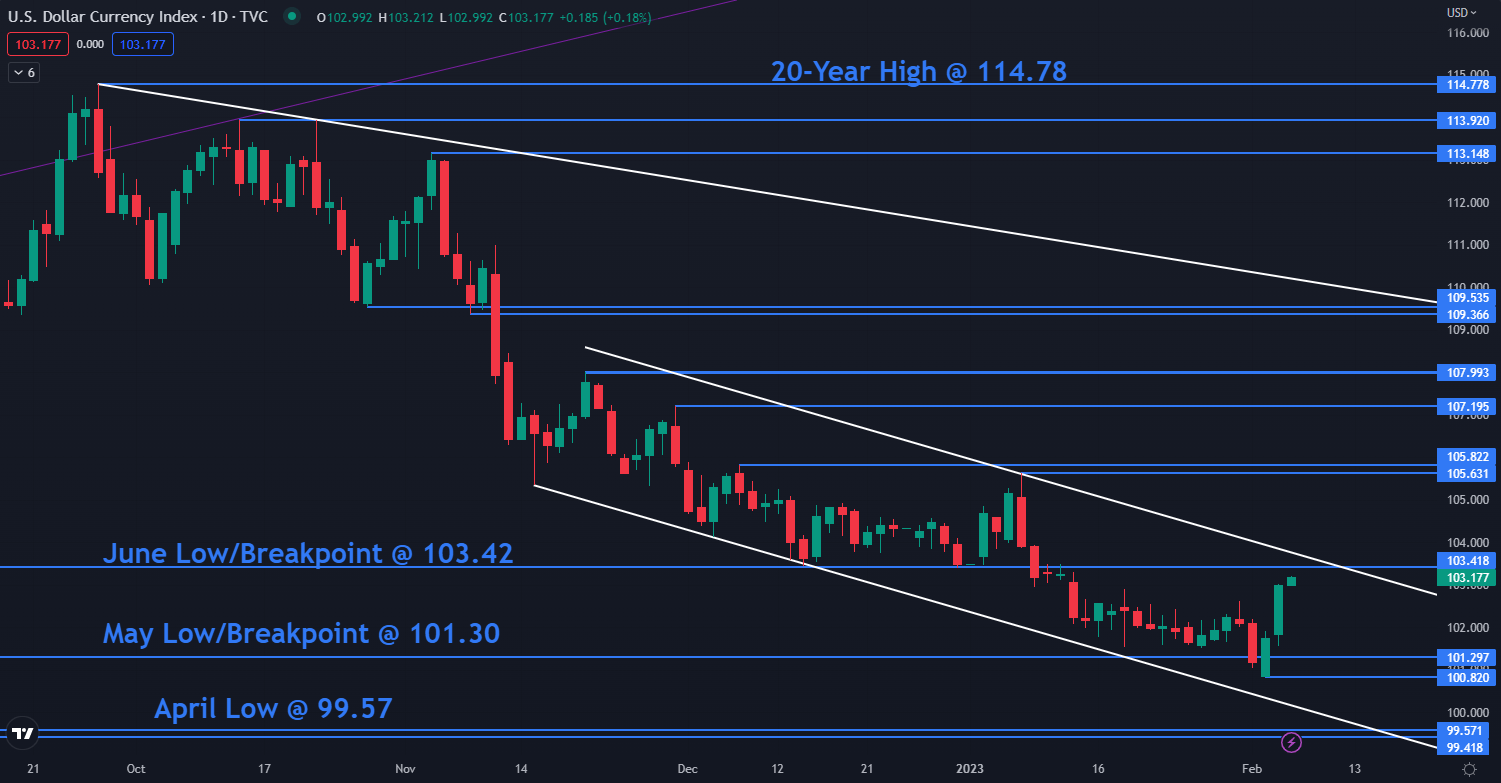
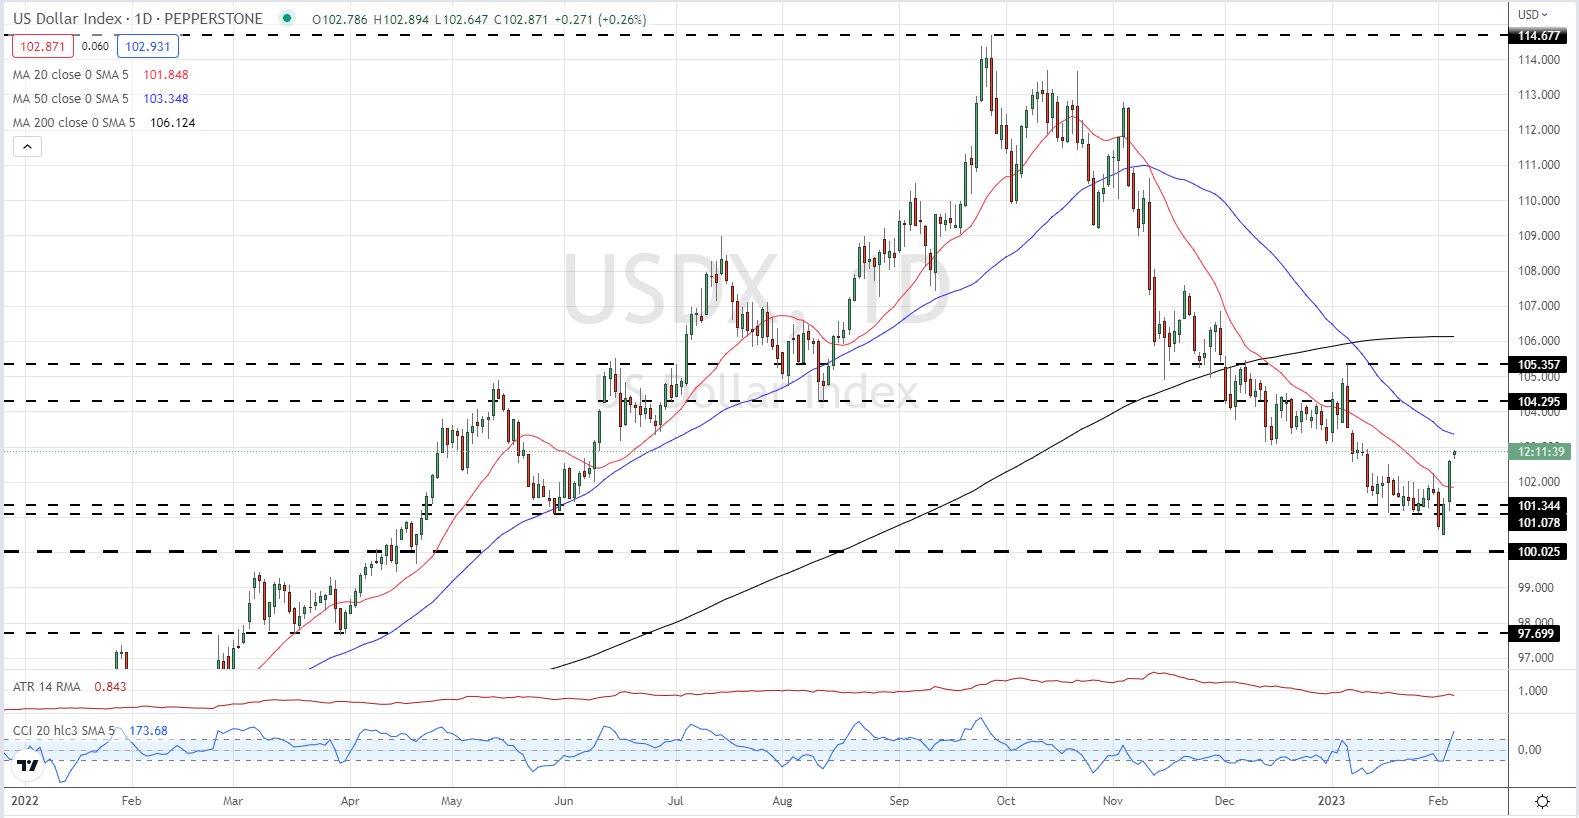
The DXY Index has recovered from a seven-month low but remains within a descending trend channel.

Resistance could be at the breakpoint 103.42 or further up and the prior peaks of 105.63, 105.82, 107.20 and 107.99.

On the downside, support may lie at the breakpoint of 101.30 or down at the previous lows of 100.82, 9957 and 99.42.

image1.png


Gold and Silver Technical Outlook: Is the Upward Pressure Fading?

Gold and Silver Technical Outlook: Is the Upward Pressure Fading?

GOLD TECHNICAL OUTLOOK – BULLISH

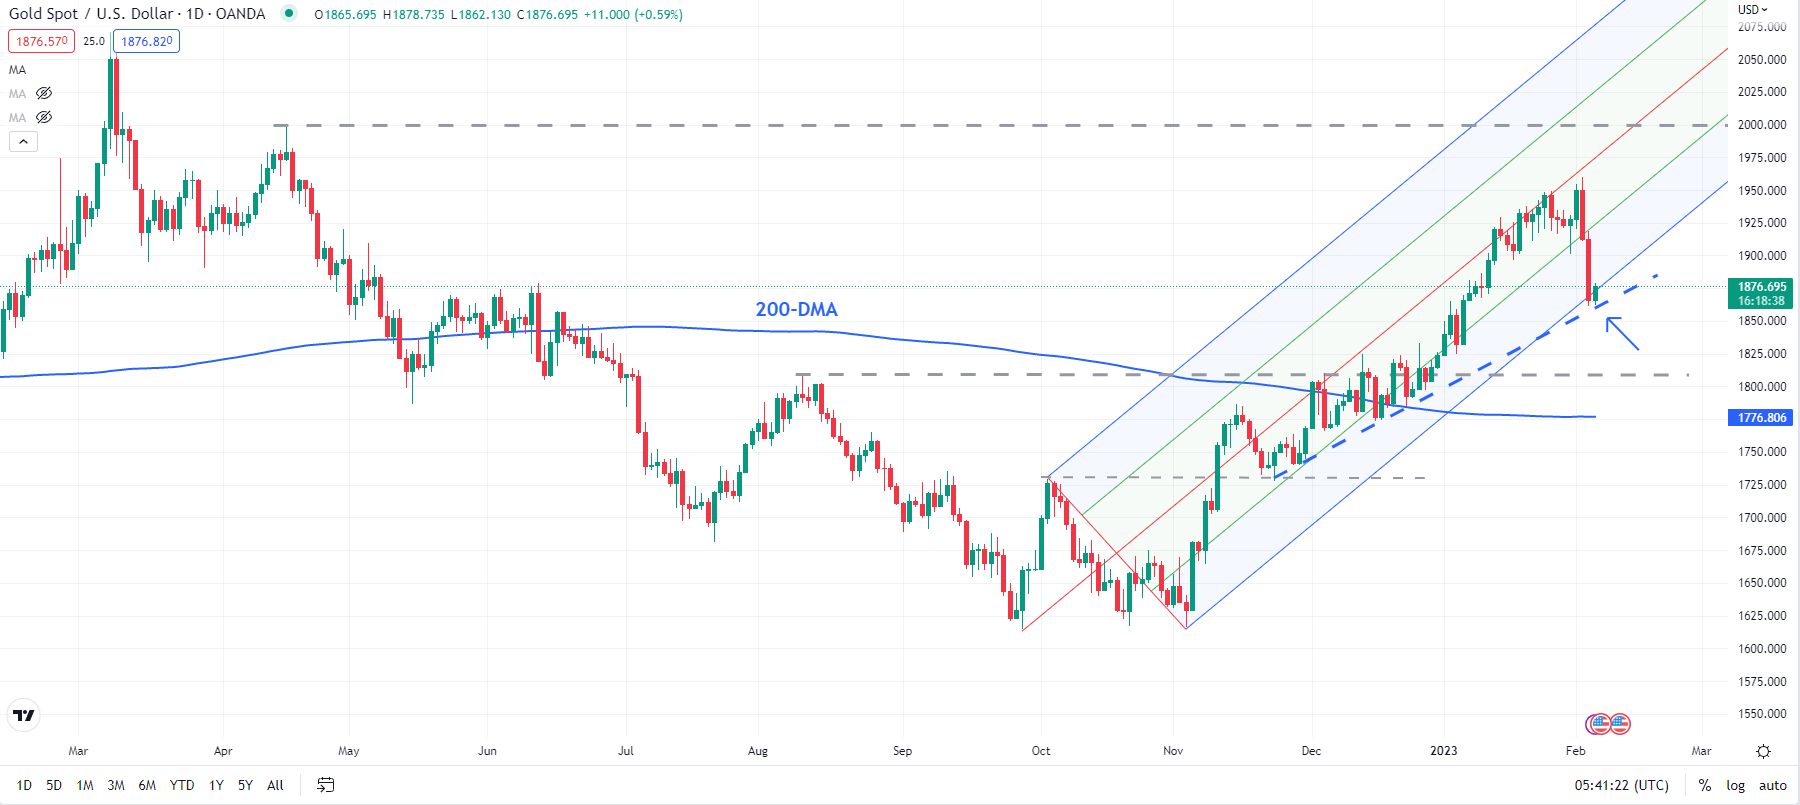
The sharp retreat toward the end of last week is a sign that gold’s three-month-long-uptrend has stalled for now and the yellow metal could settle in a range in the short term.

image1.png

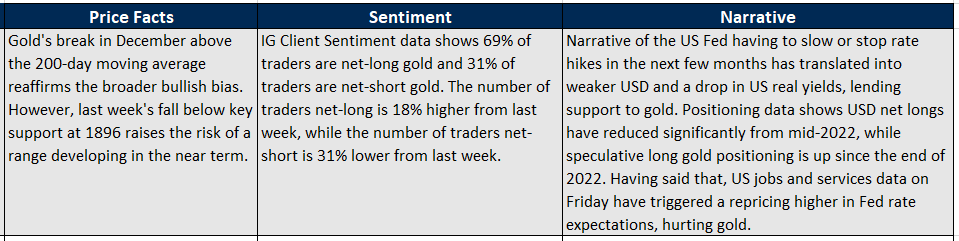
On the weekly candlestick charts, XAU/USD posted a bearish reversal candle last week. This follows back-to-back doji candles on the weekly charts, indicating that bulls are exhausted for now. Furthermore, the break below minor support at the mid-January low of 1896 has confirmed that the upward pressure has faded for now (refer to the previous article that highlighted the risk).

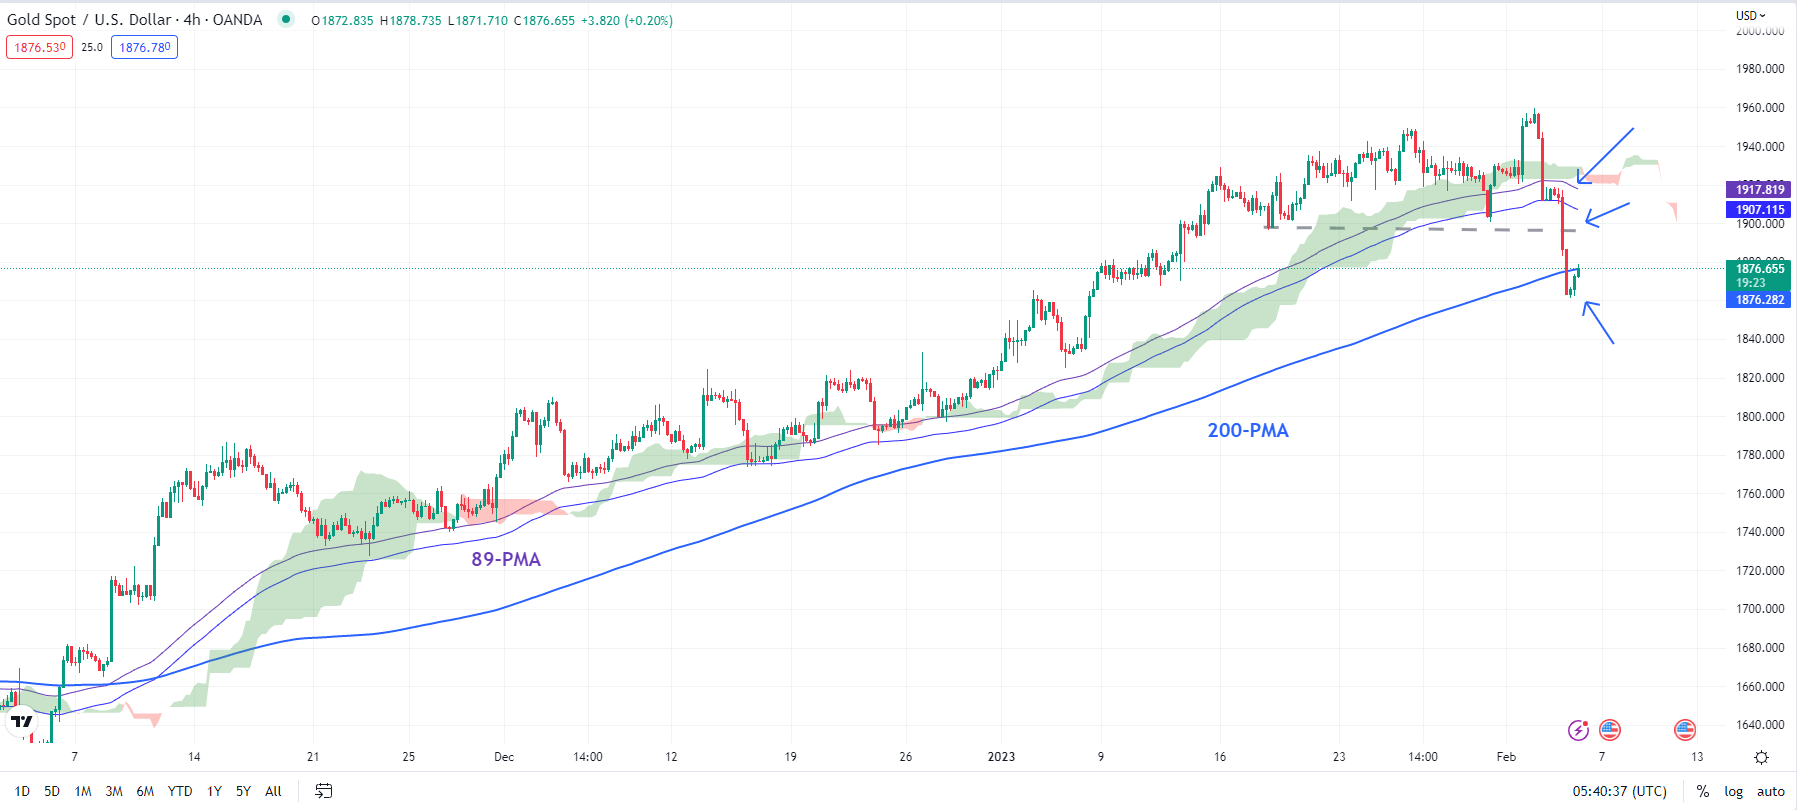
XAU/USD 4-Hour Chart

image2.png

To be sure, it doesn’t imply that the uptrend has ended, but XAU/USD could go sideways over the next week or two. In this regard, there is immediate support at 1876 (including the 200-period moving average on the 4-hourly chart), which could cushion the downside. On the upside, the yellow metal faces a critical barrier at 1910 (the 50% retracement of last week’s range). Gold would need to rise above the ceiling for the immediate downside risks to ease.

XAU/USD Daily Chart

image3.png

SILVER TECHNICAL OUTLOOK – NEUTRAL

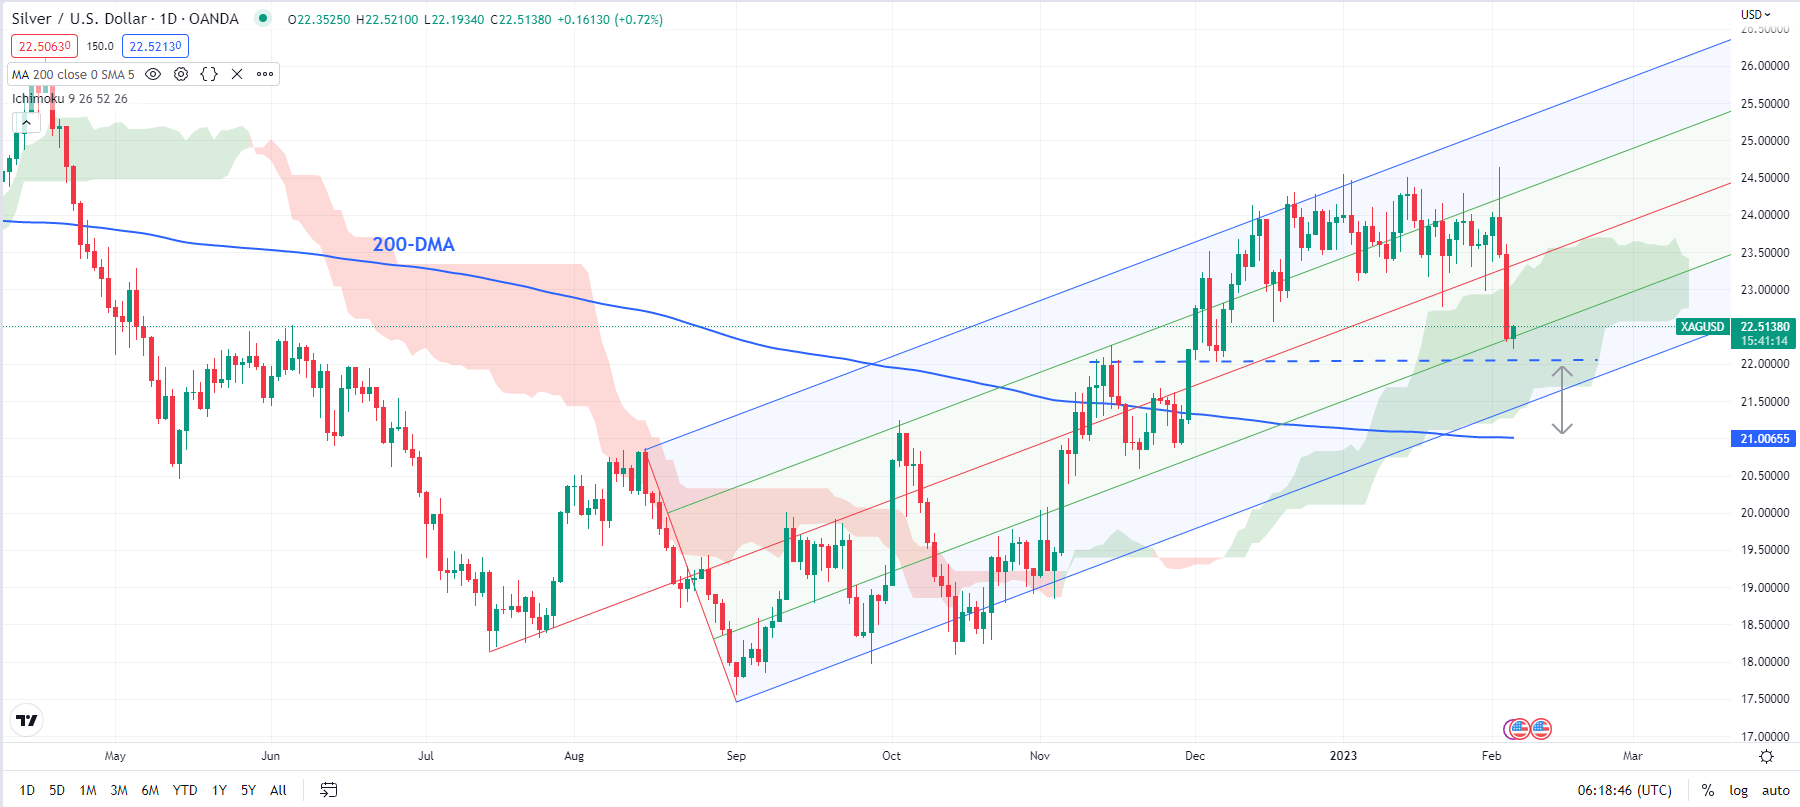
Silver’s breakdown out of a month-long sideways range is a sign that cracks are developing in the three-month-long rally. XAG/USD dropped below an immediate floor on a horizontal trendline from early January at about 23.10. The break has paved the way toward the mid-December low of 22.50, roughly the price objective of the sideways topping pattern (refer to last week’s update highlighting the risk).

XAG/USD Daily Chart

image4.png

On intraday charts, the trend is unambiguously bearish. However, on the daily chart, the trend is at best sideways with a slight downward bias, unless XAG/USD falls below the vital cushion zone at 21.00-22.00 (including the 200-day moving average). However, what is not clear is whether Silver has some more immediate downside. In this regard, it would need to break above 23.00 for the imminent downside risks to fade.

How to Learn Technical Analysis

How to Learn Technical Analysis

Technical Analysis at litefinance

Trading may seem simple at surface level because almost every human being has the same ability to open and close a trade. And given that the future is truly uncertain, it can seem as though a new trader has the same chance of winning on any given trade as even the most grizzled of market veterans. But with time and enough examples, it often becomes clear that there is more to trading than just picking the right market and ‘guessing’ correctly a certain number of times.

There’s strategy, and technique, and a plethora of ways to go about ‘trying to see around the next corner’ in order to attain desirable results. Like most other endeavors in life, this usually takes time and experience for an individual to learn how to best do this for themselves.

One of the keys often incorporated along the way is technical analysis, or the premise of using the chart and past price movements to help make trading decisions. Technical analysis is simply an examination of the past, and this is often carried out with a chart to try to identify patterns or scenarios that could give the trader ideas as to how to best move forward in a given market.

Getting Started with Technical Analysis: Learning the Basics

1. Swat up on the basics with our Technical Analysis for Beginner’s guide

Building a solid foundation of the core elements of technical analysis is key for any trader looking to progress and succeed in trading. How can technical analysis improve your trades across the financial markets, and what are the key tools, concepts, charts and indicators required to master your technique? Learn more in our guide to the basics of technical analysis.

2. Get a comprehensive introduction to the application of technical analysis with litefinance Trading Education

At litefinance our trading education section includes a dedicated module compiled over a range of articles covering the main areas of technical analysis. Here you can explore key concepts such as chart reading, using technical indicators, and how time frame analysis and sentiment analysis to assist with buy/sell decisions. to assist with buy/sell decisions.

3. Get to grips with Price Action: A popular field of technical analysis

A field within technical analysis that is quite popular on litefinance is price action, which is the study of price movements without the assistance of indicators. The articles listed below can help improve your understanding and boost your confidence in this field:

Uncover the foundational concepts of price action trading

Observing the principals of using price charts to reveal trade opportunities

Price action can expose certain ‘swings’ during market trends

Implementing the fundamental price action techniques of support and resistance can lead to identifying breakout trades

Delve deeper into price action analysis with pin bars and candlesticks

Learn how to use price action to effectively employ sound risk management parameters

Keep emotions in check by using trailing stops to erase ‘what if’ scenarios

4. Sign up to our weekly webinar series on scalping

litefinance Technical Strategist, Michael Boutros has put considerable work into his scalping webinar series in which he hosts weekly sessions. In this session, Michael Boutros of the DailyFX team will talk analyze markets with a shorter-term focus.

5. Tune into our podcasts on top technical analysis tips and strategies

At litefinance we enjoy hosting podcasts with a range of market technicians and experts in the field of technical analysis. For an introduction to more advanced technical analysis, check out the following podcasts where our litefinance analysts offer tips on technical analysis beyond chart reading and into the realm of deep-dive analysis:

6. Join Paul Robinson’s ‘Becoming a Better Trader’ Webinar Series

litefinance Currency Strategist, Paul Robinson conducts free webinars entitled ‘Becoming a Better Trader’ in which technical analysis plays a key role in his approach. To get in on the live sessions, sign up to his Becoming a Better Trader webinar series now, or check out the following articles which cover some of his core principles in depth:

Discover the benefits of a sound trading plan

See the potential in high probability chart patterns like the ‘head and shoulder’

Consistency in trading applies to many different components which are key to achieving regularity

The top-down approach to trading can guide traders to more improved trade opportunities

Keep in mind the complexity around proper risk management for optimal results

How Technical Analysis Can Help Traders

Technical analysis is highly valuable for identifying trading opportunities, but it’s important to remember this trading approach is not a prediction tool. Given that technical analysis is an analytical field and merely examines what’s already happened, it would be nonsensical to argue that the past perfectly predicts the future. New things happen and changes are expected; and while history often rhymes, it rarely repeats with perfection – and this is where technical analysis can help.

One of the reasons that technical analysis garners its popularity is because of its ability to help with risk management, which is a key stumbling block that separates many new traders from their experienced counterparts.

This was the primary premise in the litefinance Traits of Successful Traders series, in which it was identified that many retail traders will often have winning percentages of greater than 50%. But these same traders lose so much more when they’re wrong than they win when they’re right that, at the end of the day, they end up staring at a red net loss.

Technical Analysis Assistance with Risk Management

There’s no doubt about it: technical analysis can help with risk management. For example, if a trader has a bullish bias on a market, they can wait for support to show, at which point stops can be set below the support level. If that bullish bias plays out, and prices run-higher, the trader can then scale-out of the position at a more favorable price. But if, on the other hand, that bullish bias does not play out, the trader can be taken-out of the move with the goal of loss mitigation as that idea ‘didn’t work.’

Rather than trying to constantly outguess the markets, in which prices are often set by banks and followed by some very sharp professionals that have made careers of making markets, the retail trader will often make more efficient strides towards desirable results by focusing on risk-reward ratios. Or, to put it otherwise, risking a Dollar to try to make two. That way, even if the trader only ‘guess right’ 40% of the time, the possibility of a net profit can remain. It is always important to remember that where there is the possibility of profit, there is also a risk of loss.

USD/JPY Hits Fresh 3-Week High on Speculation of New BoJ Governor

USD/JPY Hits Fresh 3-Week High on Speculation of New BoJ Governor

USD/JPY FUNDAMENTAL BACKDROP

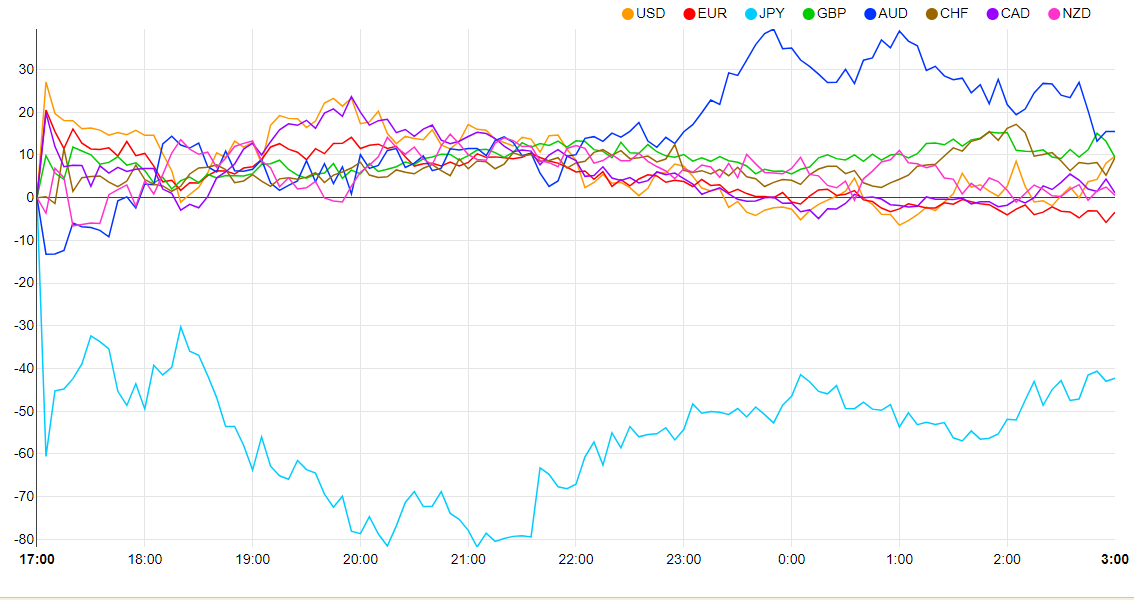
USD/JPY hit a fresh 3-week high in the Asian session trading above the 132.00 handle. The European open has seen some pullback as the dollar index seems to be retracing following Fridays extended rally.

Currency Strength Chart

Chart, line chart  Description automatically generated

The Yen came under pressure in the Asian session following a report by the Nikkei that the Japanese Government had approached Deputy Bank of Japan (BoJ) Governor Masayoshi Amamiya as a potential successor to Governor Kuroda. Amamiya is seen as one of the architects of the BoJ’s loose monetary policy and this showed as the Yen declined. Market participants are of the opinion that Deputy Governor Amamiya will continue with Governor Kuroda’s policies. The Japanese government has since dispelled the rumors that they had approached Amamiya with the new BoJ Governor to be announced sometime in February.

Geopolitical tensions have ratcheted up between the US and China. The US brought down what it called a Chinese spy balloon off the coast of South Carolina which entered US airspace. The US Defence Department released a statement over the weekend stating that Chinese Balloons entered US airspace 3 times during the previous administration. The news is likely to weigh on sentiment as markets were hoping for a swift return of demand from the Chinese economy during the month of February.

TECHNICAL OUTLOOK

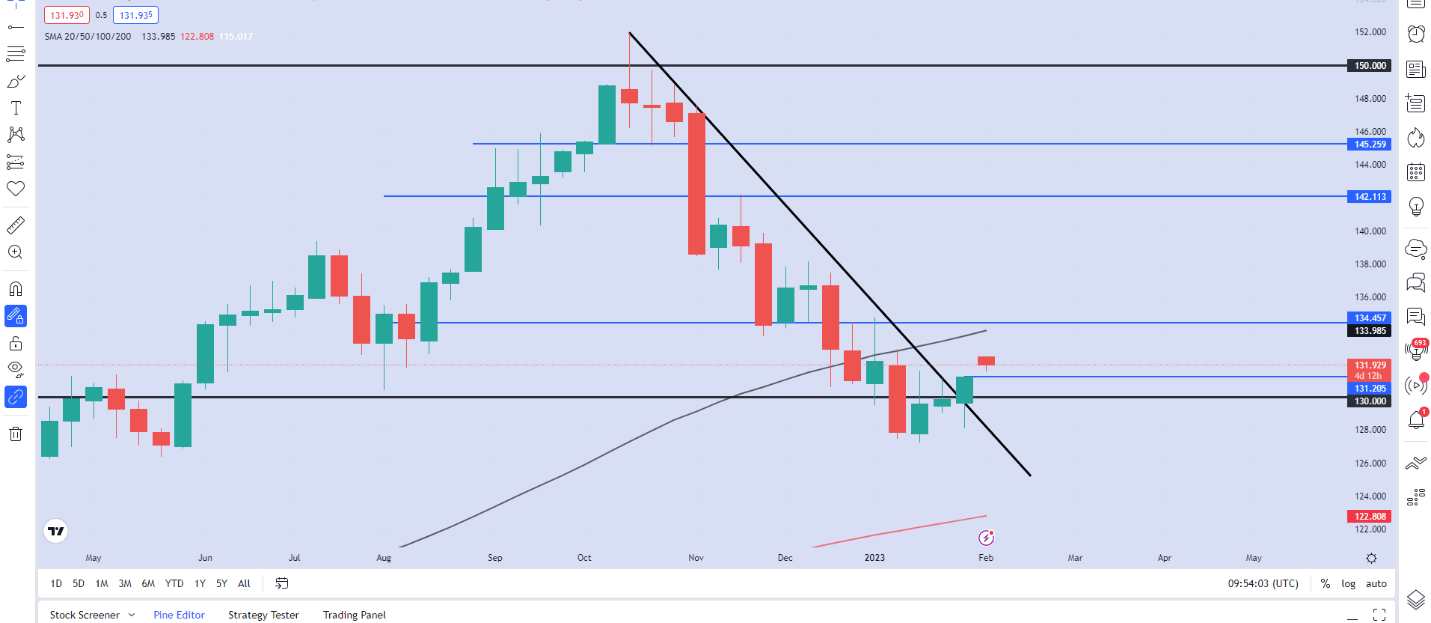
From a technical perspective, USD/JPY had a significant weekly candle close last week, breaking above the descending trendline and the psychological 130.00 level. The weekly candle closed as a hammer candlestick with little to no upside wick, a sign of the bullish momentum in play. We did gap up over the weekend and the potential to close the gap at 131.200 before moving high remains a possibility. On the upside, we have the 50-day MA which could provide resistance around the 133.90 Level with horizontal resistance resting at the 134.45 handle.

USD/JPY Weekly Chart – February 6, 2022

Chart  Description automatically generated

IG CLIENT SENTIMENT DATA: MIXED

IGCS shows retail traders are currently SHORT on USD/JPY, with 59% of traders currently holding short positions. At DailyFX we typically take a contrarian view to crowd sentiment, and the fact that traders are short suggests that USD/JPY may continue to rise.


How to Learn Technical Analysis

Bank of Japan (BoJ) – Foreign Exchange Market Intervention

The Bank of Japan’s ultra-loose monetary policy is under pressure from a swathe of global central banks embarking on a series of rate hikes and balance sheet reduction programs. While many central banks, including the Federal Reserve (Fed) and the Bank of England (BoE), are trying to navigate a tricky course of suppressing rampant inflation while leaving their economies with enough liquidity to grow, the BoJ has a different set of problems, namely anemic growth and consistently below-target inflation. As interest rate differentials widen between Japan and other major economies, the Japanese Yen continues to weaken. And the Bank of Japan is not just standing by and letting this happen, it looks to be actively encouraging the move.

Interest Rates and the Forex Market

The Benefits of a Weaker Currency

A weak currency, compared to peers, helps to boost a country’s export sector by making its goods more competitive than its rivals. These additional sales in turn help to boost economic growth, the jobs market, and the countries’ balance of payments. A weaker currency also makes imports more expensive, pushing inflation higher. By moving its currency higher or lower, a country can help steer its economy towards its desired landing zone without having to resort to punitive, domestic fiscal measures.

Central Banks and Monetary Policy: How Central Banks Set Policy

While in theory moving one’s currency around to suit domestic policy sounds economically prudent, currency manipulation is frowned upon, especially by one’s largest trading partners. The US Treasury has a set of guidelines for what it deems is currency manipulation and if these are met then the US will engage with the country involved to eliminate the unfair competitive advantage this manipulation has created. If all else fails, the US can evoke trade sanctions against their counterparty.

A History of Bank of Japan Intervention

The Bank of Japan has actively intervened in the foreign exchange on numerous occasions since the Japanese Yen was floated against the US dollar in 1973. The central bank has intervened repeatedly over the last 25 years to either keep the currency attractive to help exporters or to try and weaken the currency to boost growth and inflation. The Bank of Japan introduced quantitative easing in early 2000 in an effort to boost inflation by offering to buy huge amounts of government bonds at set interest rates. The program was upgraded on numerous occasions to increase the number of bonds that the central bank would buy, adding asset-backed securities into the mix and then including equities into the basket of assets the BoJ would buy. The Bank of Japan is currently the largest holder of Japanese equities, via various ETFs, and holds around 50% of the Japanese bond market.

The Bank of Japan: A Forex Trader’s Guide

The monthly USDJPY price chart shows a series of sharp long-term reversals in the currency pair when the Bank of Japan changes course on monetary policy.

USD/JPY Monthly Price Chart

Source: ProRealTime

Talking the Japanese Yen Up and Down

In common with other central banks, market communication is an essential, and powerful tool that the Bank of Japan uses to steer the value of the Yen. As the currency nears a certain level, the Bank of Japan becomes more vocal about what level it would be comfortable with. If the currency becomes too expensive for the BoJ they will try and ‘talk it down’, while if the currency is too low they will let the market know this by ‘talking the currency up’. For a bank to be effective in talking a currency up or down, it must have market credibility or a history of backing up its views with concrete action. The monthly chart shows that the 125.00 level held for nearly two decades as this was seen by the market as the BoJ’s line in the sand. This level has now been broken.

British Pound Outlook: GBP/USD Yields to US Dollar Strength, Where to Next?

British Pound Outlook: GBP/USD Yields to US Dollar Strength, Where to Next?

The US dollar is pushing further ahead in early European turnover, buoyed by Friday’s blowout NFP report and US ISM data. The super-sized US Jobs Report – NFPs at 517k, unemployment rate at 3.4% – stunned the market with the magnitude of jobs created despite the beat being influenced by yearly population changes. The ISM non-manufacturing PMI released later on Friday also beat expectations by a wide margin – 55.2 vs 50.4 exp. and 49.2 prior – giving the greenback a further boost. The dollar is now trading at its highest level since mid-January, although the CCI indicator is showing that the greenback is in overbought territory.

US Dollar Index (DXY) – February 6, 2023

image1.png

There is little cheer for the British Pound of late. Economic data has not been strong enough to underpin Sterling against its rivals, while ongoing strikes, and the threat of more in the coming weeks, are hitting sentiment.

On Friday, the Office for National Statistics (ONS) will release Q4 GDP preliminary data. UK growth is seen stalling in Q4 of last year and may have gone into reverse, powering further recessionary fears. The recent International Monetary Fund (IMF) update suggested that the UK economy will contract by 0.6% this year, nearly one full percentage point below their earlier estimate.

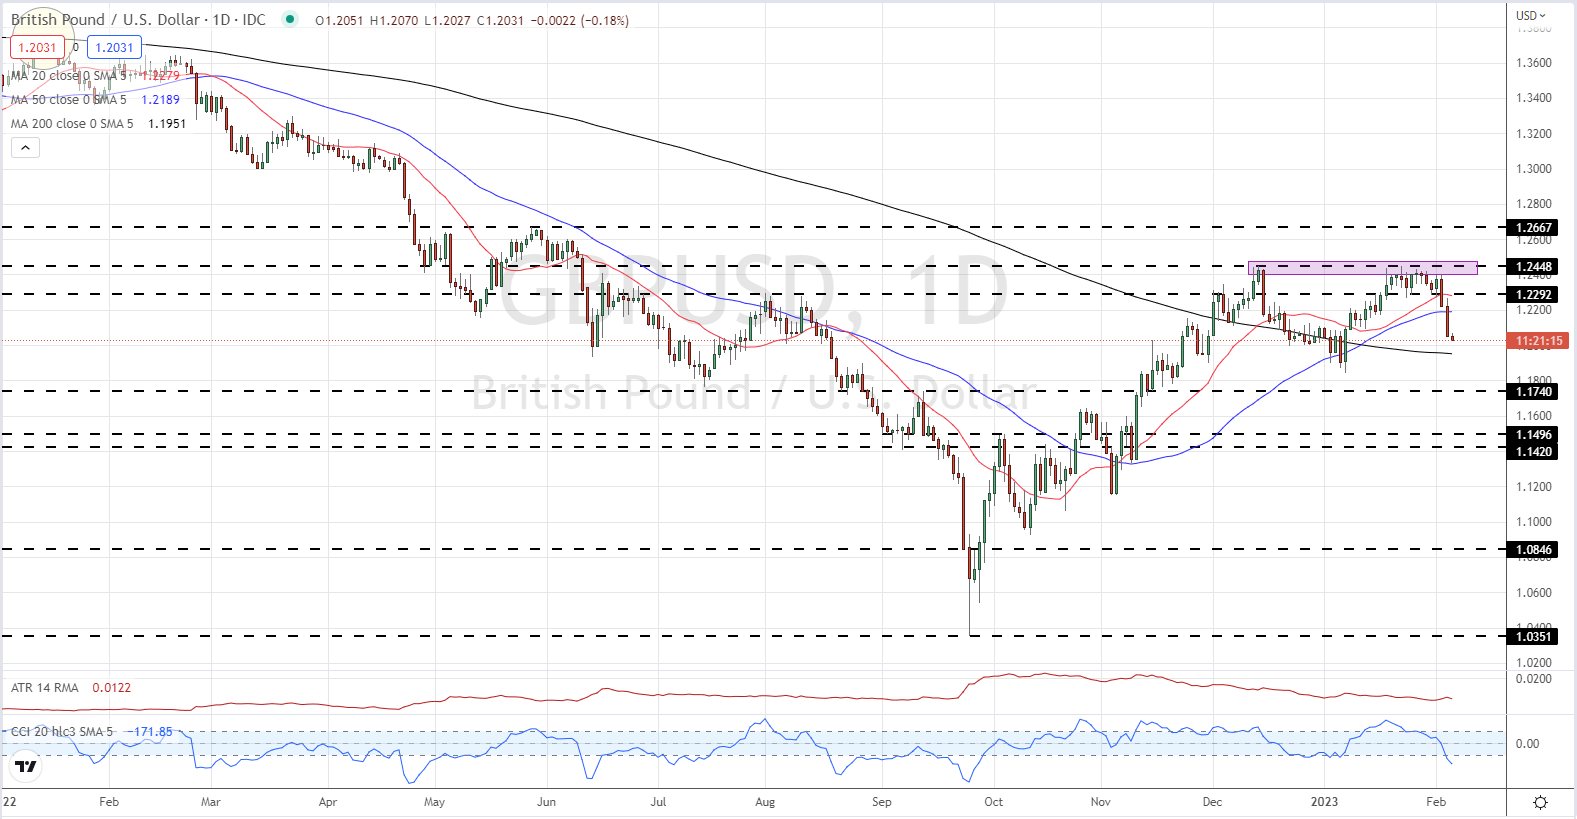
Cable is trying to cling on to the 1.2000 handle today after giving up around four big figures since Thursday’s 1.2402 high print. Recent support around 1.2290 was unable to stem the sell-off and the next level of technical support is seen around 1.1950 from the 200-day moving average. The market does look oversold using the CCI indicator in the short term at least.

GBP/USD Daily Price Chart – February 6, 2023

image2.png


US Dollar Technical Forecast: USD Prints Hammer Candle Following Blockbuster NFP Report

US Dollar Technical Forecast: USD Prints Hammer Candle Following Blockbuster NFP Report

US DOLLAR OUTLOOK

The US Dollar has had an interesting week with the FOMC meeting and host of key data events potentially setting the tone for the rest of the quarter. The FOMC meeting saw a 25bps hike which was followed by dovish comments from Fed Chair Jerome Powell whose use of the word ‘disinflation’ sent the dollar tumbling and risk assets higher.

Friday however brought the NFP report, unemployment rate and of course the average hourly wage growth. The NFP report smashed estimates with a print of 517000 new jobs added, the highest since August 2022. The unemployment rate also came in better than expected falling to 3.4%, a low last seen in 1969. The only silver lining being that average hourly wage growth remained at 0.3% MoM, however with the tightness persisting in the labor market wage growth could soon face renewed pressure. Fed Chair Powell in his press conference mentioned that the resilience of the labor market is encouraging but cautioned that some weakening would be necessary for the Fed to achieve their inflation target of 2%. Friday’s data has seen the probability of a further 25bps hike in March rise to 97% up from 82% before the release of the NFP report with the dollar index finding some much-needed support.

Graphical user interface, table  Description automatically generated

TECHNICAL OUTLOOK

US Dollar Index (DXY) Weekly Chart

Chart  Description automatically generated

From a technical perspective, the weekly chart for the dollar index (DXY) is on course to print a hammer weekly candle close which hints at further upside in the week ahead. The previous two weeks closed as a doji candlestick which did provide a sign that a reversal may be incoming, however following the FOMC meeting the dollar index broke below the 101.00 level and appeared vulnerable. A push higher on the weekly faces’ resistance around the 103.50 with a break bringing the 100-day MA at 105.00 into play.

US Dollar Index Daily Chart

Chart  Description automatically generated

The daily timeframe finally saw a breakout of the 13-day trading range before closing back inside the range on Thursday. False breakout? Looks like it is following Friday’s NFP, which resulted in a test of the top of the range around 103 and looking likely to close above 50-day MA. Should we get a daily candle close above the 50-day MA the 100-day MA line up with the resistance level mentioned above, around the 103.50 level.


Given the data on Friday as well as the price action a break back below the range seems unlikely. However, should we get a candle close back below the range we could be in for a push below the 100.00 mark which we haven’t seen since April 2022.

USD/CAD TECHNICAL OUTLOOK

USD/CAD Daily Chart

image4.png

Australian Dollar Outlook: US Dollar Dominates Ahead of RBA

Australian Dollar Outlook: US Dollar Dominates Ahead of RBA

The Australian Dollar roared to a 10-month high last week as the US Dollar collapsed on hopes that the Federal Reserve might be stepping back from their hawkish stance. The focus now turns to the RBA meeting this Tuesday.

The Federal Open Market Committee (FOMC) lifted rates by 25 basis points (bp), but it was in the post-meeting press conference where the fireworks kicked off.

Fed Chair Jerome Powell mostly stuck to the script, but markets gushed when he said, “We can now say I think for the first time that the disinflationary process has started.”

This created a buying frenzy of equities and bonds and the broad-based selling of US Dollars, pushing AUD/USD to its peak of 0.7158.

Treasury yields collapsed, dragging global government bond yields down with them. Australian Commonwealth Government Bonds (ACGB) yields fell further with the 10-year bond spread returning to around parity.

The contraction in the spread occurred at the same time that AUD/USD dropped.

Australian CPI is running hot at 7.8% year-on-year, but the RBA has previously appeared non-plussed about the massive overshoot from their 2-3% mandated target band. At their last meeting, they stated that they expect it to climb above 8% later this year before easing in 2022.

The domestic economy is on fire. Building approvals for December were up 18% compared to the month prior. The trade surplus keeps washing in billions of dollars each month and the unemployment rate remains near multi-generational lows at 3.5%.

The December trade balance will be released just prior to the RBA meeting on Tuesday and a Bloomberg survey of economists is anticipating an AUD 12.4 billion surplus.

If China transitions out of Covid-19 restrictions smoothly, it’s reasonable to anticipate further stimulus arriving via international trade.

December retail sales is the only blight on the economic scorecard, but this has been mostly attributed to consumers pre-buying ahead of Christmas in November.

So, with the national finances in such great shape, why is the RBA not slamming on the brakes and reining in inflation?

A lot may have to do with the so-called ‘mortgage cliff’. A significant amount of fixed-rate loans that were taken out when the cash rate was 300 bp lower are due to roll off this year.

A degree of controversy surrounds the RBA due to media misreporting Governor Philip Lowe’s comments about how long rates will be kept at the pandemic emergency low setting.

Whatever the reasoning for the RBA not being more aggressive in their inflation fight, they have made it clear that they are in somewhat of a wait-and-see mode for now. A 25 bp lift in rates is widely anticipated this week.

With China re-opening, a blistering domestic economy and if the US Dollar keeps sailing south, the Aussie might be moving north.

AUD/USD AGAINST AU-US GOVERNMENT BOND SPREAD


image1.png