Trading Economic Data Means Looking Past the Numbers

Trading Economic Data Means Looking Past the Numbers

Economic Data, Foreign Exchange Trading, Central Banks – Talking Points

The foreign exchange market’s reaction to economic data is one of the most important subjects for traders to consider, but also one of the most vexed.

The monthly round of official and private releases from around the world covers everything from inflation and employment to the forward-looking views of corporate purchasing managers. Together with central bank pronouncements, it forms what we might call the framework of foreign exchange trading.

Major Economic Releases Can Dominate Trade

Markets may well hunker down, losing both volume and volatility, in the run-up to an eagerly anticipated number. Official US labor market statistics are perhaps the most obvious example here. When the trading community expects serious gains or crushing losses the session can be subdued from Asia’s open and right across Europe as participants nurse suspicions or hopes. Even when the market expects neither many traders will – in financial journalism’s enervating cliché – “wait and see.”

This makes sense of course, enervating or not. Obviously, there’s a link between the economic performance of a country with a freely floating currency and the performance of that currency against its peers. At the most basic level a strong piece of economic data will boost a currency, a weaker one will tend to see it fall.

However, to take the matter no further would be a grave error. For one thing, individual pieces economic data tend to influence currencies in a very fleeting way. The gains provided by even a blockbuster, expectation-shattering number can be undone by the end of a day’s session, and well before that in some cases. It may even mean no more than a few minutes’ spike one way or another.

So, there’s clearly more to know about data and its effects.

The first and perhaps most important thing is that, while data provide the rhythm, the world moves to a monetarist cadence and central banks will always play lead. So, ultimately, the longer-term effects any piece of economic news must be considered with a view to how it might change monetary policy. No single data release is ever likely to do that, and markets would have caused to worry if it did. Central banks like to be ahead of the numbers, ready to tighten or loosen policy as needed before trends turn.

Therefore, we might see the markets only very briefly cheer strong retail sales, say, or powerful job creation. They might be great for the politicians, but, if inflation remains docile, they might not mean anything at all in terms of central bank policy changes. And if rates aren’t going up or coming down, then the longer-term effect of the data on the currency won’t amount to much.

Of course, these days docile inflation is little more than a happy memory across much of the world as war in Ukraine boosts both food and fuel prices at a time when post-Covid supply chain storms are still raging.

Currencies Can Fall Even When Interest Rates Rise

In July of this year, the United States Federal Reserve delivered a three-quarter point interest rate rise, something which would have been considered extraordinary monetary action for most of the past thirty years. And yet the US Dollar actually lost ground by the end of the session for, in its post-rate-hike remarks, the Fed left markets reasonably sure that future actions were going to be a lot more measured.

So, we can on occasion see the phenomena of a ‘dovish’ rate hike, or even a ‘hawkish’ rate cut. That’s when a central bank takes action but strongly implies that it has finished doing so, or that the barrier to more is extremely high. Higher interest rates have not been terribly helpful to rare-breed Sterling bulls this year either. The United Kingdom’s political and economic turmoil has left the market wondering if its economy can bare higher borrowing costs. The US certainly looks much better placed to do so.

With all this in mind, merely watching and reacting to pieces of economic news is unlikely to make for a satisfactory trading strategy. Indeed, the Dollar’s broad gains this year have rendered data watching all-but meaningless in many countries. Their currencies have fallen against the Greenback regardless of the numbers as the US currency reveals itself as the ultimate safe-haven play.

Competent traders know where the market is focused and where in the business cycle we are. What that tends to mean in practice is which specific data releases are most likely to trigger changes in the monetary mood music.

These can change dramatically over time. Older readers may well recall the days when western industrial production figures were the ones to watch for the best central bank steer. In more recent times unemployment figures took over. Policymakers were leery of wage inflation and, poised to “withdraw the punchbowl” if the labor market party showed any sign of getting out of hand.

Now of course inflation figures themselves are perhaps the ones which traders look at most obsessively, with prices’ stubborn elevation. One day, the focus will move on again. It always does. But a nuanced approach to trading economic data should remain a constant.


EUR Breaking News: ECB Hike Rates by 50bps, EURUSD Looks Vulnerable

EUR Breaking News: ECB Hike Rates by 50bps, EURUSD Looks Vulnerable

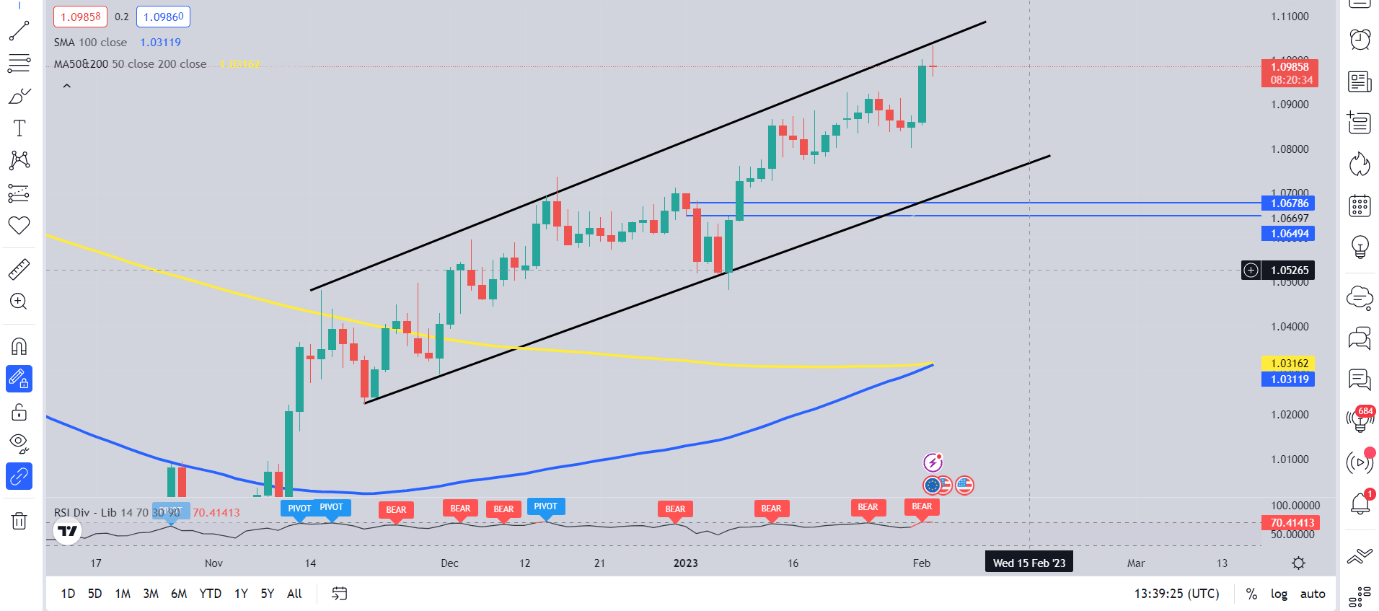
The European Central Bank has raised interest rates by 50bps in line with expectations. The central bankexpects to raise rates further keeping them at levels that are sufficiently restrictive to ensure a timely return of inflation to its 2% medium-term target. Inflation remains a sticking point with the ECB confirming it intends to raise interest rates by another 50 basis points at its next monetary policy meeting in March and it will then evaluate the subsequent path of its monetary policy. Future decisions will be data dependent and follow a meeting-by-meeting approach.

Furthermore, the central bank confirmed the APP portfolio will decline at a measured and predictable pace, as the Eurosystem will not reinvest all of the principal payments from maturing securities. The decline will amount to €15 billion per month on average until the end of June 2023 and its subsequent pace will be determined over time.

Graphical user interface, application  Description automatically generated

The ECB’s job is a tough one given the economic backdrop of the various countries in the Euro area. The Bank’s own December projections saw inflation remaining at 3.4% in 2024 and 2.3% in 2025, above its target rate of 2%. Energy prices have taken a dive since the ECB’s December meeting which could see the ECB lower their inflation expectations moving forward. The Russia-Ukraine conflict however remains an uncertainty as evidenced by the IMF’s warning that the conflict still poses a significant risk to global recovery.

Looking ahead to the upcoming ECB Meetings and the rest of the year inflation and particular the core inflation data is likely to be a driving force behind the ECB’s decisions. ECB policymakers have been hawkish heading into this meeting despite some positive signs with the ECBS Klaas Knot stating that he wants at least two more 50bps hikes (today’s meeting and the upcoming March meeting), which seems to be the plan given the policy statement.

MARKET REACTION

EURUSD Daily Chart

Chart  Description automatically generated


Oil Prices Fail to Hold Post-Fed Gains, Charts Look Heavy

Oil Prices Fail to Hold Post-Fed Gains, Charts Look Heavy

Oil prices slipped back in Thursday’s European session after short-lived gains in Asia following the United States Federal Reserve’s quarter-point interest rate hike.

Despite higher borrowing costs the US Dollar initially weakened after Fed Chair Jerome Powell said that the ‘disinflation process has started’ even as price rises remain relatively strong. The central bank said that ongoing rate rises remain appropriate, but markets clearly believe that the bulk of such increases are now behind them. This view would seem to be highly dependent on inflation continuing to relax, however.

In any case, a weaker greenback makes Dollar-priced oil less expensive in other currencies and can boost demand.

OPEC and Russia Stick with Production Cuts

In more oil-market-specific news, the Organization of Petroleum Exporting Countries and Russia agreed on Wednesday to stick with production cuts agreed upon back in November. In a virtual meeting that reportedly lasted less than thirty minutes, producers concurred that the two-million-barrel daily output cut should stand. Introduced to support the market, the deal runs through until the end of 2023.

There was less-supportive news for crude in official inventory data which showed a rise of 4.1 million barrels in stocks for the week ending on January 27. This was hugely ahead of the 400,000 barrel rise forecast and the sixth straight week of inventory gains.

Thursday’s data schedule hasn’t got a lot for the oil markets, but official stock numbers for US natural gas are coming up and may grab some attention.

Crude oil prices have posted modest gains into 2023 but, with recession worries hovering over many national economies as interest rates continue to rise, fears about levels of end-user energy demand would seem to be keeping a natural lid on prices.

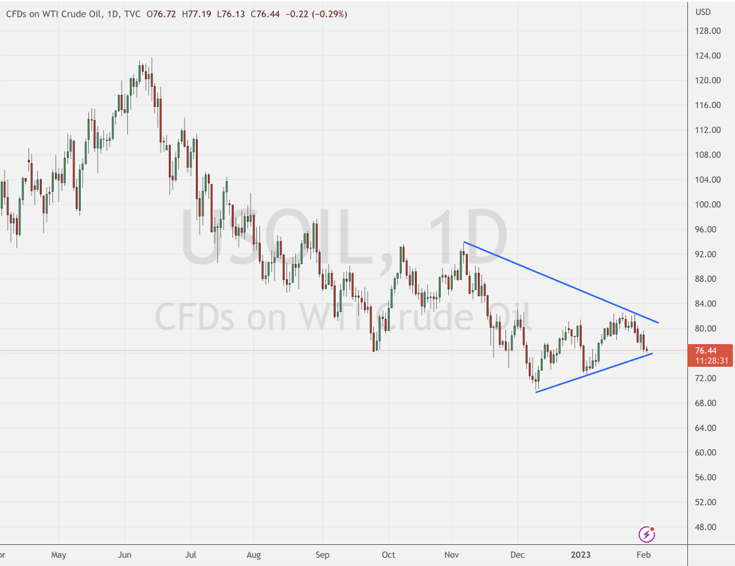
Moreover, the long downtrend in place since US crude topped out above $125/barrel back in March 2022 remains clearly visible.

Crude Oil Technical Analysis

Chart Compiled by David Cottle Using TradingView

US crude prices are stuck between a convergent uptrend and downtrend lines. This is what’s known as a pennant formation and that in turn is one of the ‘continuation patterns.’

What that means is that the market is likely to continue doing what it was doing before the formation began to build once it plays out. At face value this looks like bad news for oil-market bulls because it seems to suggest that further falls are likely.

The peaks of October and November 7 also look worryingly like a double top formation, one which, again, might signal further weakness.

For now, if the bulls are going to turn matters around, then they will need to recapture January 23’s high of $82.52. If they can do that they can break above the downtrend channel in place since that November top, but a retest of December 9’s low of $69.58 looks like a more realistic near-term prospect.

There’s certainly plenty of bearish sentiment baked into the market at present. Of IG clients, fully 77% now take the view that prices have further to fall. While this sort of certainty may make the contrarian call attractive, evidence from the charts suggests that sustained rises would be a bold call now.

EUR Breaking News: ECB Hike Rates by 50bps, EURUSD Looks Vulnerable

EUR Breaking News: ECB Hike Rates by 50bps, EURUSD Looks Vulnerable

The European Central Bank has raised interest rates by 50bps in line with expectations. The central bankexpects to raise rates further keeping them at levels that are sufficiently restrictive to ensure a timely return of inflation to its 2% medium-term target. Inflation remains a sticking point with the ECB confirming it intends to raise interest rates by another 50 basis points at its next monetary policy meeting in March and it will then evaluate the subsequent path of its monetary policy. Future decisions will be data dependent and follow a meeting-by-meeting approach.

Furthermore, the central bank confirmed the APP portfolio will decline at a measured and predictable pace, as the Eurosystem will not reinvest all of the principal payments from maturing securities. The decline will amount to €15 billion per month on average until the end of June 2023 and its subsequent pace will be determined over time.

Graphical user interface, application Description automatically generated

Looking Ahead to the March Meeting and Beyond

The ECB’s job is a tough one given the economic backdrop of the various countries in the Euro area. The Bank’s own December projections saw inflation remaining at 3.4% in 2024 and 2.3% in 2025, above its target rate of 2%. Energy prices have taken a dive since the ECB’s December meeting which could see the ECB lower their inflation expectations moving forward. The Russia-Ukraine conflict however remains an uncertainty as evidenced by the IMF’s warning that the conflict still poses a significant risk to global recovery.

Looking ahead to the upcoming ECB Meetings and the rest of the year inflation and particular the core inflation data is likely to be a driving force behind the ECB’s decisions. ECB policymakers have been hawkish heading into this meeting despite some positive signs with the ECBS Klaas Knot stating that he wants at least two more 50bps hikes (today’s meeting and the upcoming March meeting), which seems to be the plan given the policy statement.

MARKET REACTION

EURUSD Daily Chart

Chart Description automatically generated

Dollar and VIX Slump After Fed Hike, Watch EURUSD and Doubt Trends

Dollar and VIX Slump After Fed Hike, Watch EURUSD and Doubt Trends

Speculative traders in the broader markets seem to be satisfied in their collective forecast. Despite some highlights of an unflattering economic outlook and of course the FOMC’s commitment to fulfilling the rate hike stretch it began in 2022, the ‘risk oriented’ side of the market climbed after the event while the Dollar suffered a notable drop. It is not unusual for the markets to deviate on outlook from officials, but there is generally a risk in fostering this disparity from underlying fundamental course. And, the further the stretch on speculative exposure against these unfavorable circumstances; the worse the eventual fallout can be when the resolution comes to pass. In the meantime, a look at the markets in the aftermath of the Fed. The Nasdaq 100 arguably had the most pressing technical picture with the recent break above the 200-day simple moving average (SMA). The 2.2 percent rally with a three week high volume is impressive. Further, the ratio of the Nasdaq 100 to the Dow Jones Industrial Average (‘growth’ relative to ‘value’) rose to its highest level in three months suggesting a particular appetite for ‘riskier’ assets.


Chart of Nasdaq 100 Futures with 200-day SMA, Volume and 1-Day ROC (Daily)

Chart Created on Tradingview Platform


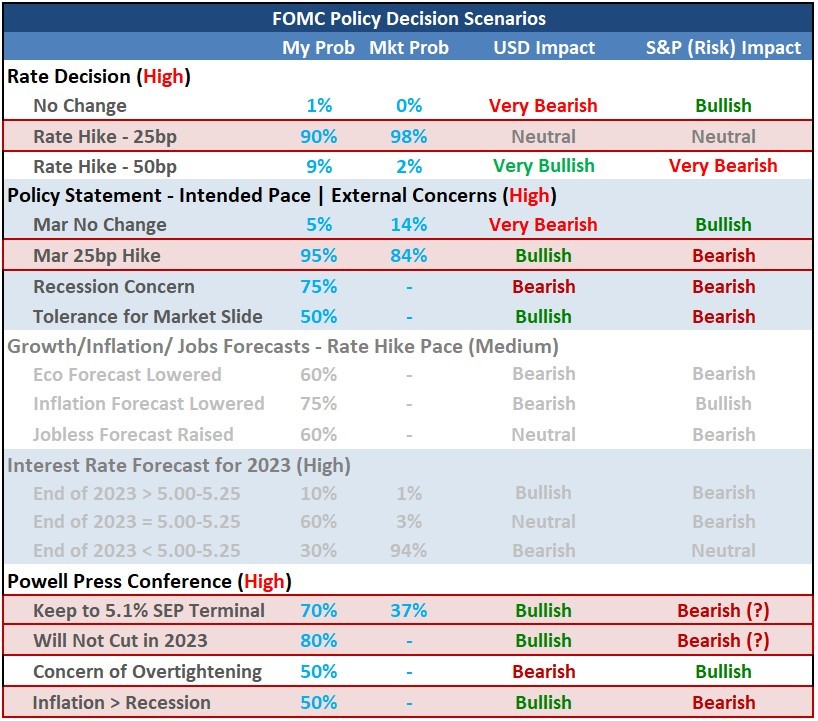
What was the motivation for the charge in risk assets and the further slump in perceived fear via measures like the VIX volatility index? Clearly, the run took place after the announcement of the FOMC rate decision. However, the outcome of that event doesn’t offer much in the way of genuine support for those plotting a long-term bullish market. The 25bp rate hike in the benchmark range to 4.50 to 4.75 percent is the highest among its major peers, but it was nevertheless fully priced in and thereby a minor factor. The real impact came from the elements used to project what happens from here. In the policy statement, the Fed kept in language suggesting a few more rate hikes was likely. Fed Chairman reiterated that perspective in his Q&A period. That isn’t exactly a surprise given what the central bank had projected in its SEP released with the December meeting – they projected a terminal rate of 5.1 percent (or 5.125 average) – but the markets have maintained skepticism that they will follow through. Furthermore, the Fed’s believe that it would not hike this year was repeated without changing the market’s disbelief.


FOMC Scenario Table with Highlighted Outcomes

Table Created by John Kicklighter


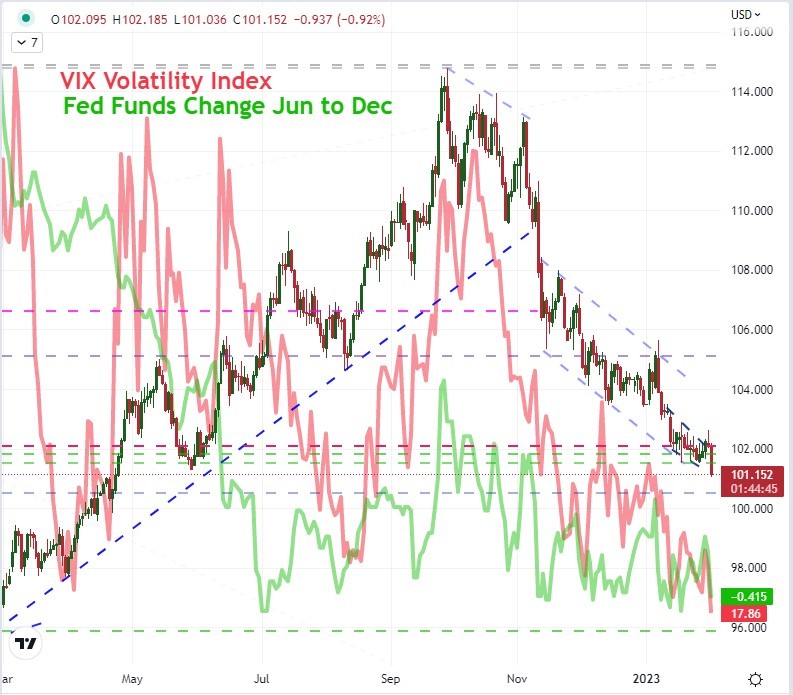
By most accounts, the Fed’s policy decision was a mildly hawkish outcome; but overlaying the market’s skepticism, it comes off as a step away from a peak rate and eventual cuts. Whether the market’s divergent view on policy course is founded in the inflation forecast or perhaps the unrelenting association of a dovish Fed that capitulates at the sign of trouble from the past decade, the bulls have their guiding light. While I maintain a healthy skepticism over central bank commitments based on forecasts which necessarily have to change, it seems unlikely that the Fed will deviate from its inflation fight. If they are forced from that path, it would likely come in response to a particular troubling recession picture or financial crisis – both of which are greater threats to risk trends than easier monetary policy is a boon. Nevertheless, the market can operate on its own views until there is something hard and fast to dissuade the house view. Another market that finds itself in an impressive position is the US Dollar. The DXY Index dropped to its lowest level since April after dropping through the midpoint of the 2021-2022 range. While the US sports a higher yield and market-forecasted terminal rate than most of its counterparts, the Greenback’s backing as a safe haven seems to pulling it down (with the drop in VIX) and the speculation of Fed hikes in the second half (which may also be suppressing the VIX) is posing direct pressure.


Chart DXY Dollar Index Overlaid with VIX Volatility Index and Implied Fed Change in 2H (Daily)

Chart Created on Tradingview Platform


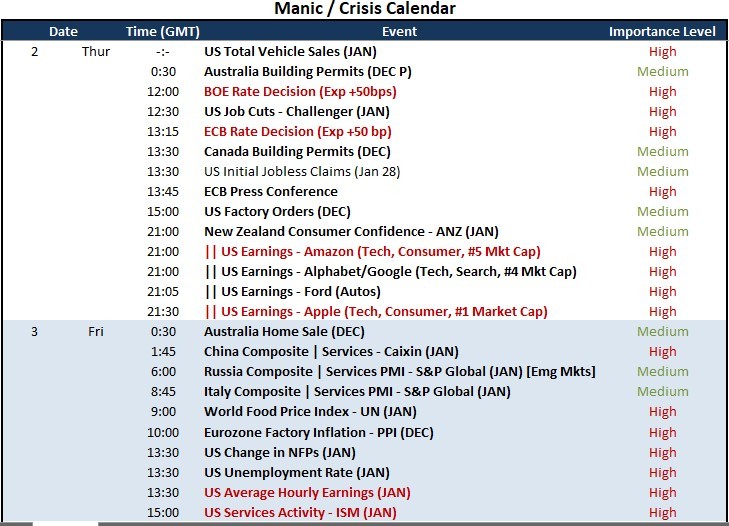
As we move into the back half of the week, I will be keeping a vigilant eye on the lift behind the renewed ‘risk appetite’. Just because I’m dubious of the foundation of a charge, doesn’t mean that the markets will have to rebalance to that outlook. As the saying goes ‘markets can remain irrational longer than you can solvent’. Then again, high profile event risk can generate serious circumspection on unevenly held believes. Looking at the docket for the next 48 hours, there will be a lot of challenge to fundamental stability. The ECB and BOE rate decisions will offer a bigger picture of monetary policy in context of risk taking. After Meta’s charge afterhours Wednesday, we will have the run of Amazon, Google and Apple after close Thursday. Then on Friday, we have the US nonfarm payrolls.


Top Global Macro Economic Event Risk for Next Week

Calendar Created by John Kicklighter


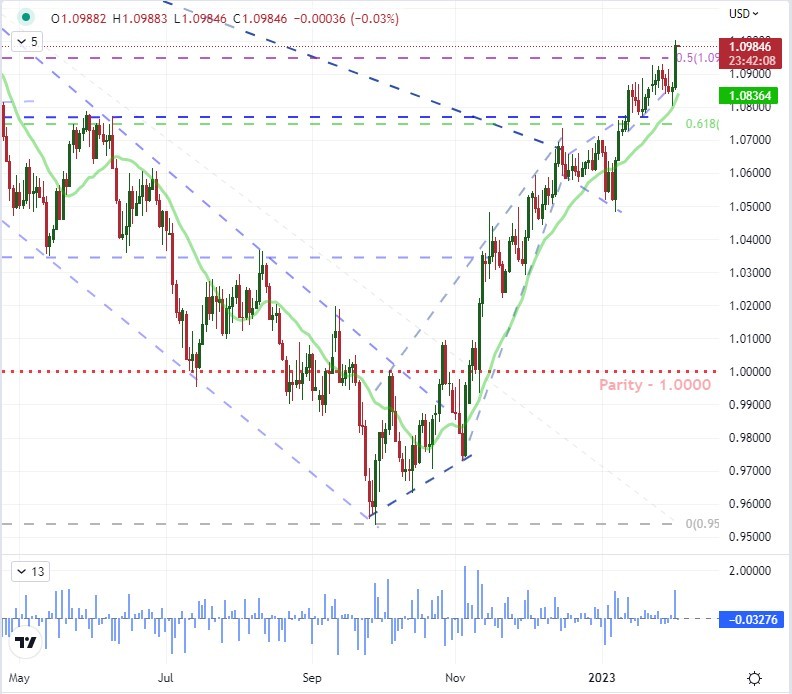
For a top market on my ‘must watch’ list, the EURUSD is easily the most interesting. It is the largest component of the DYX Index, so there is much of the same impressive technical performance on display. For this benchmark cross, the 1.2 percent charge was the biggest since November 11th – when the pair made its definitive turn after the US CPI release. What’s more, the charge pushed the exchange rate above the midpoint of its January 2021 to September 2022 bear wave. That said, the fundamental weight is serious here. This is the most liquid currency cross, so the Dollar’s have status is dampened here. That puts greater scrutiny on the relative interest rate standing, and the ECB is seen capping its own rate hike cycle well below the Fed. Will that factor in?


Chart of EURUSD with 20-Day SMA and 1-Day Rate of Change (Daily)

Chart Created on Tradingview Platform


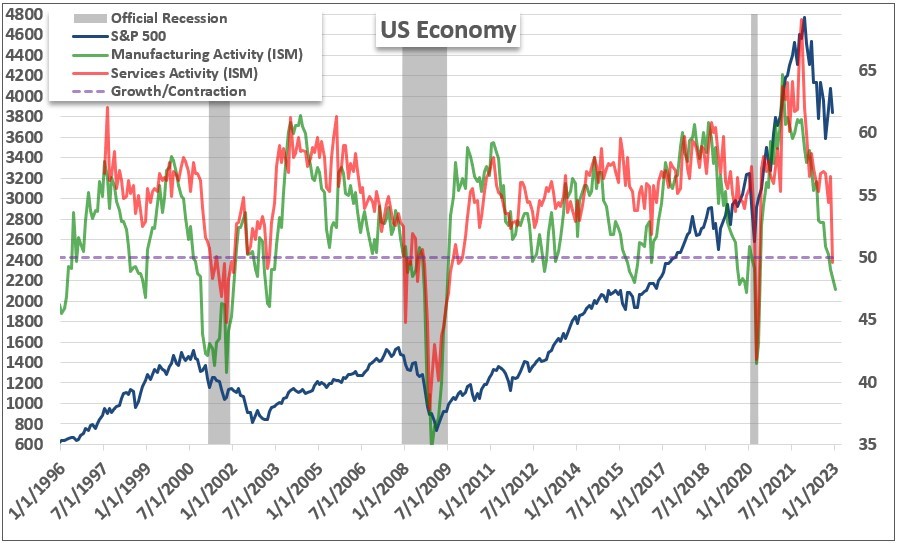
While there is a lot of event risk on tap and plenty capable of generating discrete volatility, the most interesting event through week’s end in my book is the ISM service sector activity report. Overlooked this past session was a deepening slide into contraction for manufacturing activity according to the same group. That does not bode well for a market that seems confident on the trajectory of growth. The US economy is heavily skewed in employment and output in services, so if last month’s surprise contraction is extended, it could break through the market’s complacency on risks ahead.


Chart of S&P 500 with US Mfg and Service Activity, Overlaid with Official Recessions (Monthly)

Chart Created by John Kicklighter

Natural Gas Price Plunge Extends, Milder-Than-Expected US Weather in Focus

Natural Gas Price Plunge Extends, Milder-Than-Expected US Weather in Focus

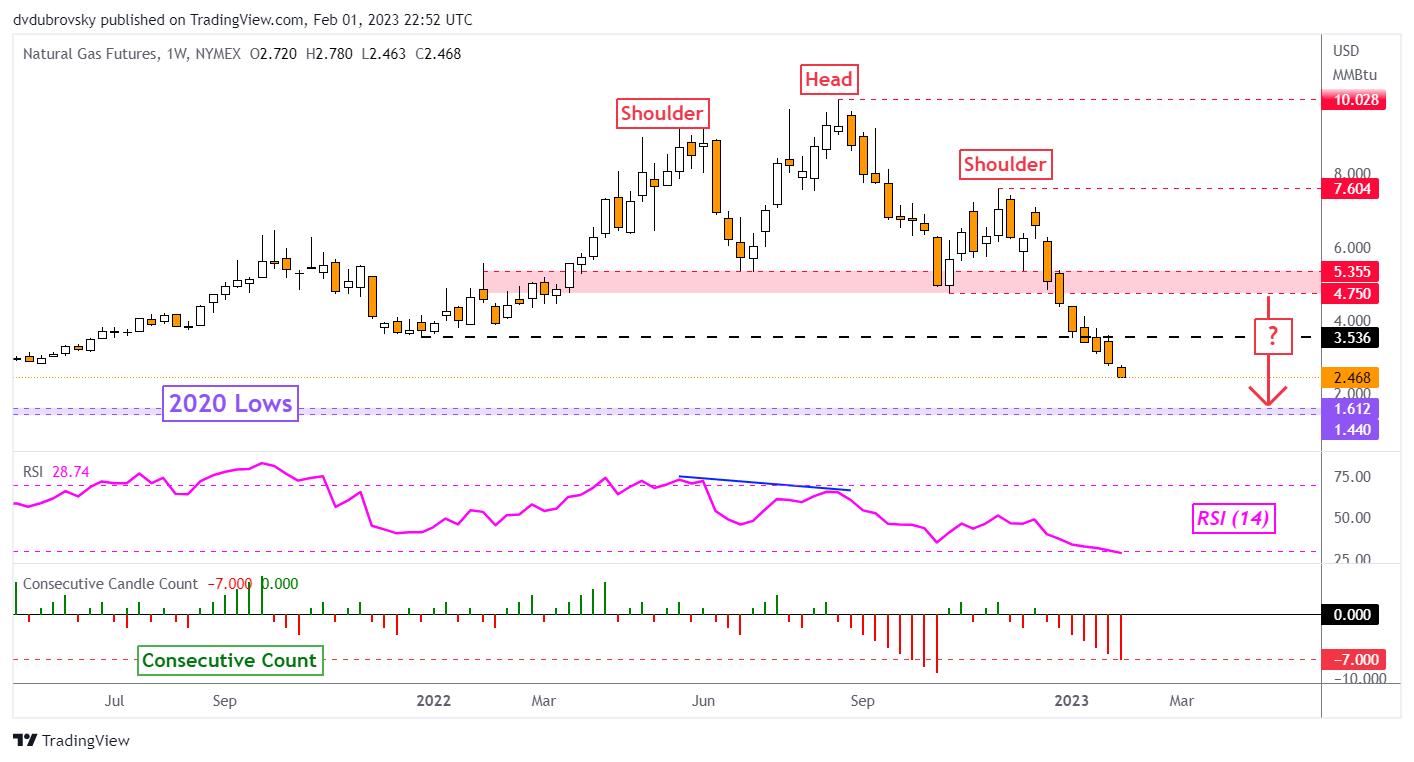
Weekly Chart – Prices Plunge on Milder US Weather Outlook

Natural gas prices extended losses over the past 24 hours. According to data from the US National Weather Service, above-normal weather conditions are seen across the central and eastern United States in the week ahead. The higher-than-expected temperatures could result in reduced demand for the heating commodity.

On the weekly chart below, natural gas continues to make downside progress in the aftermath of a bearish Head & Shoulders chart formation. The ultimate target of the formation is the 2020 low, which makes for a key range of support around 1.44 – 1.61. The commodity is now heading for a 7th week of consecutive losses, the most since October. It is down about 13.4% this week so far, the most since early January.

Weekly Chart – Prices Plunge on Milder US Weather Outlook

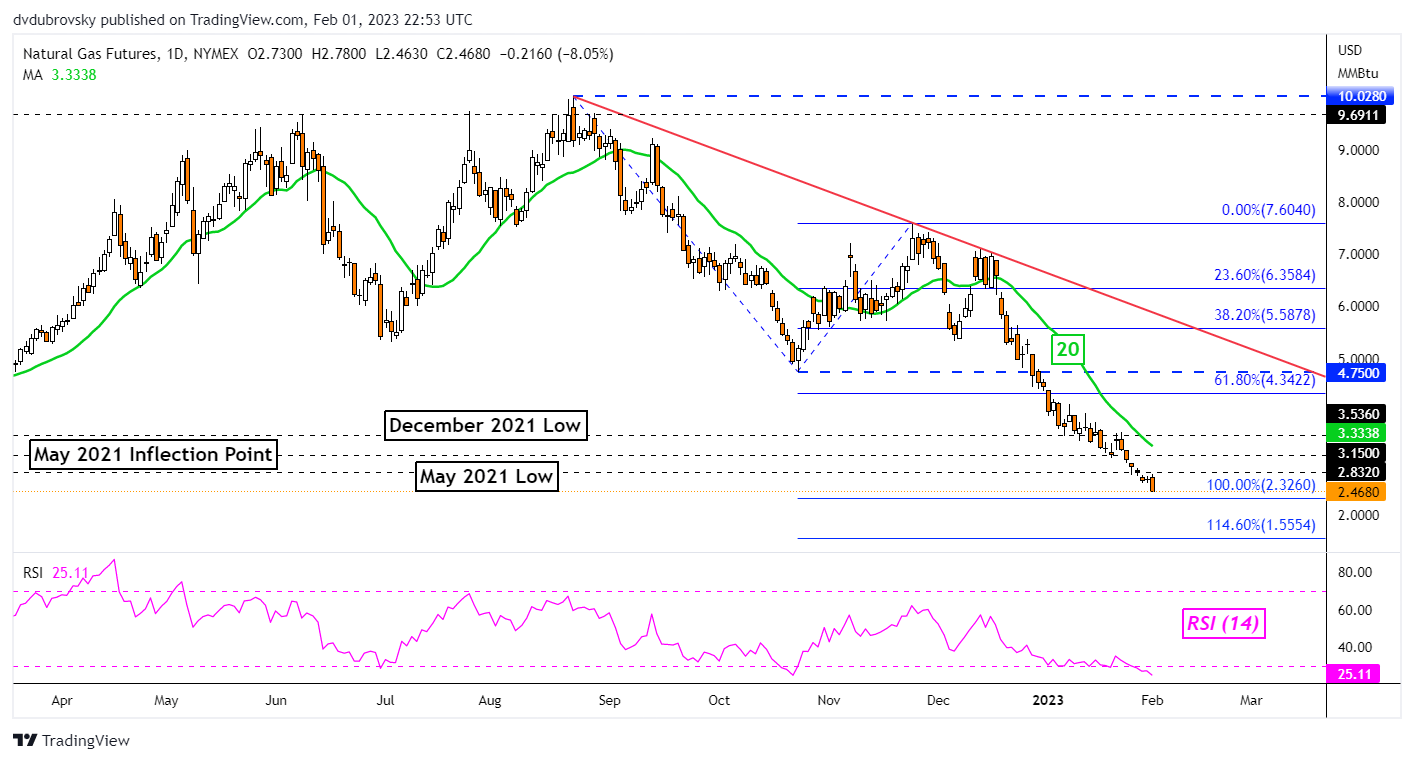
Daily Chart – Worst Drop Since January 5th

On the daily chart, natural gas sank 8.05% on Wednesday. That was the worst single-day drop since January 5th, almost one month ago. Prices have confirmed a breakout under the May 2021 low at 2.832, bringing the commodity towards the 100% Fibonacci extension level at 2.326. The latter may hold as support.

Bouncing on support could open the door to facing the 20-day Simple Moving Average (SMA). This is maintaining the downside focus. As such, the line may hold as resistance, pivoting prices lower. Breaking under 2.326 exposes the 114.6% Fibonacci extension level at 1.555 toward 2020 lows. A lack of RSI divergence continues to show that momentum is favoring the downside from here.

FUNDAMENTALS BREAKOUT TRADING

Daily Chart – Worst Drop Since January 5th

US Dollar Slammed Post FOMC as Markets Test Fed Resolve. Where to for USD?

US Dollar Slammed Post FOMC as Markets Test Fed Resolve. Where to for USD?

The US Dollar is under the pump today even though the Federal Open Market Committee (FOMC) hiked the target rate by 25 basis points (bp) as widely anticipated.

While the move is unequivocally a tightening of policy, it was in the post-meeting press conference that the message appeared to get somewhat jumbled when Fed Chair Jerome Powell mentioned the “D” word. Disinflation.

The mere mention of the word seems to have triggered a serotonin surge for equities and bonds. The Nasdaq led the bourses higher, up by 2%, while Treasury yields fell around 10 bp across the curve from 2 years and beyond.

The benchmark 10-year note traded under 3.4%, a long way from the 4.33% peak seen in October last year

On the face of it, Powell’s comments seemed rational. Most notably, he said that he does not see any rate cuts happening this year and that ongoing increases will be appropriate.

In reference to the escalating debt ceiling issue, he also said that no one should assume that the Fed can protect the economy. He made it clear that it is an issue for congress and not something that Fed can tackle.

He acknowledged that disinflation had occurred and welcomed the reduction in price pressures but that there was still work to be done. This aspect of his comments appears to have gained the most traction for markets.

Prior to the meeting, most members of the committee said that rates needed to continue higher and that they would need to stay there for a long period in order to deal with the highest CPI in 40 years.

Speaking on Bloomberg television, Stanford Professor John Taylor, inventor of the Taylor Rule, said he thinks that the Fed funds target rate will need to get above 5% to deal with inflation. The market is pricing in a peak near 4.9%.

The consequences of inflation, tight monetary policy and corresponding impacts on the US economy appear to be absent from market thinking for now.

The Euro, Aussie and Kiwi are the biggest beneficiaries of the ‘big dollar’s’ demise while the Loonie barely nudged. The DXY index*, a benchmark measure of the US Dollar, has hit a 9-month low.

Looking forward, The European Central Bank and the Bank of England are meeting later today. Both banks are forecast to raise their respective rates by 50 bp.

*The DXY index is a US Dollar index that is weighted against EUR (57.6%), JPY (13.6%), GBP (11.9%), CAD (9.1%), SEK (4.2%) and CHF (3.6%).

60-YEAR CHART – US GDP AND INFLATION

image1.png


S&P 500 and NASDAQ 100 INDEX Technical Outlook: Bullish View Intact After the Fed

S&P 500 and NASDAQ 100 INDEX Technical Outlook: Bullish View Intact After the Fed

US equity indices’ jump on Wednesday after the US Federal Reserve’s interest rate decision further confirmsthe bullish outlook highlighted in the weekly forecast last weekend.

The Fed hiked interest rates by 25 basis points to 4.5%-4.75%, in line with expectations, and said “ongoing increases” to rates would be appropriate. However, the US central bank acknowledged that inflation has eased. “We can now say for the first time that the disinflationary process has started,” Fed Chair Jerome Powell told reporters, boosting hopes that the Fed is nearing the end of the current rate hiking cycle. The futures market continues to price in rate cuts this year with the fed funds rate seen below 4.50% by the end of December.

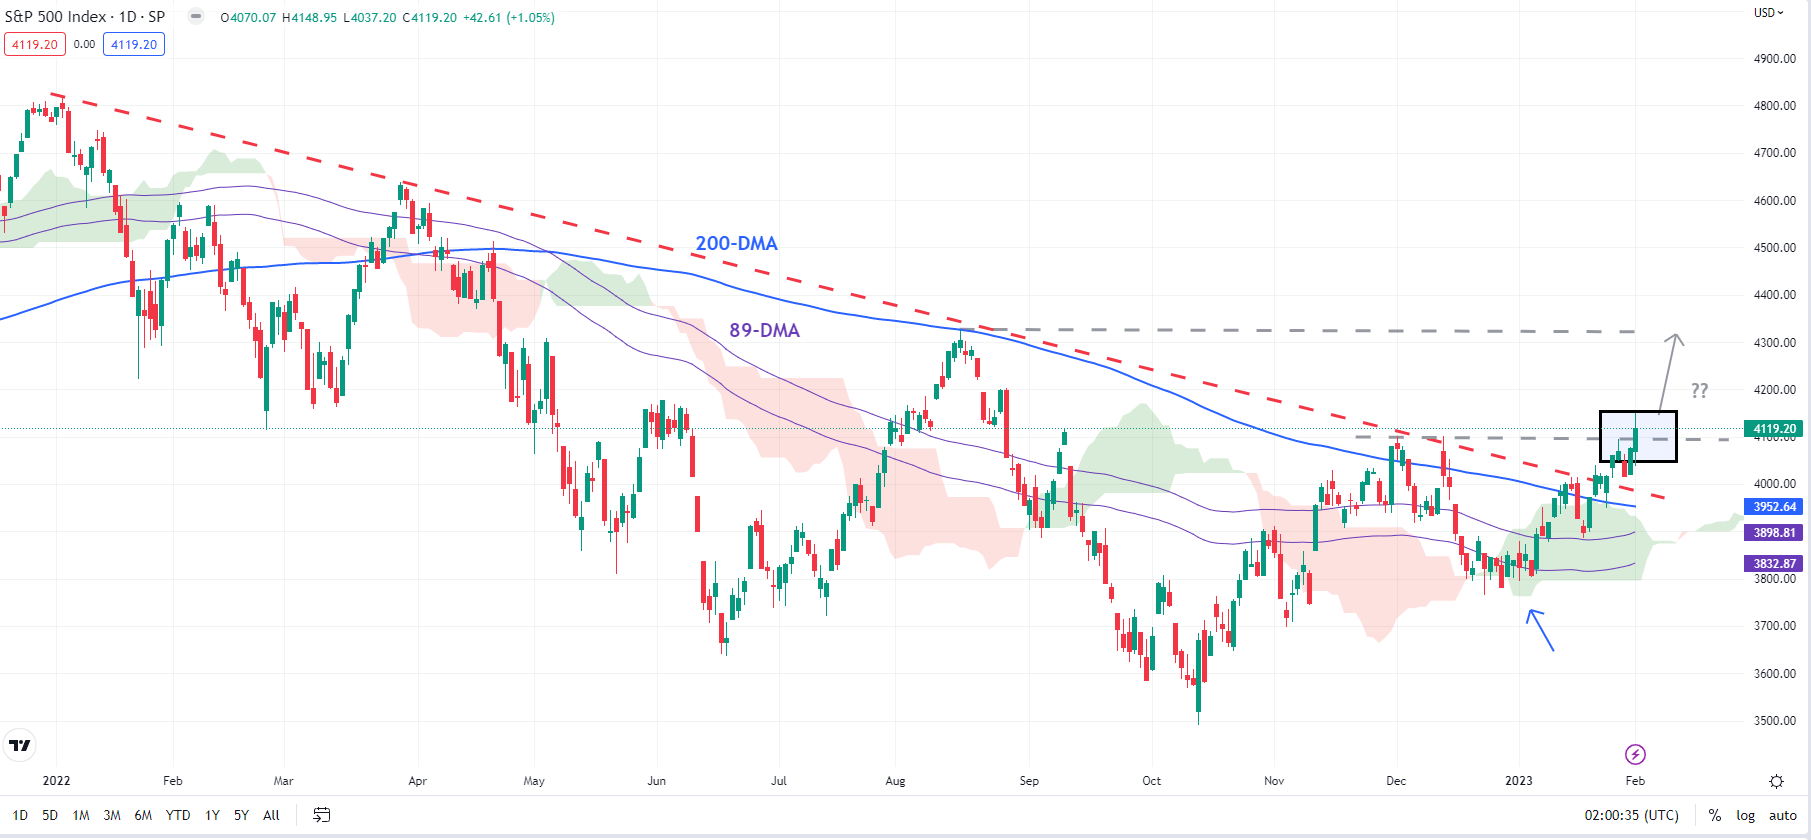
S&P 500 INDEX TECHNICAL OUTLOOK – BULLISH

The S&P 500 closed on Wednesday above crucial resistance at the early-December high of 4100, reasserting the bullish bias. This follows a rise above another vital barrier on the 200-day moving average and a rebound from quite a strong cushion around the Ichimoku cloud support on the daily chart.

S&P 500 Daily Chart

image1.png

While the upward momentum has improved recently, one closer above Wednesday’s high would cement the view that the index had formed an important base. Moreover, the European Central Bank and the Bank of England interest rate decisions today and US jobs data on Friday could provide further cues.

A decisive close (2 daily closing highs) would establish the higher-highs-higher-lows sequence for the first time since January 2022. Such a break could pave the way toward the August high of 4325. It would also present an opportunity to revisitthe Q1-23 outlookin light of the recent chart developments.

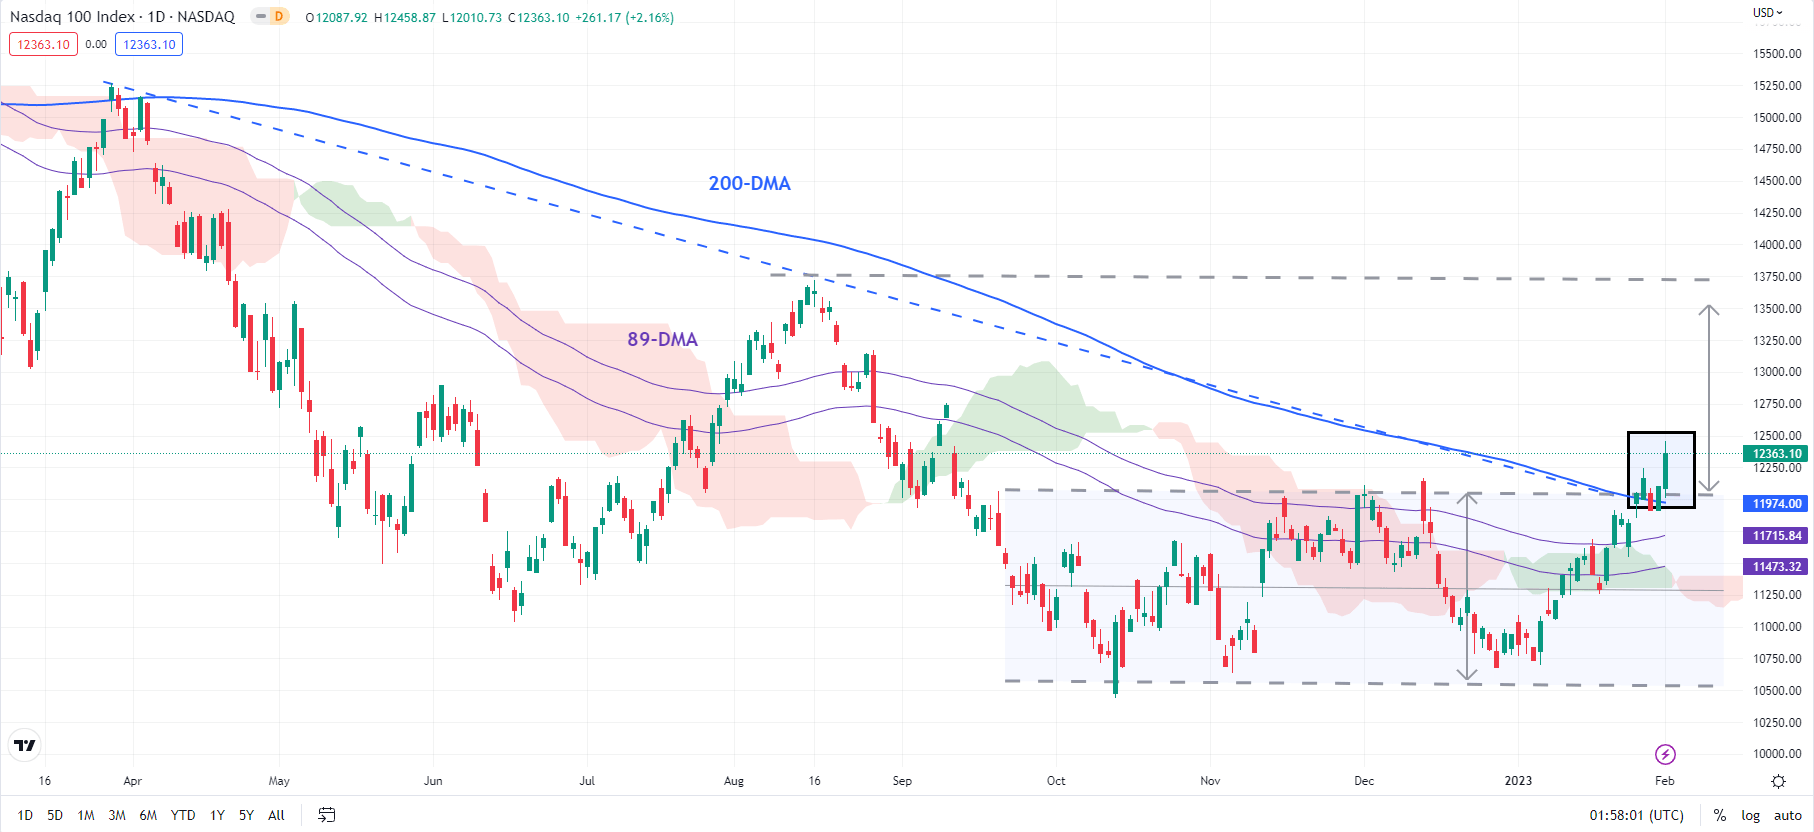
NASDAQ 100 Daily Chart

image2.png

NASDAQ 100 INDEX TECHNICAL OUTLOOK – BULLISH

The Nasdaq 100 index, which wrapped the best January performance in 20 years, on Wednesday rose above stiff converged hurdle, including the December high of 12166 and the 200-day moving average. This is the first time the index has risen above the multi-week average since January 2022, raising the prospect of a more sustained bounce relative to the corrective rallies in 2022.

However, given the events risks and key US data due tomorrow, it might be prudent to wait for one more close higher. Such a move would raise the odds of a rise toward the August high of 13720 as it would trigger a bullish break from the sideways channel since the end of 2022. Furthermore, if the Nasdaq 100 index manages to close this week above 12166 then it would also imply that the base around the 200-week moving average had been set.

Euro Hits New High as US Dollar Collapses in Fed Aftermath. Where to for EUR/USD?

Euro Hits New High as US Dollar Collapses in Fed Aftermath. Where to for EUR/USD?

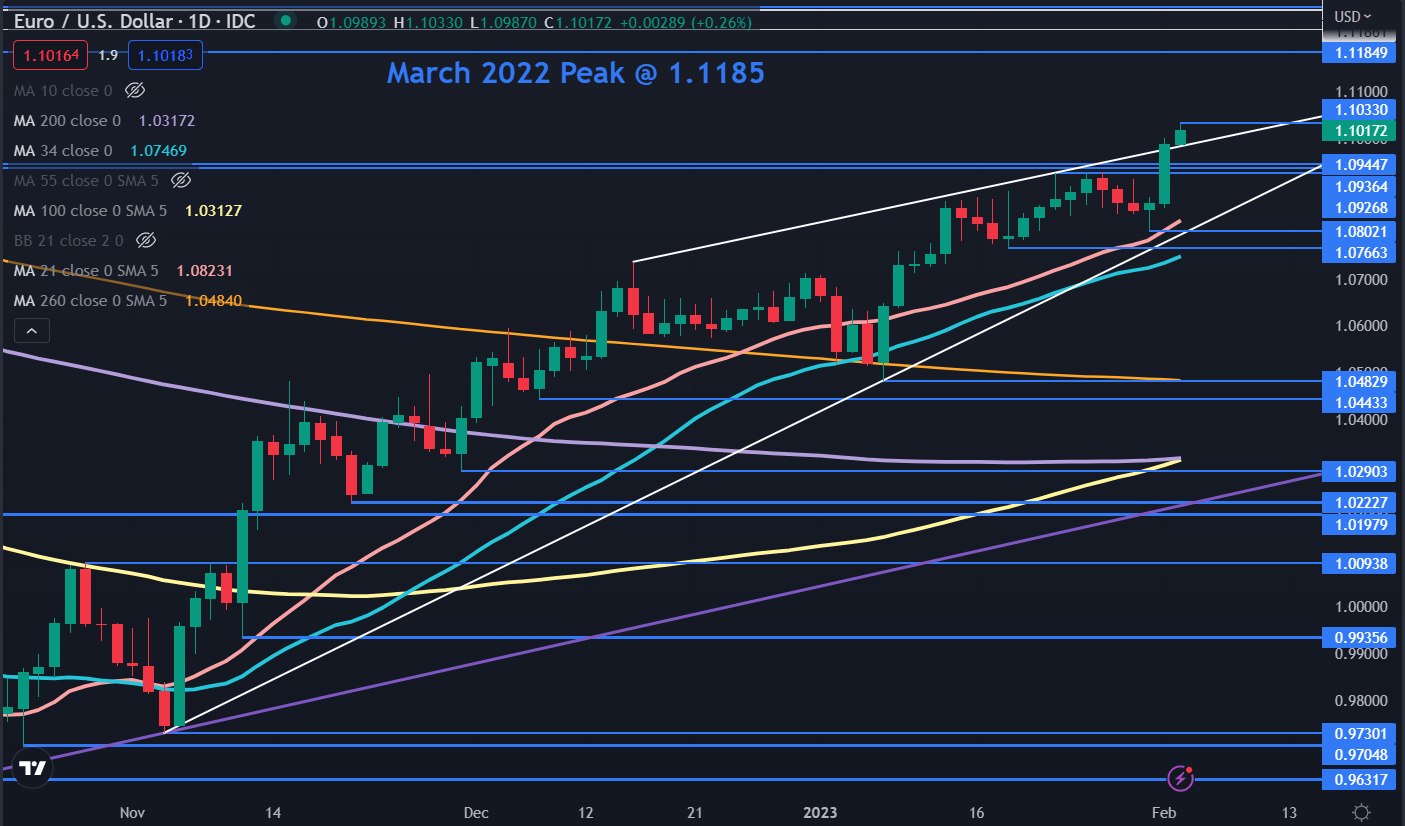
The Euro and the British Pound extended gains seen immediately after Fed Chair Jerome Powell’s press conference. EUR/USD hit a 10-month high at 1.1033 today.

The US Dollar sunk across the board as the market interpreted his remarks as a dovish tilt, despite the Federal Open Market Committee (FOMC) raising rates by 25 basis points (bp) just prior, as forecast.

The European Central Bank (ECB) and the Bank of England (BoE) will be meeting later today and both banks are anticipated to raise their respective rates by 50 bp.

Powell reiterated that rates would need to go higher, and he doesn’t see a cut this year. Interest rate futures are pricing in cuts. It seems as though his mere mention of the word ‘disinflation’ set markets alight with equities and bonds both roaring higher.

Treasury yields dipped around 10 bp across the curve from the 2-year note and further out. The benchmark 10-year bond traded under 3.4%, a long way from the 4.33% peak seen in October last year

All the US equity indices finished their cash session higher with the Nasdaq leading the charge, posting a 2% gain. APAC equities were boosted by the sentiment with the tech sector leading the charge higher. Korea’s Kosdaq index was up over 1.7%.

Elsewhere, Australian building approvals were a massive beat, coming in at 18.5% month-on-month in December rather than the 1.0% forecast. AUD/USD went to a 7-month peak of 0.7158.

Crude oil sunk after Energy Information Administration (EIA) data showed inventories increased by 4.1 million barrels last week, well above market estimates. The sell-off was somewhat mitigated later when the US Dollar collapsed.

OPEC+ left production targets unchanged at their gathering. The WTI futures contract is near US$ 77 bbl while the Brent contract is approaching US$ 83.50 bbl. Gold made a 10-month high at US$ 1,957 an ounce on USD weakness.

The BoE and ECB monetary policy meetings will be the key focus today with ECB President Lagarde speaking after the conclave. Later, the US will see durable goods and factory goods order data.

EUR/USD TECHNICAL ANALYSIS

EUR/USD broke a series of breakpoints and prior peaks in the 1.0927 – 1.0945 area overnight and that zone may provide support.

Further down, support might also be at the previous lows of 1.0802 and 1.0766.

In the run-up to the 10-month high of 1.1033, it also broke the topside of an Ascending Triangle. A move back through this triangle might signal a reversal.

Resistance could be at that recent high or the March 2022 peak of 1.1185.

image1.png


Gold Prices Rallied as Markets Kept Betting Against the Fed, Now What?

Gold Prices Rallied as Markets Kept Betting Against the Fed, Now What?

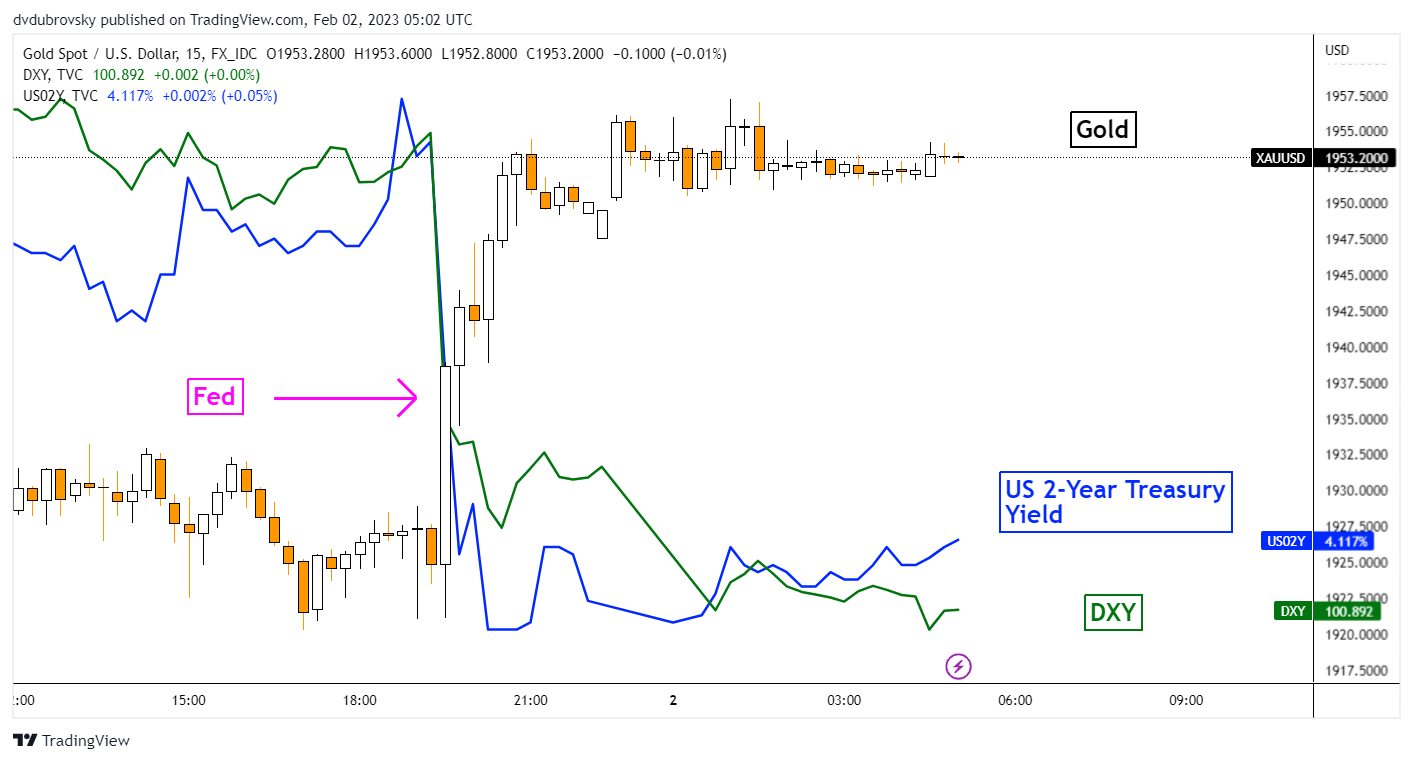
Gold prices gained 1.14 percent on Wednesday, the most in almost 2 weeks. The yellow metal is on course for a 7th consecutive week of gains. That would be the longest winning streak since the summer of 2020. All eyes were on the Federal Reserve over the past 24 hours, which delivered a 25 basis point rate hike, as expected. That brought benchmark lending rates to a range of 4.50% – 4.75%.

As usual, the focus was on what could come rather than on what occurred. Since the end of last year, markets have been pricing in an increasingly dovish outlook. As a result, the US Dollar and Treasury yields fell as the S&P 500 gained. The Chicago Fed National Financial Conditions Index is at its lowest since the Fed started tightening last year – a sign of easing liquidity in markets despite quantitative tightening.

What did Chair Jerome Powell say? He acknowledged that inflation has eased somewhat but that ‘it remains elevated’. He stressed that the central bank ‘will need to stay restrictive for some time’ and that if the economy performs as expected, policymakers don’t see cuts this year. How did the markets respond?

Despite Powell’s rhetoric, financial markets continued to bet against the central bank. Fed Fund Futures point at 2 rate cuts towards the end of this year. This is as traders added in almost half a cut to the 2-year horizon. On the intraday chart below, you can see the US Dollar falling alongside front-end bond yields. Gold rallied, capitalizing as the ‘anti-fiat’ trading instrument.

Powell was questioned about the recent easing in financial conditions, but his answer left more to be desired. He said that the focus is “not on near-term moves, but on sustained changes”. All things considered; this continues to leave markets vulnerable to disappointment if a pivot becomes increasingly unlikely. To that end, the focus remains on economic data and non-farm payrolls on Friday.

Gold Surges During the Federal Reserve Rate Decision

Gold Surges During the Federal Reserve Rate Decision

Gold Technical Analysis

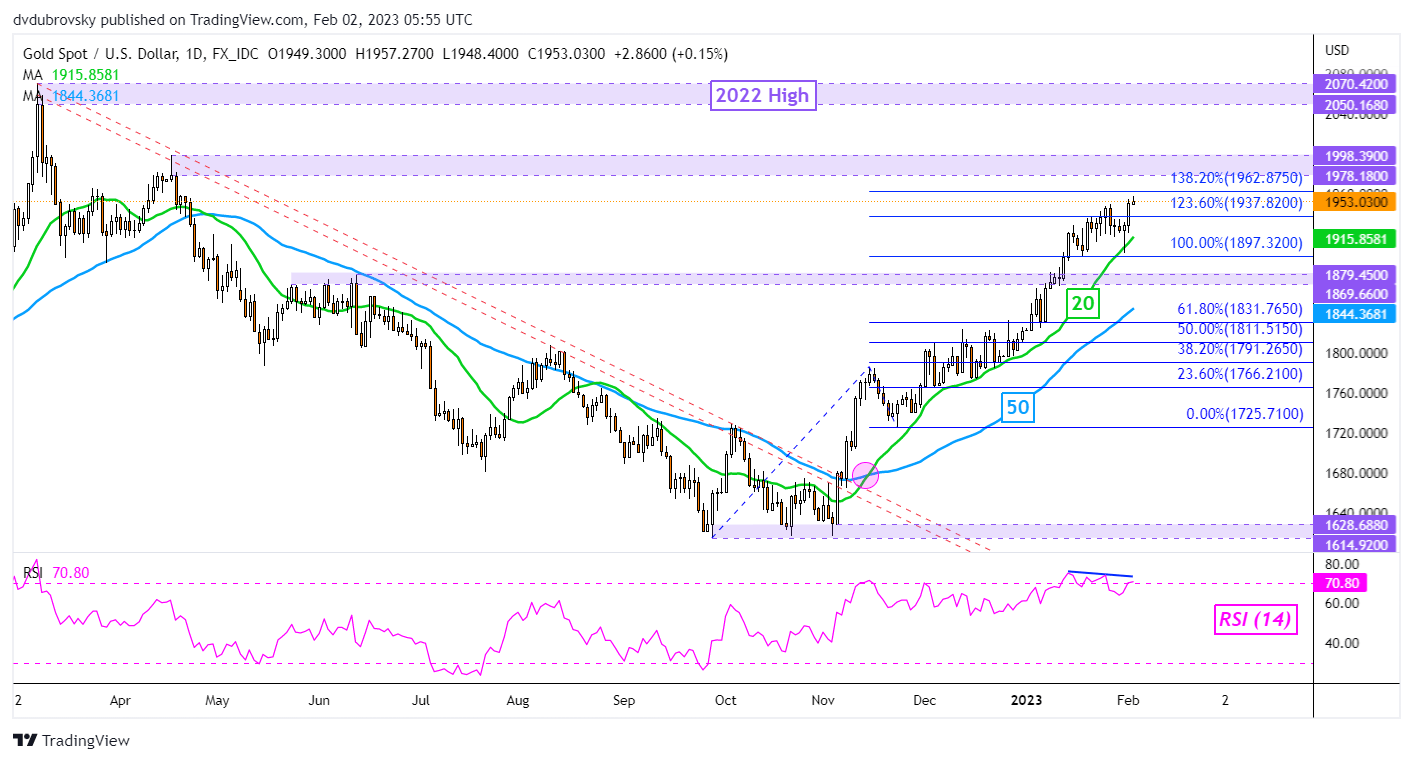
Gold closed at a new high this year, taking out the January peak at 1949.16. That placed XAU/USD closer to the key 1978 – 1998 resistance zone. Negative RSI divergence is present, showing that upside momentum is fading. That can at times precede a turn lower. In such a case, the 20-day Simple Moving Average (SMA) could maintain the upside focus.

XAU/USD Daily Chart

XAU/USD Daily Chart