Crude Oil Technical Outlook: Downward Pressure Intact

Crude Oil Technical Outlook: Downward Pressure Intact

CRUDE OIL TECHNICAL OUTLOOK – BEARISH

Crude oil’s slide may have slowed in recent months but hasn’t altered the broader downward pressure.

The break in August triggered a double top pattern (the 2022 highs), pointing to a drop toward the 200-week moving average (now at about 66.00), the price objective of the pattern. Since then, crude oil has been guided lower in a slightly downward-sloping channel, characterized by lower-highs-lower-lows.

Crude Oil Weekly Chart

image1.png

Even though oil hasn’t made a fresh low since December, the weak structure remains intact. For the downward pressure to fade, at minimum, crude oil needs to break above the upper edge of the declining channel (now at about 87.70). Moreover, the brief rallies since late 2022 have lacked any meaningful upward momentum, as the 14-week Relative Strength Index shows. The RSI has stayed under 50, indicating a bias toward the downside.

Crude Oil Monthly Chart

image2.png

Furthermore, downward momentum on the monthly charts remains firmly in place, raising the risk of some more weakness in oil in the interim. Beyond the short-term, the big picture for oil continues to stay bullish while it says above the end-2021 low of 62.50 is a vital support.

Despite the softness since last year, the Moving Average Convergence Divergence indicator (MACD) stays above zero on the monthly chart – a sign of strength. Having said that, the bearish crossover by the MACD last year confirms that the medium-term upward pressure has faded (but not reversed). Bearish crossovers in the positive territory are a sign that bullishness is easing, but not bearish, and vice versa.

S&P 500 and USDJPY: FOMC Strategy Run Down

S&P 500 and USDJPY: FOMC Strategy Run Down

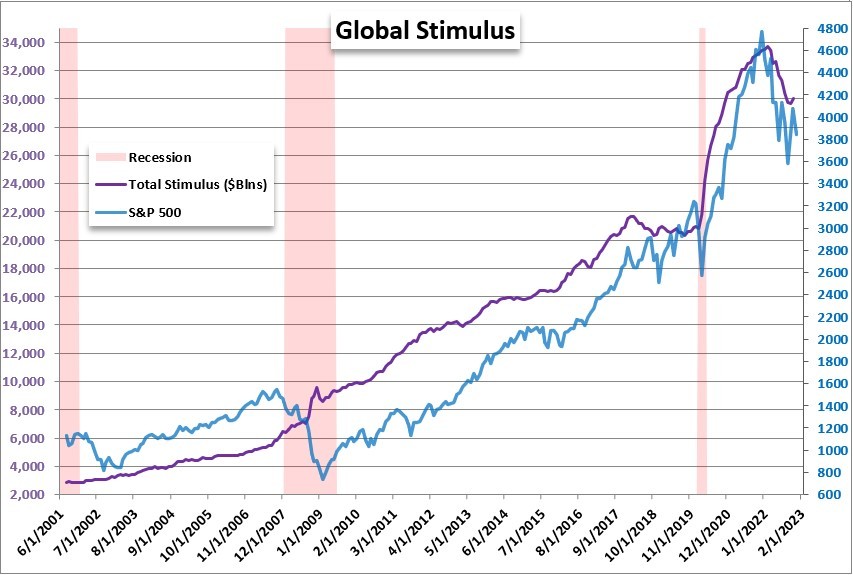
We are closing in on this week’s most closely observed, major event risk: the FOMC rate decision. Despite the market’s general view that monetary policy for the US and major central banks is near the terminus of the tightening regime, the impact of speculation around the nuance of this immediate future seems to be growing. The influence of interest rates and stimulus is so profound due to the decade-plus dive into unorthodox accommodation by the world’s largest central banks to first stabilize the world coming out of a financial crisis (the ‘Great Recession’). After three or four years of that firefighting, however, the intent began to blur. A fight against a European debt crisis and its potential contagion offered some justification to carry on, but eventually the economic impact diminished to be replaced with a passive effort to keep financial markets steady. For those that came to trading/investing in the past decade, they have never not known this aspect of the system. In turn it may be hard for these market participants not to consider stimulus a permanent ‘mean-reverting’ structure, which in turn renders skepticism against the central banks’ stated intent to unload the burden of risk back onto the market’s own shoulders. That’s the backdrop that formulates the importance of this week’s top event.

Chart of S&P 500 Overlaid with Aggregate Major Central Bank Stimulus and US Recessions (Monthly)

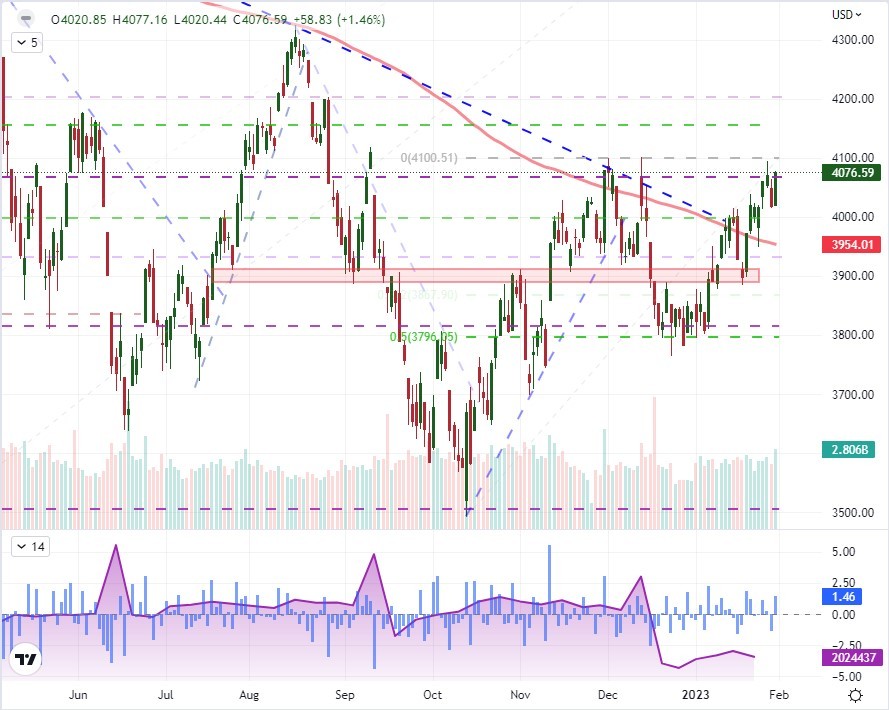
Heading into the Fed decision, some of the anxiety that is naturally stoked by the scope of the event can be seen across the capital markets. I referenced the errant volatility in benchmarks like the S&P 500 below or the extremely restrictive range for the US Dollar (DXY Index). Both are indicative of a market absorbed in the range of possibilities for an exceptional fundamental event. For the DXY, a flare up of volatility wouldn’t widen the now 12-day and 1.37 percent range – the most restrictive trading in nearly a year. For the S&P 500, 1.5 percent rally was a little more unusual. While the intensity of the charge looks like a side effect of the anticipation, a build up ‘risk on’ interest before an event that could struggle to ‘pay’ for that enthusiasm is unusual. Index volume was the highest since the December 16th holiday wash while open interest in emini futures is still near its lowest levels since 2007. This is unusual activity and may add to a volatile reaction after what will likely be a ‘in-line’ outcome from the Fed.

Chart of S&P 500 with 200-day SMA, Volume, E-mini Futures Open Interest and 1-Day ROC (Daily)

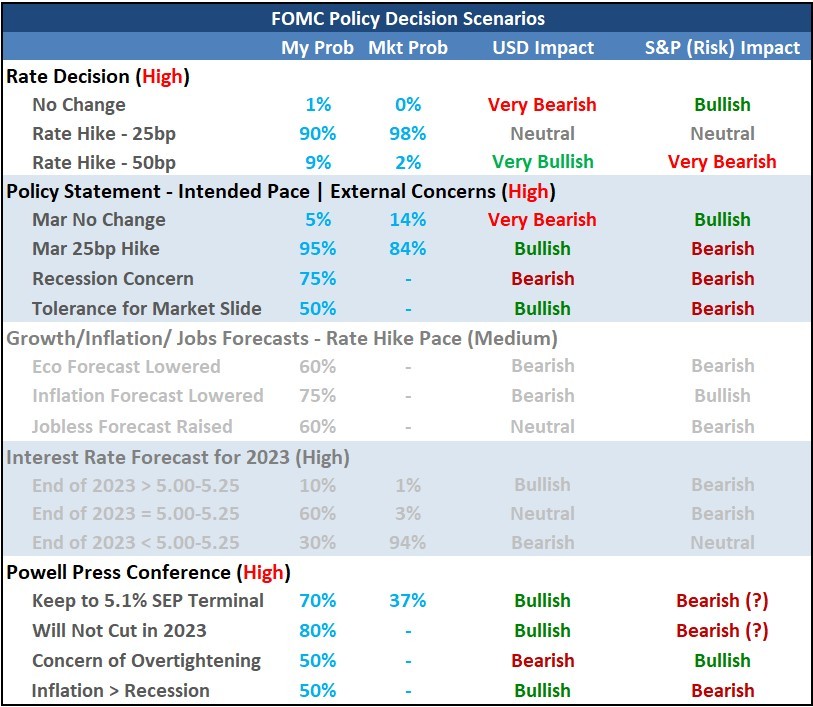
So, what are we looking for from the Federal Reserve’s first policy announcement of 2023? This is not one of the so-called quarterly meetings which offer updated forecasts for growth, inflation, employment and interest rates – also referred to as the Summary of Economic Projections. That leaves us with: the actual changes to policy; the monetary policy statement and the Chairman Jerome Powell’s press conference a half hour later. The markets are highly confident (98 percent according to Fed Fund futures) that the Fed will further step down its tempo of tightening from December’s 50 bp increase to a 25 bp move today. Given the certitude of the markets in this pricing, any deviation here would be the basis for serious volatility in repricing. Otherwise, the focus will shift to the standard for speculation as of late: how far and long will this rate hike regime extend. According to futures, the market expects only one more 25 bp hike in March which would lift the terminal rate to a range of 4.75-5.00 percent. The problem is that the Fed itself projected a terminal rate range of 5.00-5.25 (or a mid-level of 5.1 from 5.125) percent. Will the markets just continue to agree to disagree or will Powell’s remarks justify or close the gap? Therein lies the volatility potential.

FOMC Scenario Table

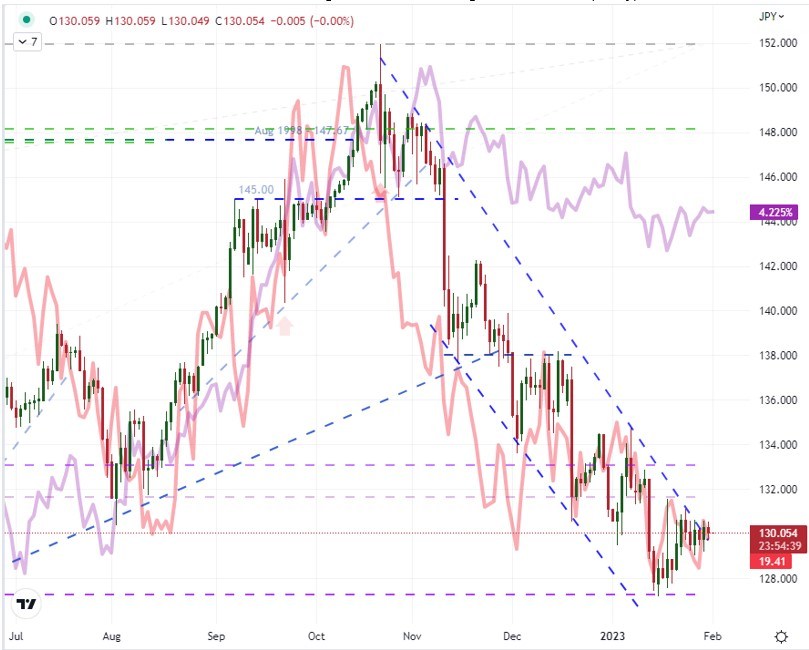
Shifting gears to general ‘risk’ response to this week’s top fundamental listing to more targeted influence, USDJPY is at the top of my list. For those evaluating the Dollar’s response to the policy update, consider the scope of major event risk that will print around and after the US central bank’s update. In particular, a preferred exchange rate like EURUSD will be heavily complicated by the European Central Bank’s (ECB) own monetary policy decision on Thursday. As far as the USDJPY goes, the Japanese docket is fairly light. More importantly, the BOJ doesn’t offer much in the way of monetary policy contrast, so it is more fully a Dollar reflection. On that front exchange rate has deviated from the yield spread between the US-Japan, but the more potent factor for me is the potential of volatility. There is a strong correlation between USDJPY and VIX. And, while it is possible that the Fed event passes uneventfully such that it deflates expected volatility, the reading is already very low. The potential for further substantial retrenchment is low. Alternatively, the risk – and impact – of a flare up is high.

Chart of USDJPY Overlaid with the US-Japan 2-Year Yield Spread and VIX (Daily)

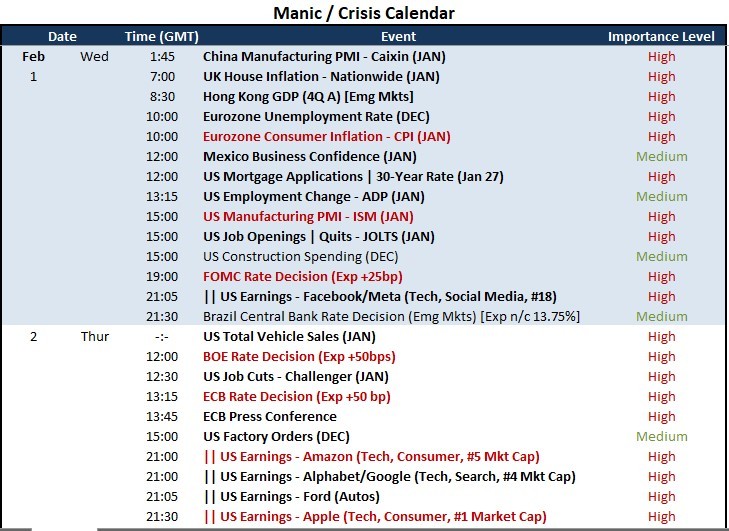
Finally, it’s worth it to take a full stock of what is unfolding around the market while the volatility blinders are up and focused on the FOMC. Wednesday will also tap into US growth potential in the ISM manufacturing report. Earnings will pick up afterhours with Meta/Facebook, but hit their pinnacle tomorrow after the close with Apple, Amazon and Google. Then there are the ECB and BOE rate decisions which will shape the global picture of monetary policy.

Top Global Macro Economic Event Risk for Next Week

Natural Gas Price Downtrend Slows, 4-Hour Chart Reveals Reversal Warnings

Natural Gas Price Downtrend Slows, 4-Hour Chart Reveals Reversal Warnings

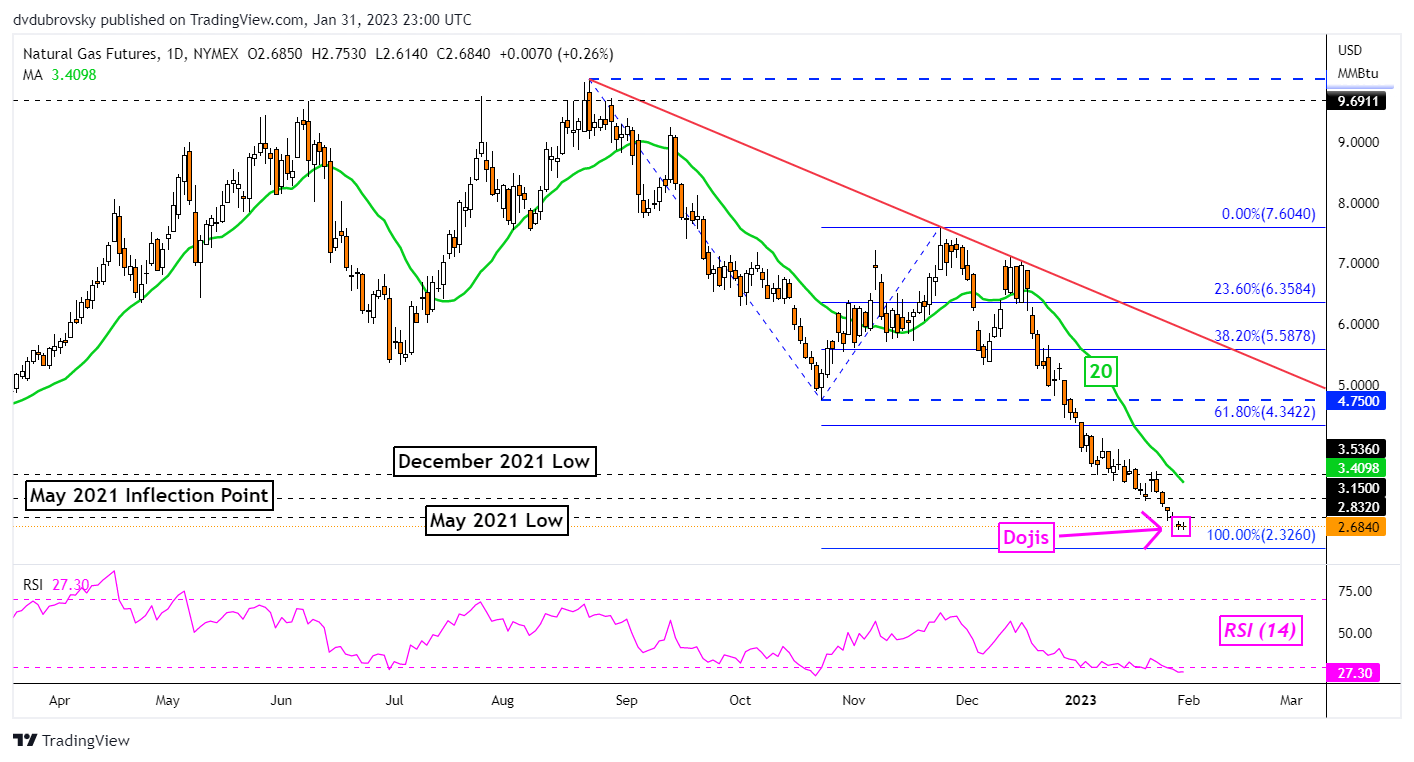
Daily Chart – 20-Day Simple Moving Average Catching Up

Natural gas prices finished little changed on Tuesday, although prices remain lower for this week so far. Another Doji candlestick pattern emerged over the past 24 hours after an identical one formed on Monday. The Doji itself is not necessarily a sign of an imminent reversal. Rather, it paints indecision, especially when it occurs within trending markets.

Follow-through remains important to watch over the remaining 24 hours. Downside momentum is slowing as of late. This is bringing the 20-day Simple Moving Average (SMA) closer into focus. The latter may hold as resistance in the event of a turn higher, maintaining the downside focus. Otherwise, extending losses place the focus on the 100% Fibonacci extension level at 2.326.

Daily Chart – 20-Day Simple Moving Average Catching Up

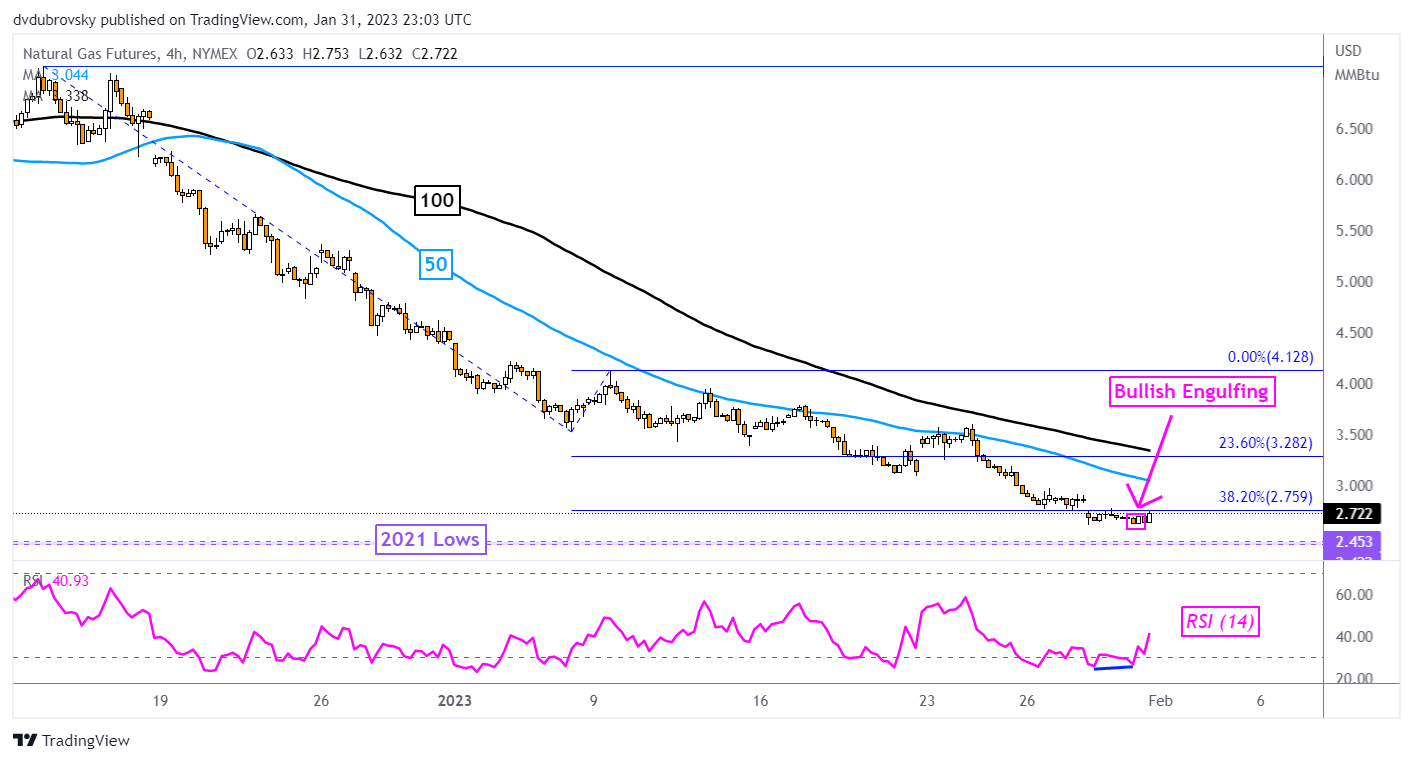
4-Hour Chart – Bullish Engulfing in Focus

Zooming in on the 4-hour chart reveals increasingly emerging reversal cues. Positive RSI divergence is now present, showing that downside momentum is fading. Furthermore, a Bullish Engulfing emerged within the past 24 hours. Prices subsequently pushed slightly higher. Albeit further upside confirmation is likely needed to argue the case for a material directional shift.

Immediate resistance is the 38.2% Fibonacci extension level at 2.759. Natural gas also remains below the 50- and 100-period SMAs in this timeframe. The latter two could maintain the downside focus. If not, prices may push higher toward the current 2023 high at 4.128. Otherwise, extending losses would open the door to facing 2021 lows (2.422 -2.453).

4-Hour Chart – Bullish Engulfing in Focus


Swiss Franc Jumps but Faces Hurdles Ahead. Where to for EUR/CHF and USD/CHF?

Swiss Franc Jumps but Faces Hurdles Ahead. Where to for EUR/CHF and USD/CHF?

EUR/CHF TECHNICAL ANALYSIS

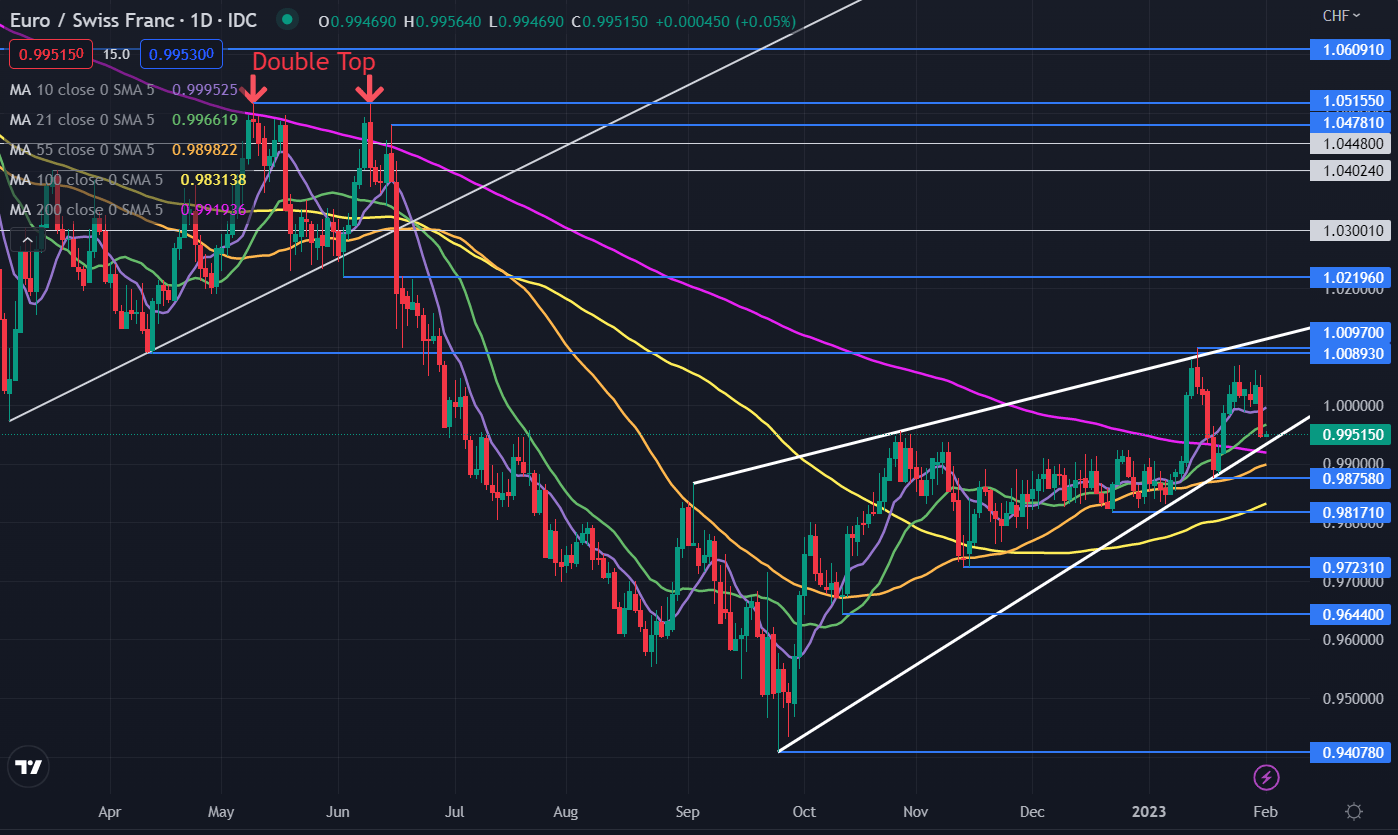
The Swiss Franc saw its largest gain against the Euro since early November on Wednesday after failing to overcome breakpoint resistance last month.

EUR/CHF made a high of 1.0097 in January which was just above a breakpoint resistance level at 1.0089. These levels may continue to offer resistance.

That move also briefly went above an ascending trend line but was unable to sustain the rally. This might signal a false break which could indicate a longer-term reversal.

After making an all-time low at 0.9407, the price action has created a rising wedge formation, also known as an ascending wedge. This can be observed by noting ascending trend lines above and below the price that are converging.

A break below the lower trend line may signal that bearish momentum might unfold.

Prior to EUR/CHF breaking lower yesterday, it was above all short, medium and long-term Simple Moving Averages (SMA).

The move lower beached below the 10- and 21-day SMAs which could signal that short-term bullish momentum has faded.

If EUR/CHF breaks out of the rising wedge on the downside and continues down through the 55-, 100- and 200-day SMAs, this could signal that bearish momentum is evolving.

Support may lie at the previous lows of 0.9876, 0.9817, 0.9723, 0.9644 and 0.9407.

image1.png

USD/CHF TECHNICAL ANALYSIS

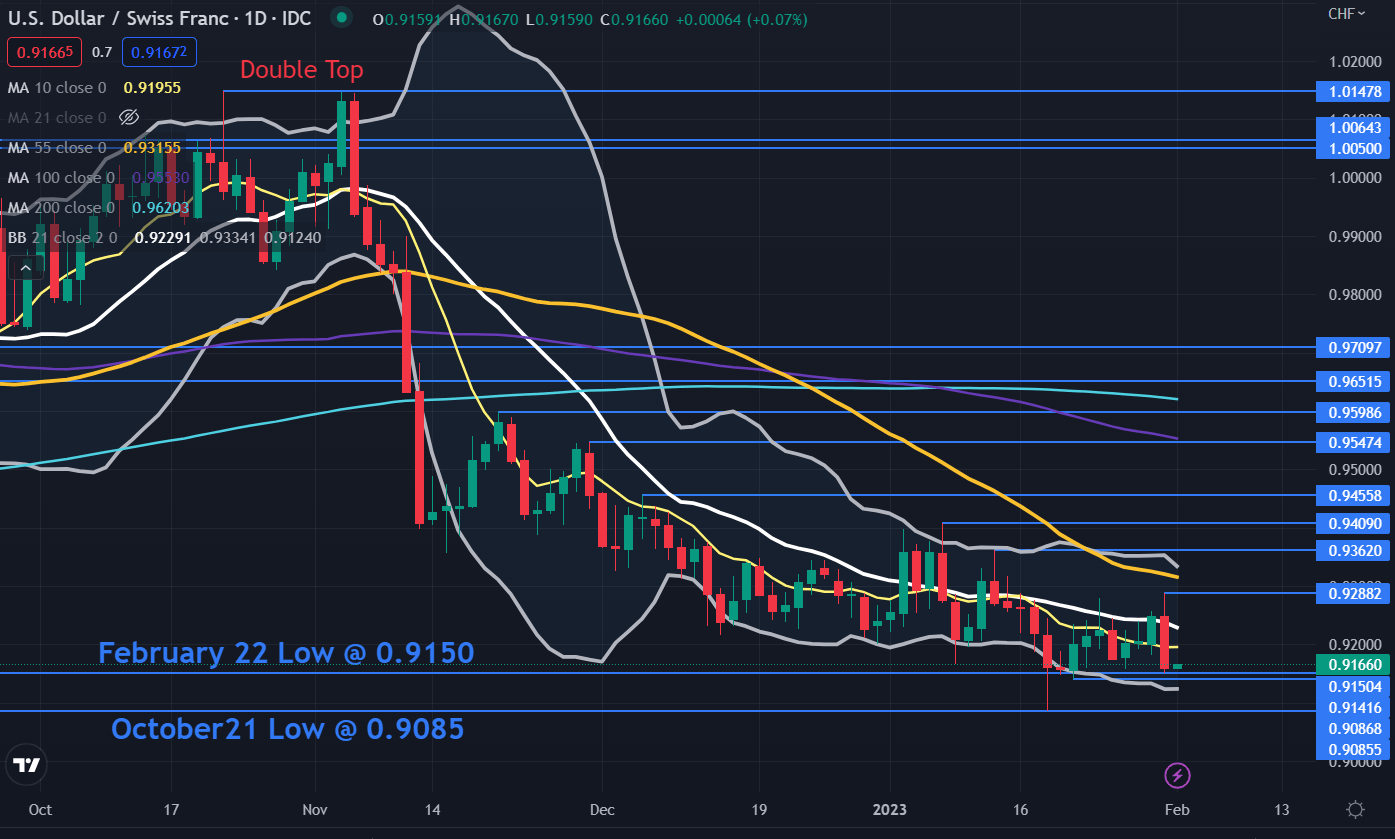
USD/CHF collapsed on Wednesday but paused at the breakpoint support level that was created from the February 2022 low of 0.9150.

It may continue to provide support ahead of the October 2022 low of 0.9087 that was tested and held last month.

USD/CHF has been in a 0.9085 – 0.9409 range for two months with volatility decreasing, as illustrated by the narrowing of the 21-day Simple Moving Average (SMA) based Bollinger Bands.

On the topside, resistance might be offered at the previous highs of 0.9288, 0.9362, 0.9409, 0.9456, 0.9547 and 0.9591.

Although USD/CHF has been range-bound, it is once again below all short, medium and long-term SMAs. It has been in this state several times recently without gaining directional momentum. A breakout of the range might see momentum unfold in that direction.

image2.png


Singapore dollar Technical Outlook: Imminent Pause in USD/SGD’s Slide?

Singapore dollar Technical Outlook: Imminent Pause in USD/SGD’s Slide?

USD/SGD TECHNICAL FORECAST – BEARISH

The Singapore dollar’s rally against the US dollar could slow or even pause as it approaches a major resistance area.

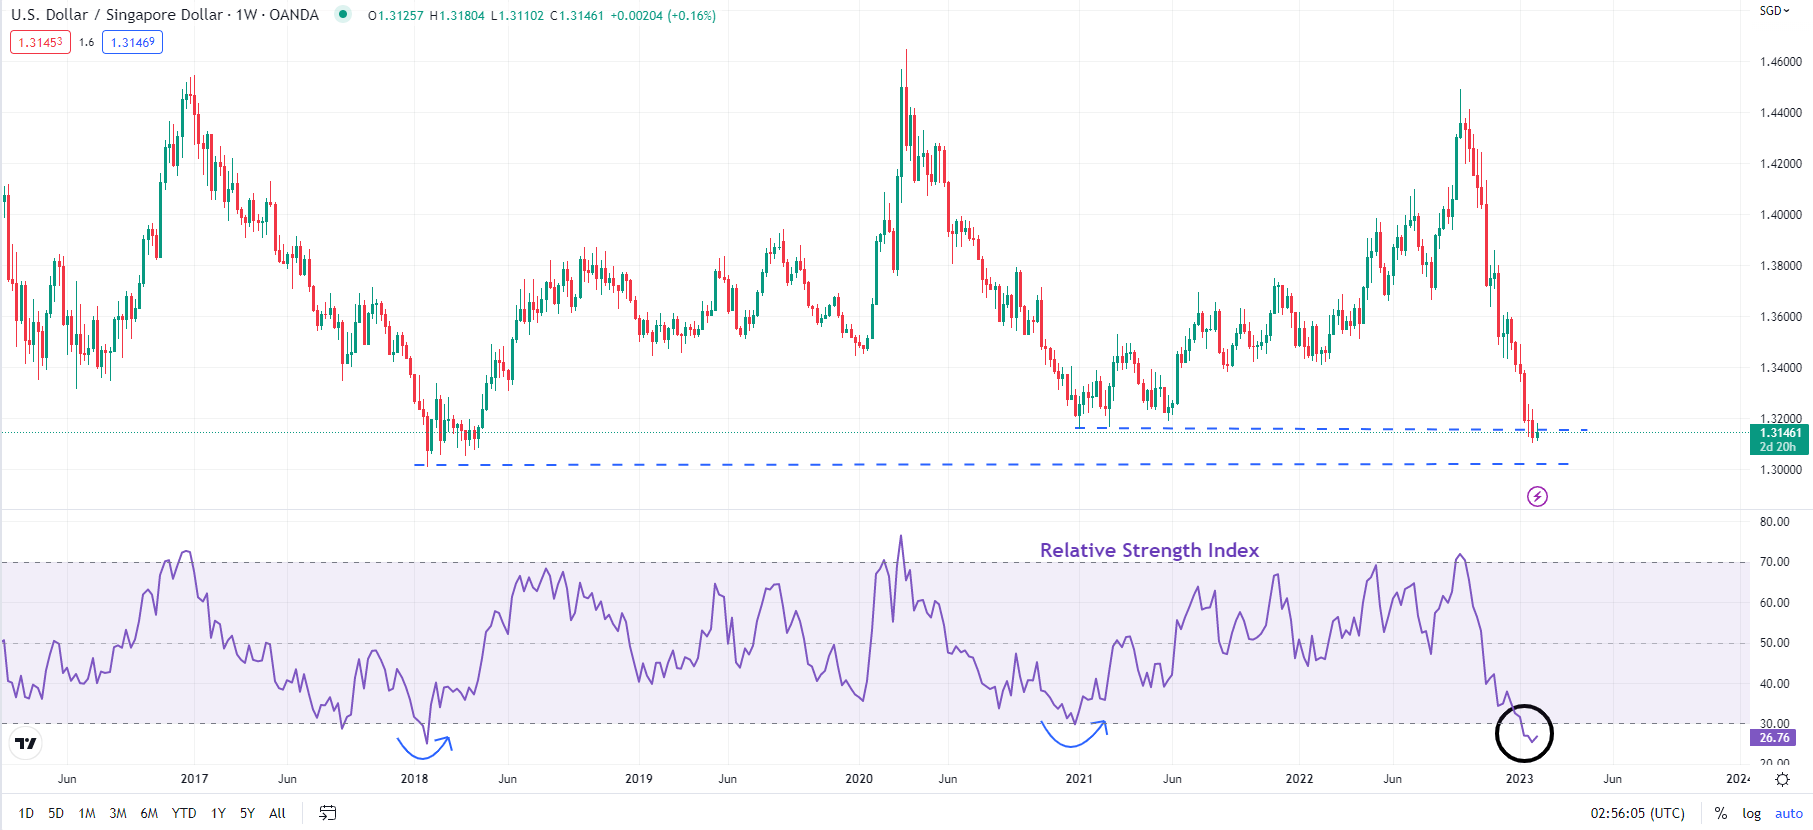
USD/SGD is deeply oversold as it tests key support on the lower edge of the channel is a horizontal trendline from 2015 (at about 1.3150), slightly above the 2018 low of 1.3000. A positive momentum divergence (lower lows in price associated with a stalling in the 14-day Relative Strength Index) suggests that the four-month slide is losing steam given the pair is down close to 10% since it made a 2.5-year high in September.

USD/SGD Weekly Chart

image1.png

Some short-term consolidation/ a minor pause in the USD/SGD’s slide can’t be ruled out, especially given the US Federal Reserve interest rate decision later today. The market widely expects the Fed to hike rates by 25 basis points to 4.5%-4.75%, and the accompanying statement will be closely watched. A ‘hawkish hike’ could lead to a temporary bounce in global USD. The futures market currently expects rates to top around 4.9% on the growing conviction that US inflation could be peaking.

USD/SGD Daily Chart

image2.png

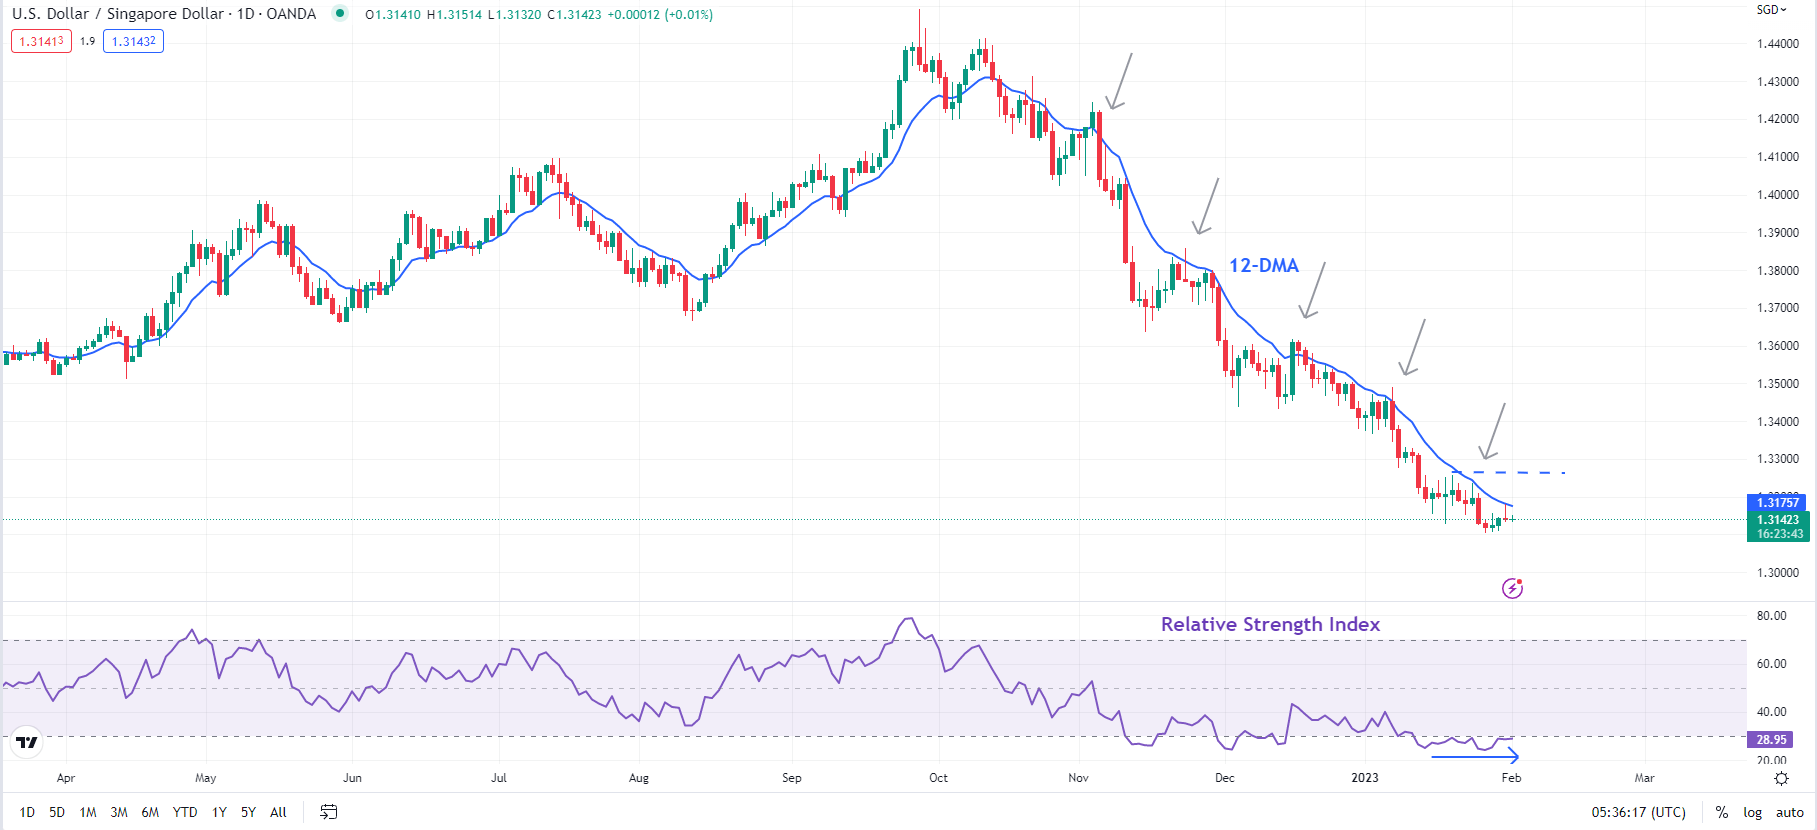
A key signpost to watch would be the immediate ceiling on the 12-day moving average – the pair hasn’t breached the average decisively since the end of 2022 has been capped by the shorter moving average (see daily chart). Subsequent resistance is at the January 19 high of 1.3250. However, beyond any short-term pause, the bias for USD/SGD remains down from a multi-month perspective, ashighlighted in mid-November that the worst could be over for the Singapore dollarand apotential move toward 1.3150 in December. Any break below the converged support at 1.3000-1.3150 would trigger a breakout from the multi-year sideways channel, opening the door toward the 2011 low of 1.1985.

GBP/USD Technical Outlook: Short-term Range Intact

GBP/USD Technical Outlook: Short-term Range Intact

GBP/USD SHORT-TERM TECHNICAL FORECAST – NEUTRAL

GBP/USD’s short-term range prospects haven’t changed as we enter the final countdown to key interest rate decisions, beginning with the US Federal Reserve today, and the Bank of England (BOE) and the European Central Bank (ECB) tomorrow.

The Fed is widely expected to hike rates by 25 basis points to 4.5%-4.75% on Wednesday. The key focus will be the accompanying statement, especially any guidance on the path of interest rates. The ECB and the BOE are widely expected to raise interest rates by 50 bps. A ‘hawkish hike’ by the BOE could support GBP from a medium-term perspective.

Price Facts, Sentiment, Narrative

image1.png

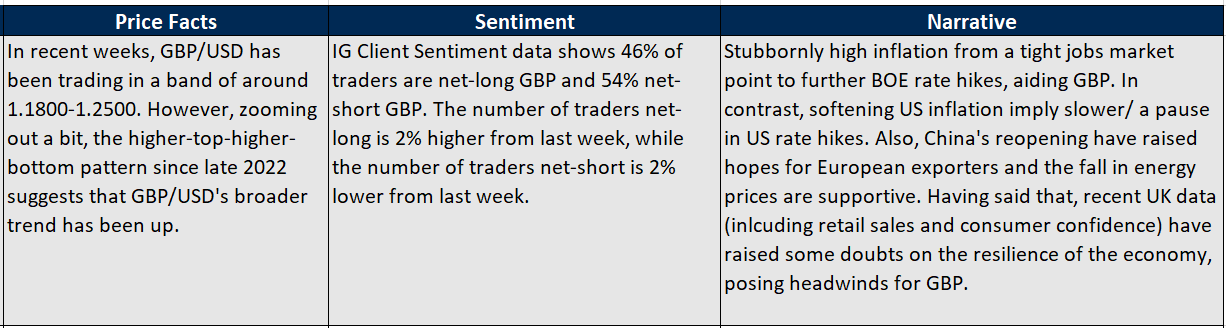
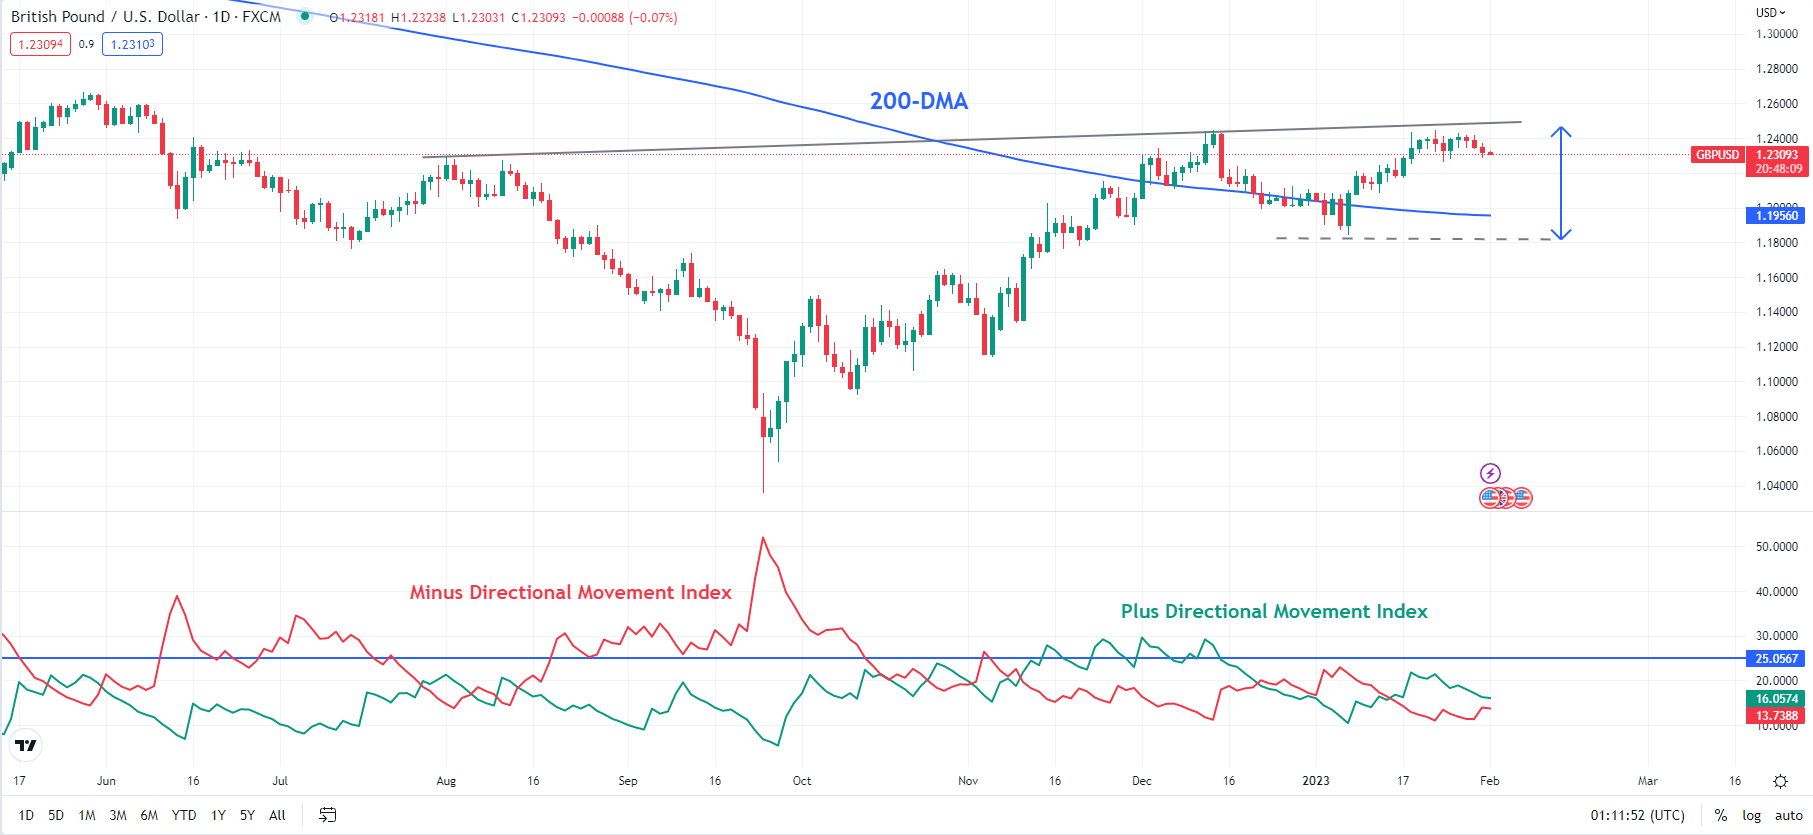
On technical charts, there is a case for medium-term strength in GBP/USD, firsthighlighted in Octoberand subsequentlyin mid-November. The price action in recent months bolsters the chances of a significant upside in the pair. Asthe January 20 update highlighted, a decisive break above key converged resistance: a slightly upward-sloping trendline from August (now at about 1.2490), roughly coinciding with the December high of 1.2445 would trigger a major reverse head & shoulders pattern (the left shoulder at the July low, the head at the September low, and the right shoulder at the January low), pointing to a potential rise toward the 2021 high of 1.4250.

GBP/USD Daily Chart

image2.png

In the immediate term, prospects for GBP/USD haven’t changed much from the previous updates (seeend of November update hereandmid-January here). The pair continues to be in the 1.1840-1.2490 band. As the daily chart shows, Plus Directional Movement Index (DMI) and Minus DMI continue to be below 25, pointing to range conditions in the short term.

GBP/USD 240-Minutes Chart

image3.png

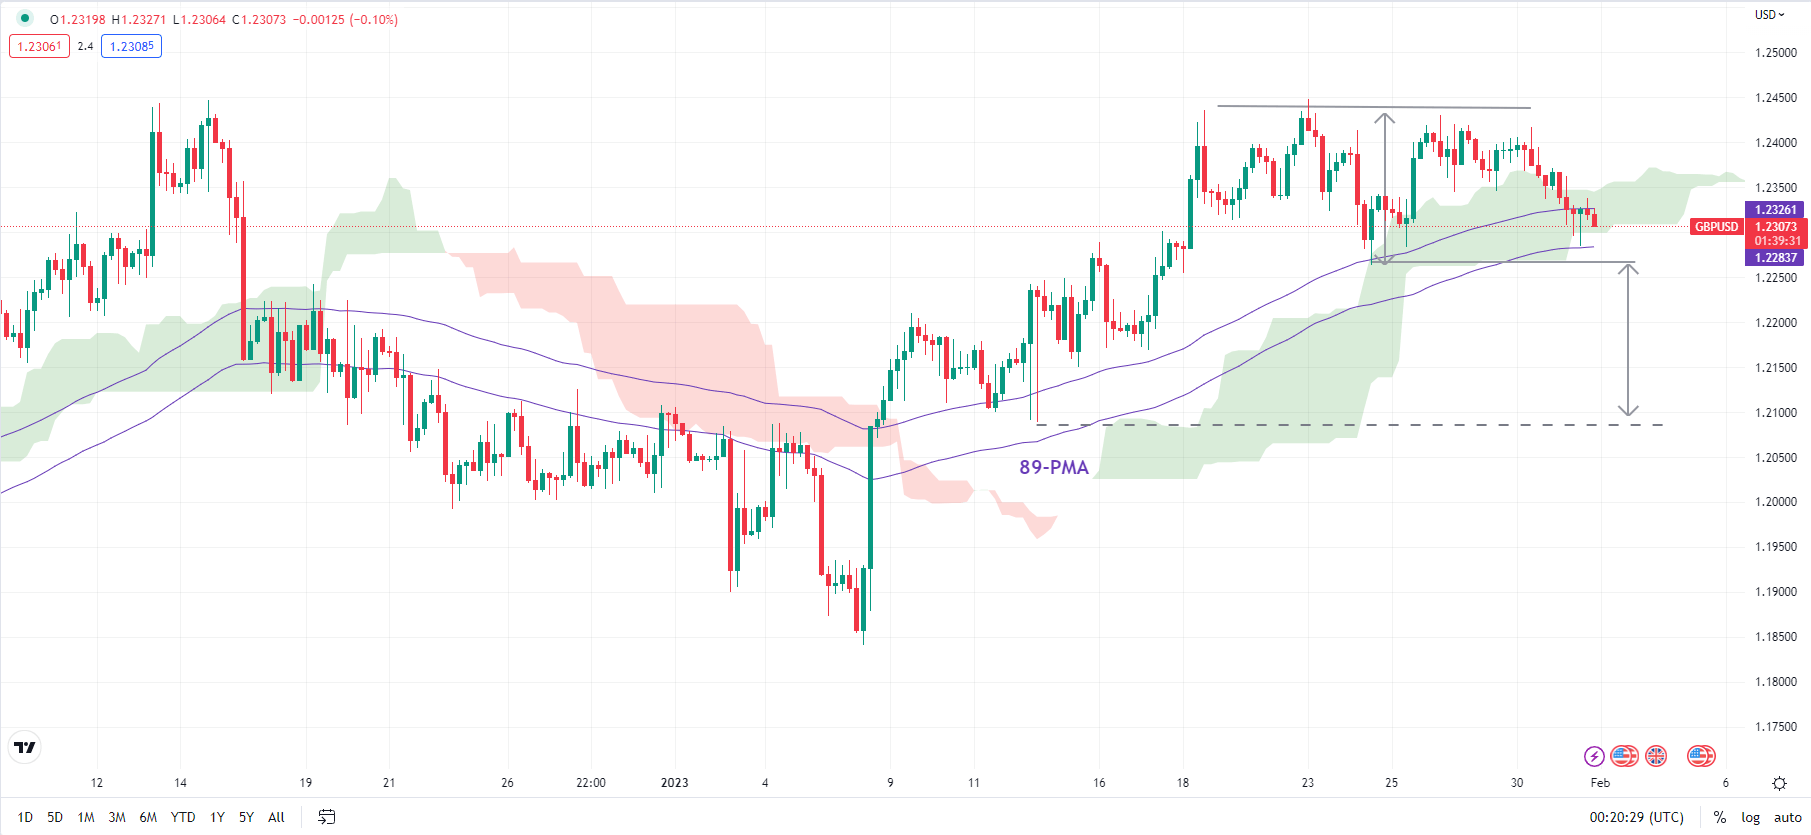
Zooming in on intraday charts, last week’s low of 1.2260 is initial support. Any break below could trigger a minor double top (last week’s highs), raising the odds of a drop toward 1.2100. However, there is quite strong support at the lower end of the range at 1.1840.

Gold Treads Water Ahead of a Cascade of Central Bank Hikes. Where to for XAU/USD?

Gold Treads Water Ahead of a Cascade of Central Bank Hikes. Where to for XAU/USD?

Gold had a look lower at the US$ 1,900 handle in the US session but quickly recovered back above US$ 1,925. At the same time, the DXY Index, a benchmark measure of the US Dollar, moved to higher ground before collapsing into the New York close.

Wall Street had a stellar session on hopes that the Fed Chair Jerome Powell might soften the hawkish stance at today’s Federal Open Market Committee (FOMC) meeting.

Prior to the media blackout, several committee members had been sprouting the message that 25 basis points seemed like the appropriate dosage for tightening and that rates will need to remain high for ‘a long period’.

Interest rate markets have a 25 bp lift baked in. It is the post-meeting commentary that has the potential to set off market moves.

In addition, the European Central Bank (ECB) and the Bank of England (BoE) will be meeting tomorrow, and the market expects both banks to tighten by 50 bp.

Treasury yields slipped a few bps overnight but have done very little through the Asian session today.

The Nasdaq posted a 1.67% gain in its cash session, but futures are indicating a soft start to their day trading.

APAC equities have had a quiet day, although most indices are slightly positive. Likewise, currency markets are lying in wait to see what comes of the Fed meeting, although the Swiss Franc posted solid gains yesterday.

After testing lower levels yesterday, crude oil has held onto the consequent recovery. The WTI futures contract is above US$ 79 bbl while the Brent contract is around US$ 85.80 bbl at the time of going to print.

After the European CPI number, the US will see figures on mortgage applications, employment and the ISM survey. The Fed remains the focus late in the day.

GOLD TECHNICAL ANALYSIS

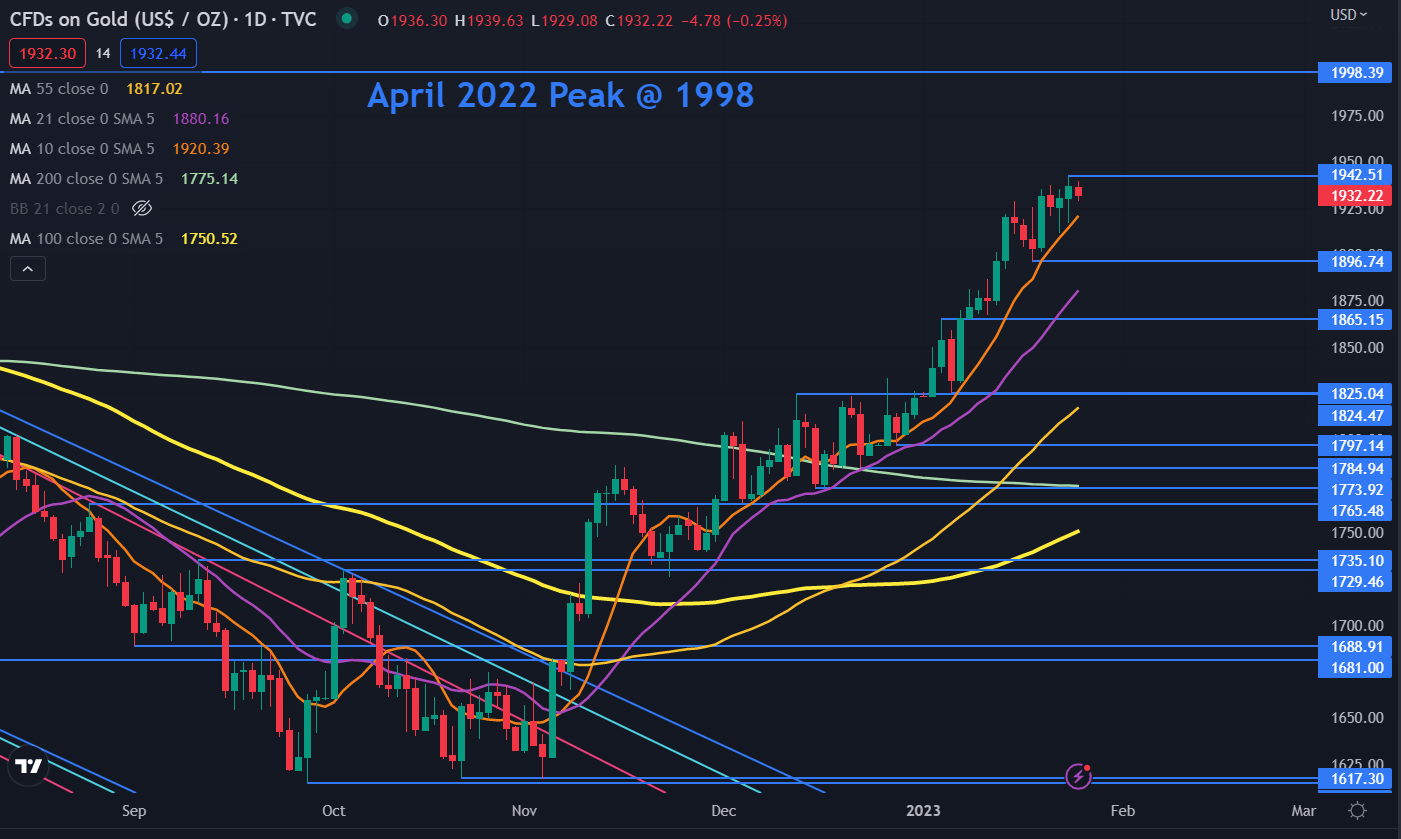
Gold has dipped below the 10-day simple moving averages (SMA), but remains above all other short, medium and long-term daily SMAs.

This may suggest a pause in short-term bullish momentum, but that underlying medium and long-term bullish momentum remains intact for now. The price remains in an ascending trend channel.

Resistance might be at the recent peak of 1949 or the April 2022 high of 1998.

On the downside, support may lie at the lows of 1900 and 1897 or the breakpoints of 1865 and 1825.

image1.png


Australian Dollar Price Action Setups: AUD/USD, AUD/JPY, GBP/AUD, AUD/NZD

Australian Dollar Price Action Setups: AUD/USD, AUD/JPY, GBP/AUD, AUD/NZD

AUD/USD Daily Chart – Rising Wedge Eyed

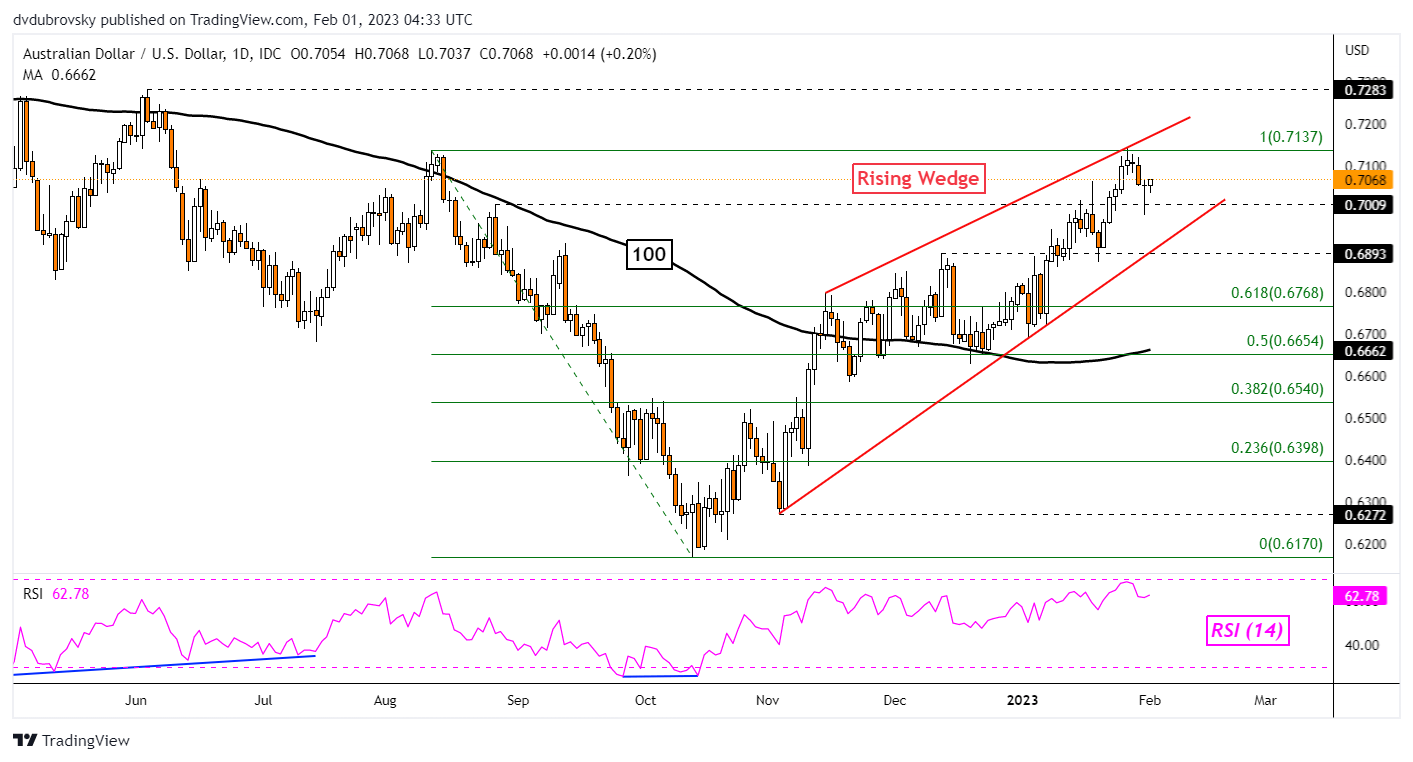
The Australian Dollar remains pointed higher against the US Dollar with prices continuing to trade within a bearish Rising Wedge. Over the past 24 hours, AUD/USD was unable to hold a drop through the 0.7009 inflection point, leaving behind a fairly long lower wick. This is placing the focus on the August 2022 high at 0.7137. A breakout above this price could open the door to uptrend resumption. Otherwise, another attempt to clear 0.7009 places the focus on the rising floor of the wedge.

AUD/USD Daily Chart – Rising Wedge Eyed

AUD/JPY Daily Chart – 100-Day SMA in Focus

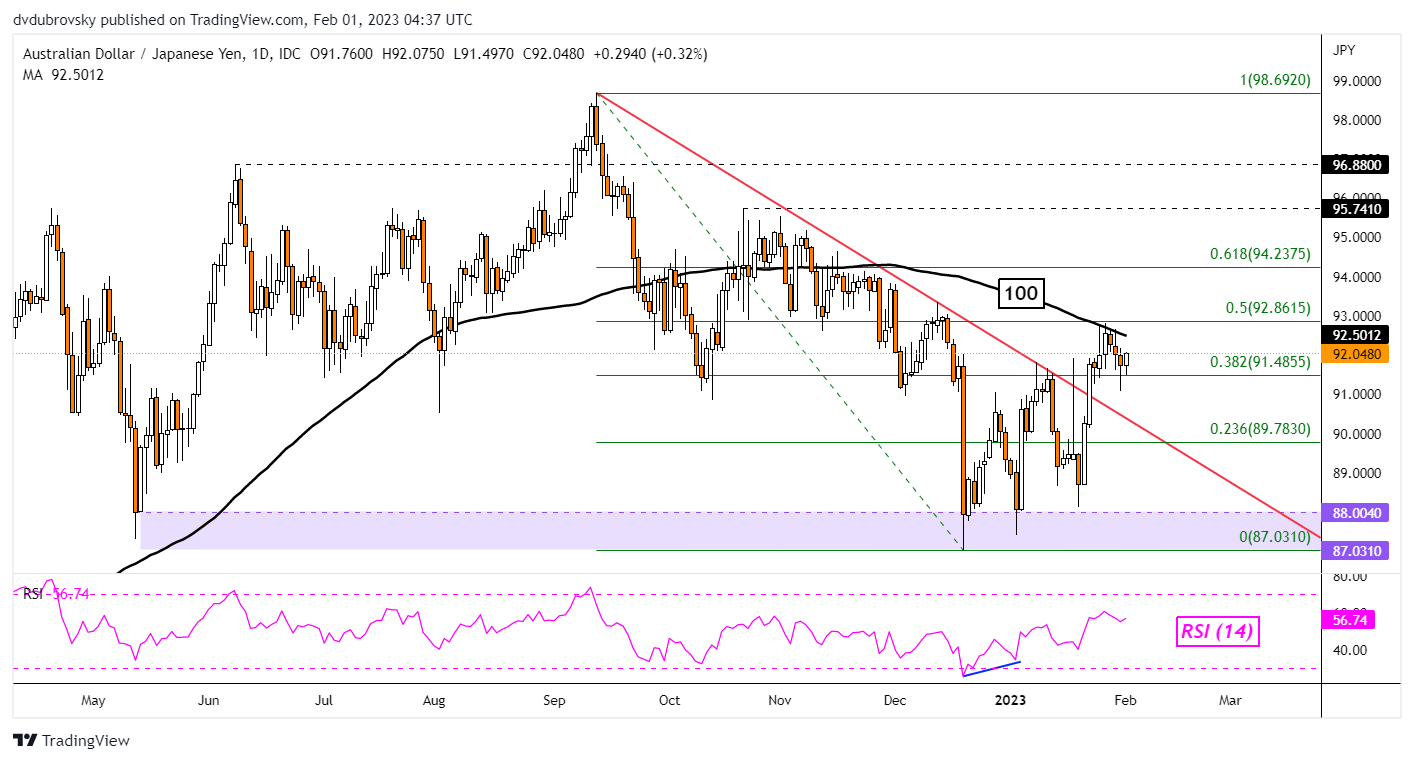
The Australian Dollar has been struggling to hold a bullish breakout against the Japanese Yen. Earlier in January, AUD/JPY confirmed a push above the falling trendline from September. That opened the door to reversing the downtrend seen towards the latter half of 2022. Now, the 100-day Simple Moving Average (SMA) is holding as resistance, maintaining the downside focus. Clearing support, which is the 38.2% Fibonacci retracement level at 91.485, exposes lows from December. Otherwise, climbing above the SMA exposes the October high at 95.741.

AUD/JPY Daily Chart – 100-Day SMA in Focus

GBP/AUD Daily Chart – Head & Shoulders?

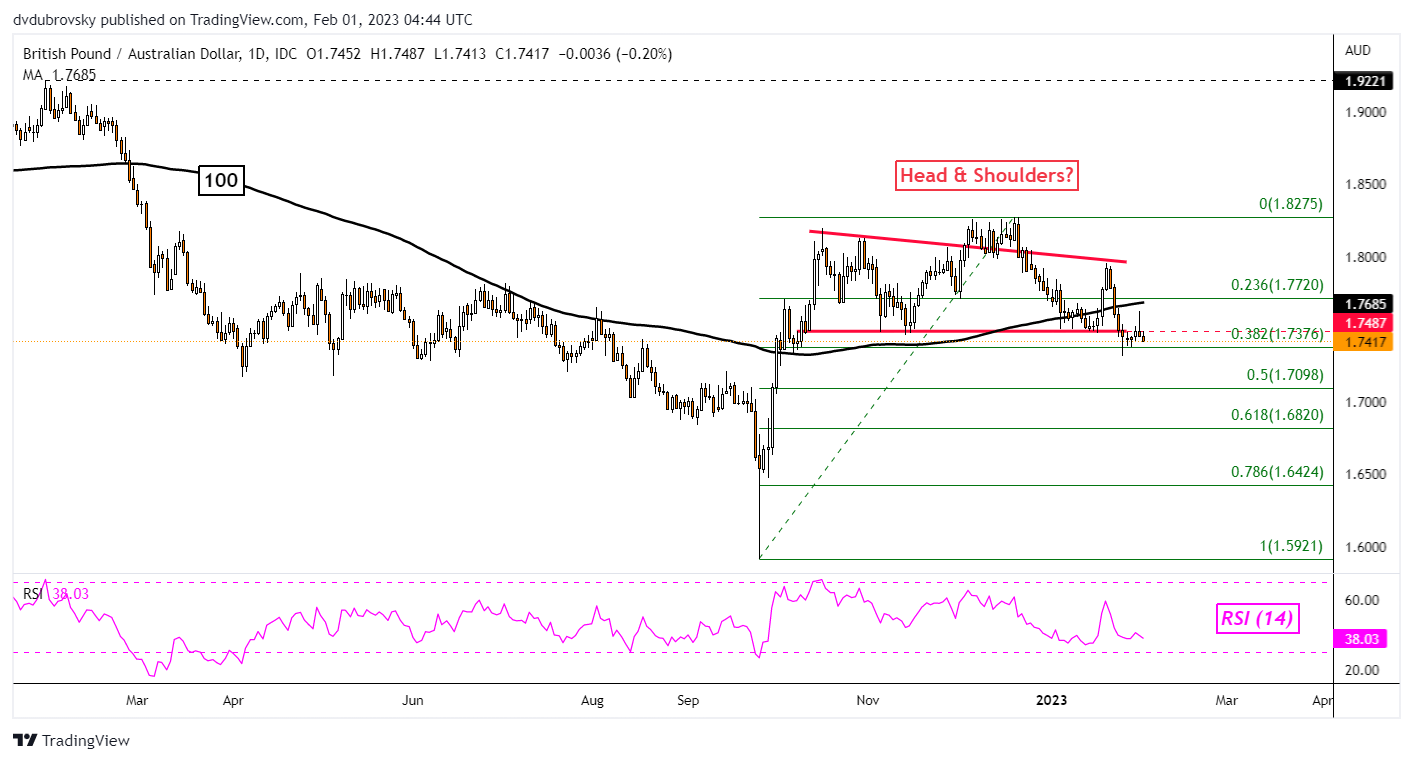
The Australian Dollar appears to be setting the stage for gains against the British Pound. GBP/AUD seems to have been carving out a bearish Head & Shoulders chart formation since September. Prices are attempting to clear the neckline around 1.7487. Confirming a breakout lower could open the door to extending losses toward the 61.8% Fibonacci retracement level at 1.682. Otherwise, the right shoulder of the chart pattern could play out as key resistance around 1.8.

GBP/AUD Daily Chart – Head & Shoulders?

AUD/NZD Daily Chart – Eyes on Rising Edge

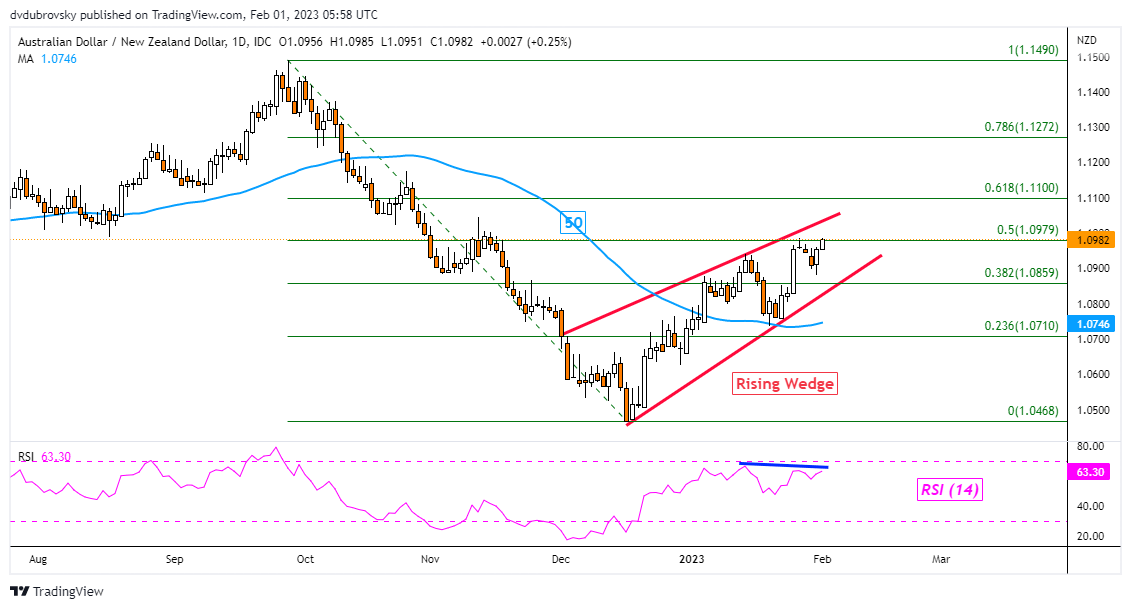
The Australian Dollar may continue trading higher against the New Zealand Dollar. That is because AUD/NZD is trading within the boundaries of a Rising Wedge chart pattern. While the formation itself can carry bearish implications, that comes into play if prices confirm a breakout under the wedge. Such an outcome opens the door to resuming the dominant downtrend from the end of last year. Clearing immediate resistance at 1.0979 exposes the 61.8% Fibonacci retracement level at 1.11.

AUD/NZD Daily Chart – Eyes on Rising Edge

S&P 500 and Dollar Volatility – But Unlikely Trend – Before FOMC Wednesday

S&P 500 and Dollar Volatility – But Unlikely Trend – Before FOMC Wednesday

We are in a vortex of anticipation with plenty of fundamental ‘noise’ to generate interim volatility. The appetites of retail traders who prescribe to only technicals or believe that all event risk has equal potential could lead them into dangerous exposure. Yet, there is a hierarchy of influence when it comes to the markets, and the most prominent event generally commands the greatest potential for market movement. That is particularly true in the lead up to its release as anticipation carries with it a wide range of scenarios and possible levels of impact. We are fully absorbed in the gravity of the FOMC rate decision on Wednesday, and the activity we have seen to start this week is likely a reflection of that outlook.

From the US indices, the charge through this past week managed to earn a significant progress on a technical basis. The Nasdaq 100 finally caught up to its larger counterparts by closing above its 200-day simple moving average (SMA) for the first time in 203 trading sessions. The index dropped back below that supposedly pivotal level Monday. For the S&P 500, the -1.3 percent was a sizable reversal that pulled the market back to the top of the previous resistance band around 4,030-4,020. What is notable to me through is that through January’s choppy (as much as 6.7 percent) advance, participation has all but flatlined. Using e-mini S&P 500 futures and options open interest as a proxy for general speculative interest, a recovery from the slump following the December FOMC decision has been conspicuously absent.

Chart of S&P 500 E-mini Futures with 200-day SMA, Volume, Open Interest and 1-Day ROC (Daily)
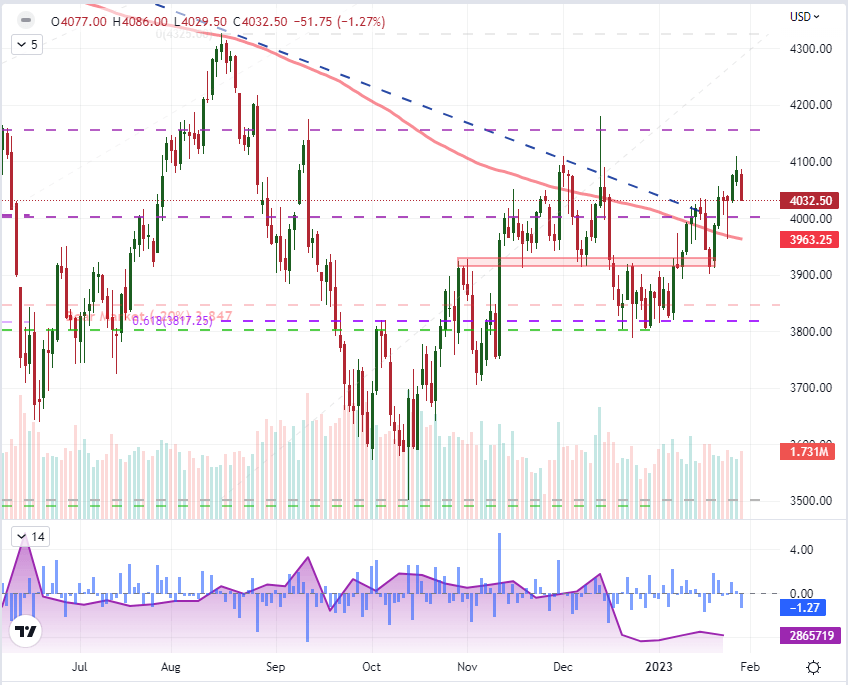
image1.png

The uneven market activity that we are currently facing is a reflection of anticipation, and a brief glance at the economic docket offers up the reason for our distraction. The FOMC rate decision scheduled for 19:00 GMT Wednesday will speak to the global perspective of monetary policy. While the US central bank didn’t hike at the fastest pace amongst its peers, and may not ultimately go as far as some of its peers; it nevertheless is a leader of the current tightening regime as it was the unorthodox stimulus of the previous epoch of monetary policy. Should the authority signal it will continue to tighten to its target ‘terminal rate’ despite softening inflation, the impact will echo through the risk markets. Should they announce an unexpected pause, the impact will be just as broad but even more severe (in this case ‘risk on’). As we close await the Fed’s nod and close out the month of January, there remains significant event risk on tap.

Top Global Macro Economic Event Risk for Next Week
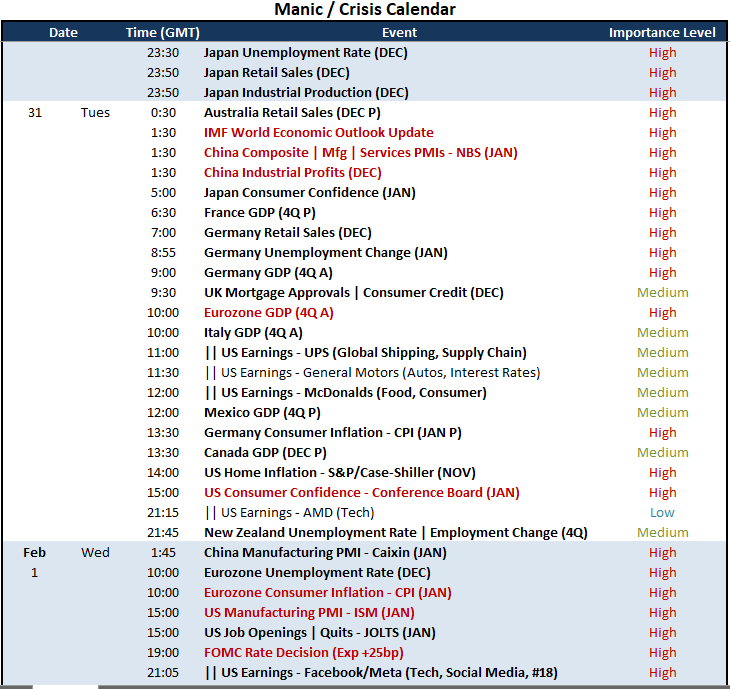
image2.png

Much of the focus through this coming session is notably on growth-oriented metrics. The first listing is a global one in the update to the IMF’s World Economic Outlook (WEO). In the past month, IMF Director Georgieva has signaled that the forecast has improved for the global economy; which seems to align to the market’s discount of late. Should that enthusiasm not show through, it is likely to weigh the markets mood – though this historically is not an update that can be relied upon to generate serious volatility. It nevertheless shapes interpretation of subsequent data and events on this same theme. The other Asia session growth update will come from China with the NBS PMIs and industrial profits expected for release. In Europe, there will be a run of advanced 4Q GDP readings from key Euro-area economies; but the Eurozone measure will project the greatest weight. In the North American session, Mexico and Canada will issue GDP readings of their own, but the US docket’s consumer confidence survey from the Conference Board will feed into the amalgam of the US fundamental picture that we will shape this week.

Global Growth Forecasts According to the IMF
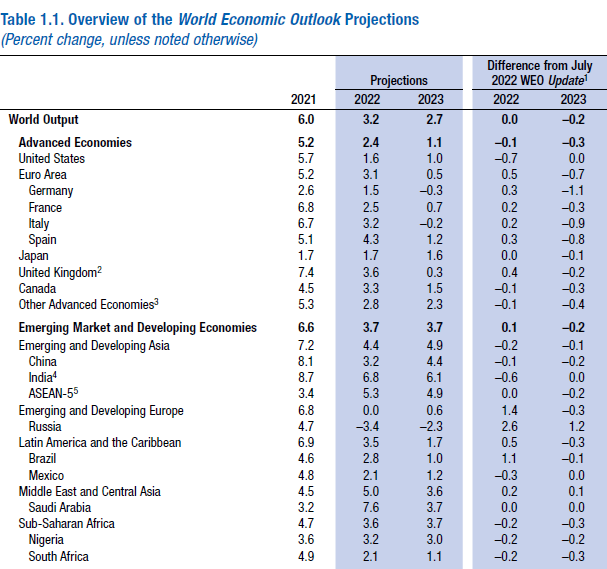
image3.png

Table from the IMF’s October 2022 World Economic Outlook

Considering the anticipation from the broader markets this week as we trade one event for another in sequential days, it is important to distinguish that the US will face a particularly overwhelming run of distractions this week. Before the FOMC decision, we have the ISM manufacturing survey and previously mentioned consumer confidence report; while after the announcement we will run through FAANG earnings, NFPs and the ISM’s service sector activity report. If you are monitoring the DXY Dollar Index for a serious break, there is likely to be a technical break from the vary tight trend channel the currency has carved these past two weeks. However, with a tentative drift higher this past session, the move won’t even broaden the extremely narrow 1.37 percent range over the past 11 trading sessions. While this is looking to the index itself, expect the same kind of struggle for the lies of EURUSD, GBPUSD and USDJPY. Further, the complications for EURUSD and GBPUSD are even greater given the ECB and BOE rate decisions on Thursday.

Chart of DXY Dollar Index with 200-Day SMA, 11-Day Historical Range (Daily)
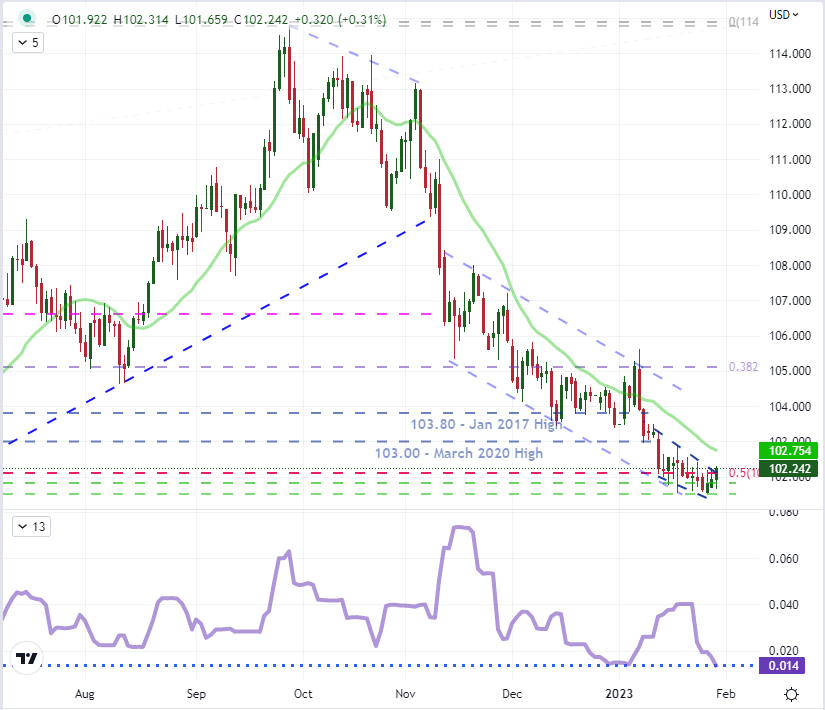
image4.png


Australian Dollar Skips a Beat on Chinese PMI and Domestic Data. Where to for AUD/USD?

Australian Dollar Skips a Beat on Chinese PMI and Domestic Data. Where to for AUD/USD?

The Australian Dollar recalibrated after Chinese PMI showed signs of an economic recovery which followed domestic data that revealed an easing of conditions.

Chinese manufacturing PMI for January printed in line with expectations at 50.1 and the non-manufacturing read came in at 54.4, way above the 52.0 forecast. This combined to give a composite PMI read of 52.9 against 42.6 previously, a massive boost in sentiment.

The China PMI indices are the result of a survey of 3,000 manufacturers across China, mostly large firms. It is a diffusion index, a reading over 50 is viewed as expansionary for the economic outlook of the world’s second-largest economy.

Today’s data encompasses the easing of Covid-19 restrictions seen in December and appears to illustrate the immediate benefits of the re-opening. China’s CSI 300 equity index is up over 12% since the December low and 22% from the October low.

An hour before the Chinese PMI, Australian month-on-month retail sales fell by -3.9% for December, notably below the -0.2% expected and a prior number of positive 1.4%.

Additionally, Australian private sector credit for December showed growth of 0.3% month-on-month, below the 0.5% forecast. This contributed to an annual read of 8.3% year-on-year which was less than 8.9% previously.

This comes on top of a hot headline CPI of 7.8% last week, beating estimates of 7.6% year-on-year to the end of December and against 7.3% previously. The RBA has a mandated CPI target band of 2-3% over the cycle.

This might be good news for the RBA that meets Tuesday next week to decide on the cash rate target. The futures market is leaning toward a 25 basis point hike.

The bank has previously stated that they expect CPI to get to 8% later this year and a slowing of economic conditions could help avoid a re-acceleration of price pressures.

If CPI sails past their 8% estimate earlier than they expect, it could lead to further tighter monetary conditions.

AUD/USD SHORT TERM CHART OVER THE DATA RELEASES