Pound To Australian Dollar Rate Rangebound Amid Downbeat UK Economic View

Pound To Australian Dollar Rate Rangebound Amid Downbeat UK Economic View

The Pound Australian Dollar (GBP/AUD) exchange rate fluctuated as Bank of England (BoE) Governor Andrew Bailey appeared cautious in his speech, highlighting persistent inflationary pressures and concerns over economic growth.

At time of writing GBP/AUD traded around $1.2466, moderately unchanged from the morning’s opening levels.

Pound (GBP) Exchange Rates Undermined by Dovish BoE

The Pound (GBP) struggled to find much demand in the Wednesday session as a speech from BoE Governor Andrew Bailey failed to inspire much confidence in GBP investors.

Speaking at the annual conference for the British Chambers of Commerce, Bailey spoke about the persistent inflationary pressures weighing on the UK economy and warned of the potential delayed impact of high interest rates to the economy. Bailey also admitted that the UK’s labour market is finally showing substantial signs of cooling.

In the wake of less-than-stellar employment data on Tuesday, hints of a pause from the BoE are weighing on the Pound. Bailey added:

‘We have good reasons to expect inflation to fall sharply over the coming months, beginning with the April number. As headline inflation falls, second-round effects are unlikely to go away as quickly as they appeared.‘The easing of labour market tightness is happening at a slower pace than we expected in February and the labour market remains very tight.’

Despite this, Bailey also pointed out that inflation remains far too high, over five times the target rate of 2%. Ending his speech, Bailey reiterated the central bank’s commitment to rein in inflation, saying:

‘Inflation is much too high, and we need to bring it back sustainably to our 2% target.‘After the initial recovery in 2020, the level of economic activity, measured by monthly GDP, has failed to grow beyond its pre-pandemic level on a sustained basis.’

Australian Dollar (AUD) Exchange Rates Supported by Cautious Market Optimism

Meanwhile the Australian Dollar (AUD) shrugged off worrisome labour market data and found some modest support with optimism surrounding the US debt ceiling debate. Negotiations between President Joe Biden and House of Representatives Speaker Kevin McCarthy appeared to have edged closer to completion.

McCarthy left the meeting late Tuesday and told reporters that a solution is close, and one could be reached by the end of the week but there is still work to do. With mounting fears that if the US was to default on their debts, a financial catastrophe could sweep through the economy. Treasury Secretary Janet Yellen said on Tuesday that the danger was real:

‘It is very conceivable that we’d see a number of financial markets break – with worldwide panic triggering margin calls, runs and fire sales.’

However, with an amicable solution nearing, the global markets could sigh a breath of relief, buoying the risk-sensitive ‘Aussie’.

GBP/AUD Exchange Rate Forecast: Market Sentiment to Buoy the Aussie?

Looking ahead, the Pound Australian Dollar exchange rate could be left to market sentiment amid a lack of economic data to end the week. Without data for either pairing, the wider market mood will be play a bigger part in movements.

Reduced rate hike bets for the Pound could sap demand as investors continue to digest the speech from Bailey, as well as the wavering state of the UK economy.

EUR/USD retreats towards 1.0800 amid cautious optimism

EUR/USD retreats towards 1.0800 amid cautious optimism

EUR/USD is trading on the back, heading toward 1.0800 in the European session. The US Dollar is holding previous gains amid a cautiously optimistic market mood. Investors weigh US debt ceiling developments ahead of US data.

The EUR/USD pair remains depressed for the third successive day on Thursday and languishes near its lowest level since early April touched the previous day. The US Dollar (USD) stands tall near a two-month high and is seen as a key factor weighing on the major. The recent hawkish remarks by several Federal Reserve (Fed) officials pushed back against market expectations for interest rate cuts later this year. This, along with the latest optimism that the US debt ceiling will be raised, remains supportive of elevated US Treasury bond yields and continues to underpin the buck.

In fact, US President Joe Biden and top congressional Republican Kevin McCarthy underscored their determination to strike a deal soon to raise the government’s $31.4 trillion debt ceiling. This helps calm fears of an unprecedented American debt default and boosts investors’ confidence, which is evident from a generally positive tone around the equity markets. This, in turn, holds back traders from placing aggressive bullish bets around the safe-haven Greenback. Apart from this, bets for more rate hikes by the European Central Bank (ECB) could help limit losses for the EUR/USD pair.

In fact, ECB President Christine Lagarde has already made it clear that efforts to curb stubbornly high inflation aren’t over and said that there are factors that can induce significant upside risk to the inflation outlook. This reinforces the view that there are more interest rate increases still to come and warrants some caution before positioning for any further depreciating move for the EUR/USD pair. Market participants now look to the US economic docket, featuring the release of the usual Weekly Initial Jobless Claims, the Philly Fed Manufacturing Index and the Philly Fed Manufacturing Index.

Traders will further take cues from speeches by influential FOMC members, which, along with the US bond yields, will drive the USD demand and provide some impetus to the EUR/USD pair. Apart from this, developments surrounding the US debt-limit negotiations and the broader risk sentiment should contribute to producing short-term trading opportunities around the major.

From a technical perspective, the EUR/USD pair, so far, has managed to hold its neck above the 100-day Simple Moving Average (SMA), currently pegged around the 1.0800 round-figure mark. A sustained break below will be seen as a fresh trigger for bearish traders and pave the way for an extension of the recent pullback from a one-year peak. Spot prices might then accelerate the fall towards the 1.0755-1.0750 support before eventually dropping to the 1.0700 round figure. The downward trajectory could get extended further towards the 1.0600 mark, with some intermediate support near the 1.0640-1.0635 region.

On the flip side, any attempted recovery back above mid-1.0800s might now confront some resistance near the 1.0875-1.0880 region ahead of the 1.0900 mark. The latter coincides with the weekly high, above which a fresh bout of a short-covering has the potential to lift the EUR/USD pair towards the 1.0960 horizontal support breakpoint. Some follow-through buying will suggest that the recent downfall has run its course and shift the bias back in favour of bullish traders, paving the way for a move beyond the 1.1000

Gold Prices Fall Amidst US Debt Ceiling Deal Bets, Technical Setup Shaky

Gold Prices Fall Amidst US Debt Ceiling Deal Bets, Technical Setup Shaky

Gold prices weakened on Thursday, extending a recent string of losses for the yellow metal. This week is shaping up to be a 1.45% decline for XAU/USD. If confirmed, this would be the worst 5-day period since the end of February. Let us take a closer look at what is going on and what we could expect going forward.

Gold is an anti-fiat trading unit. Its top has been associated almost perfectly with a bottom in the 2-year Treasury yield. The latter has rallied almost 10% since finding support earlier this month. Meanwhile, the US Dollar has also been rallying for the past few weeks.

Long story short, recent economic updates from the US have been pouring cold water on near-term Fed rate cut bets. Over the past 24 hours, financial markets seemed to enjoy prospects that a breakthrough could be in store for a bipartisan maneuver in Washington to raise the US debt ceiling, avoiding default.

With that in mind, if the rosy sentiment persists for financial markets, gold could be left vulnerable over the remaining 24 hours. All eyes will then turn to Thursday’s US initial jobless claims report. This is some of the timeliest data there is on the status of the US labor market amidst rising interest rates.

XAU/USD Daily Chart

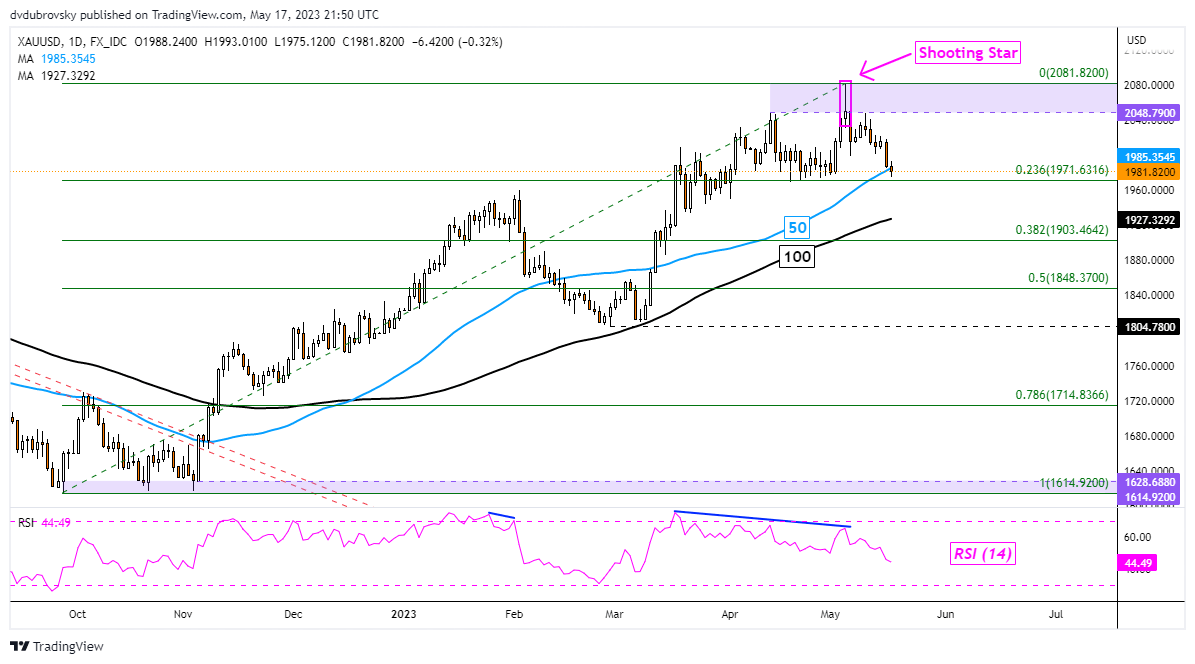
Gold continues to make downside progress in the aftermath of a Shooting Star candlestick chart pattern. The anti-fiat yellow metal has just barely closed under the 50-day Simple Moving Average (SMA). Further downside confirmation could spell trouble, exposing the 100-day equivalent.

XAU/USD Daily Chart

Gold Sentiment Analysis – Bearish

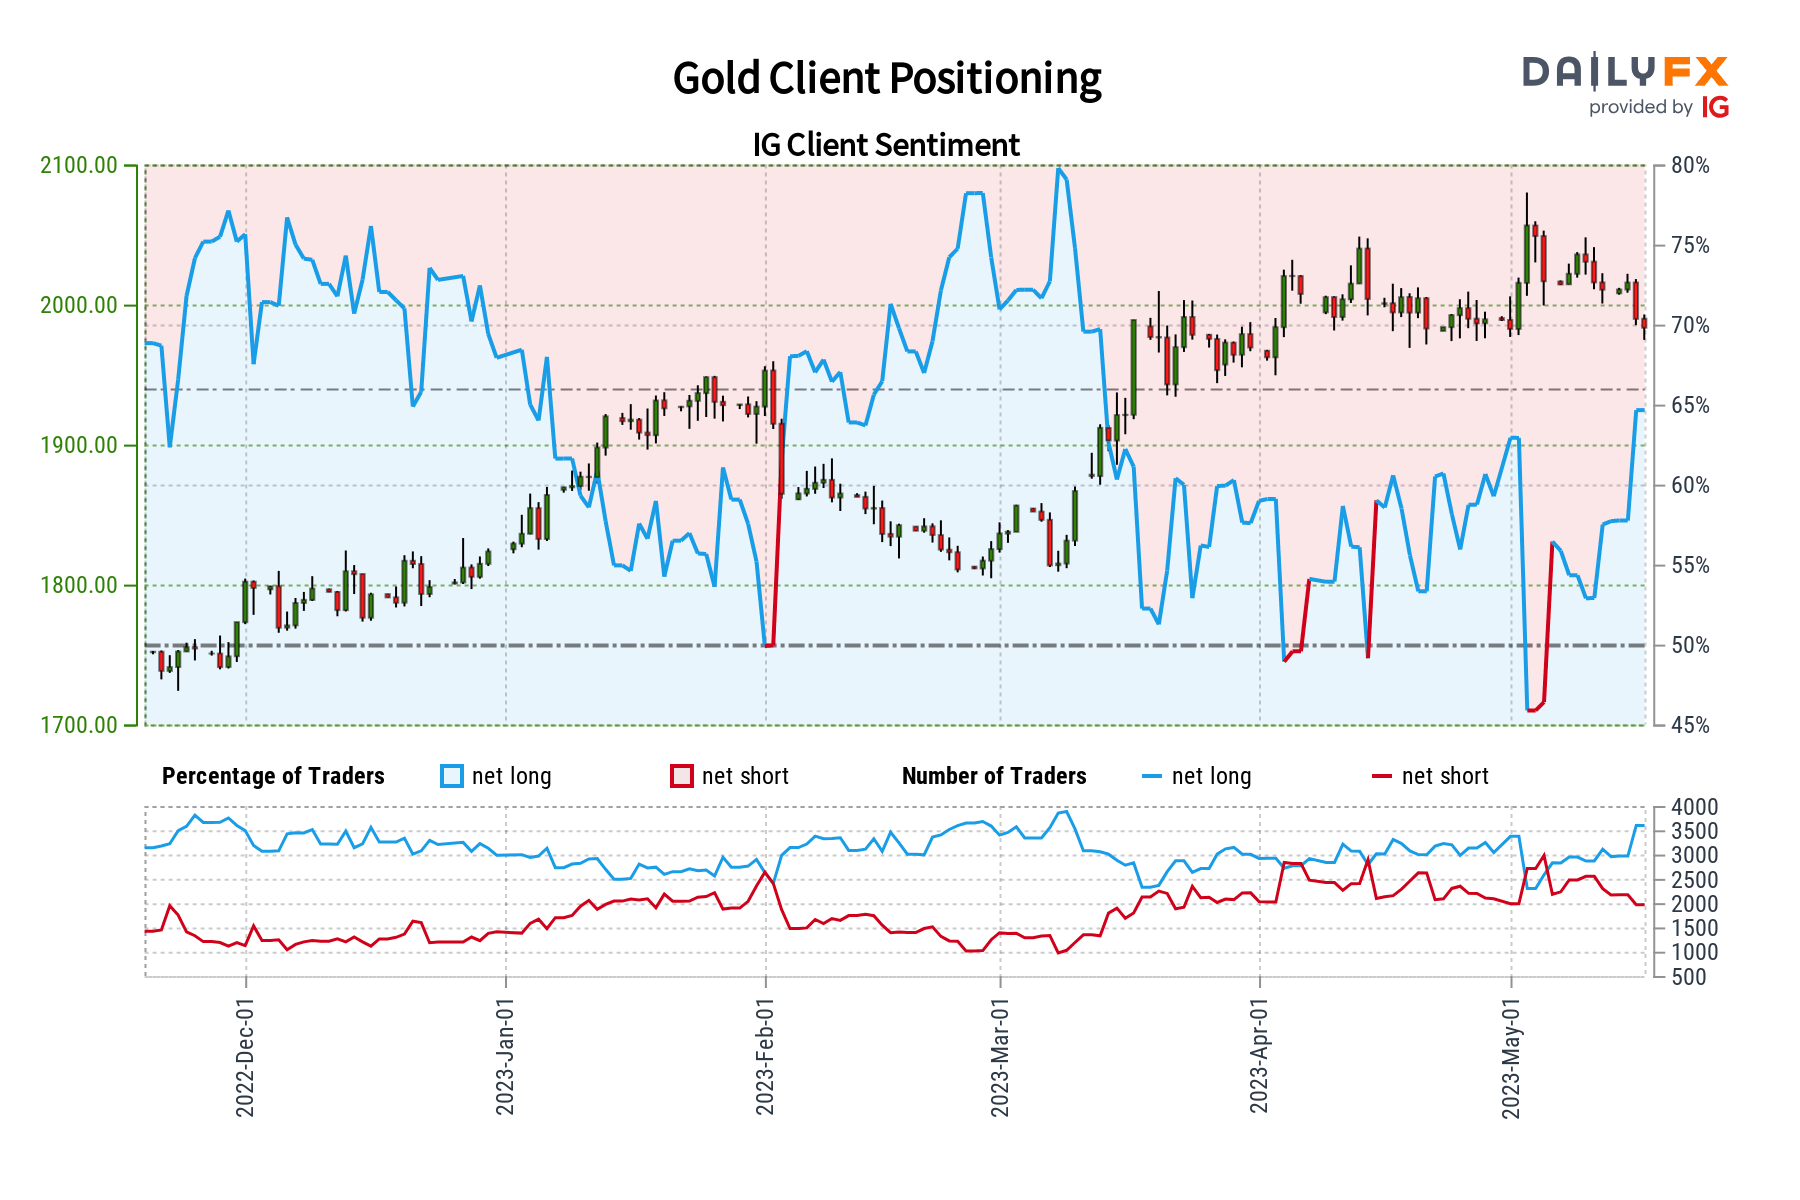
According to IG Client Sentiment (IGCS), about 64% of retail traders are net-long gold. IGCS tends to function as a contrarian indicator. With that in mind, since most traders are net-long this hints prices may continue falling. This is as upside exposure increased by 10.93% and 23.31% compared to yesterday and last week, respectively. With that in mind, recent changes in exposure offer a stronger bearish contrarian trading bias.

Gold Sentiment Analysis - Bearish

Australian Dollar Drops on Jobs Data That May Assist the RBA. Where to for AUD/USD?

Australian Dollar Drops on Jobs Data That May Assist the RBA. Where to for AUD/USD?

The Australian Dollar dipped after a soft jobs report that saw a bump up in the unemployment rate that could help to alleviate price pressures which might see the RBA refrain from hiking in June.

The unemployment rate was 3.7% in April against the 3.5% anticipated and prior. -4.3k Australian jobs were lost in the month, which was notably below the 25k anticipated to be added and 53.0k previously. Of note was the full-time job losses of -27.1k.

The interest rate market is now pricing in a less than 50-50 chance of a lift in the cash rate by the RBA in the third quarter.

An increase in the unemployment rate would not normally be a cause for celebration but in the current environment of red-hot CPI at 7.0%, it has provided a sigh of relief in some quarters.

Yesterday saw the wage price index rise by 0.84% quarter-on-quarter for the first 3 months of this year against 0.85% prior. This gives a year-on-year figure of a 3.7% increase.

Across the public and private sectors, negotiations are currently underway for wage increases to keep up with inflation. The Australian economy is seeing a price-wage inflation spiral rather than a wage-price spiral which was the case in the 1970s and 80s.

If salaries are to increase in line with CPI, then inflation might be seen as being entrenched and/or embedded. That is not what central bankers like to see.

If price expectations are such that consumers expect items to be more expensive in the future, then generally speaking, they are prepared to pay more for them today. Monetary policy plays a significant role in hosing down these perceptions.

So, while today’s jobs report might give the impression of an easing of the tight labour market, the RBA still has its work cut out. At their last meeting, they cited the risk of CPI reaccelerating to keep the gauge out of the 2-3% mandated target band.

AUD/USD dipped to 0.6630 immediately after the data but recovered some ground in the aftermath. The overnight low was 0.6629.

The ASX 200 saw similar price action and remains in the green on the day at the time of going to print.

AUD/USD PRICE REACTION TO JOBS DATA

image1.png

200 Day Moving Average: What it is and How it Works

200 Day Moving Average: What it is and How it Works

What is a 200 Day Moving Average

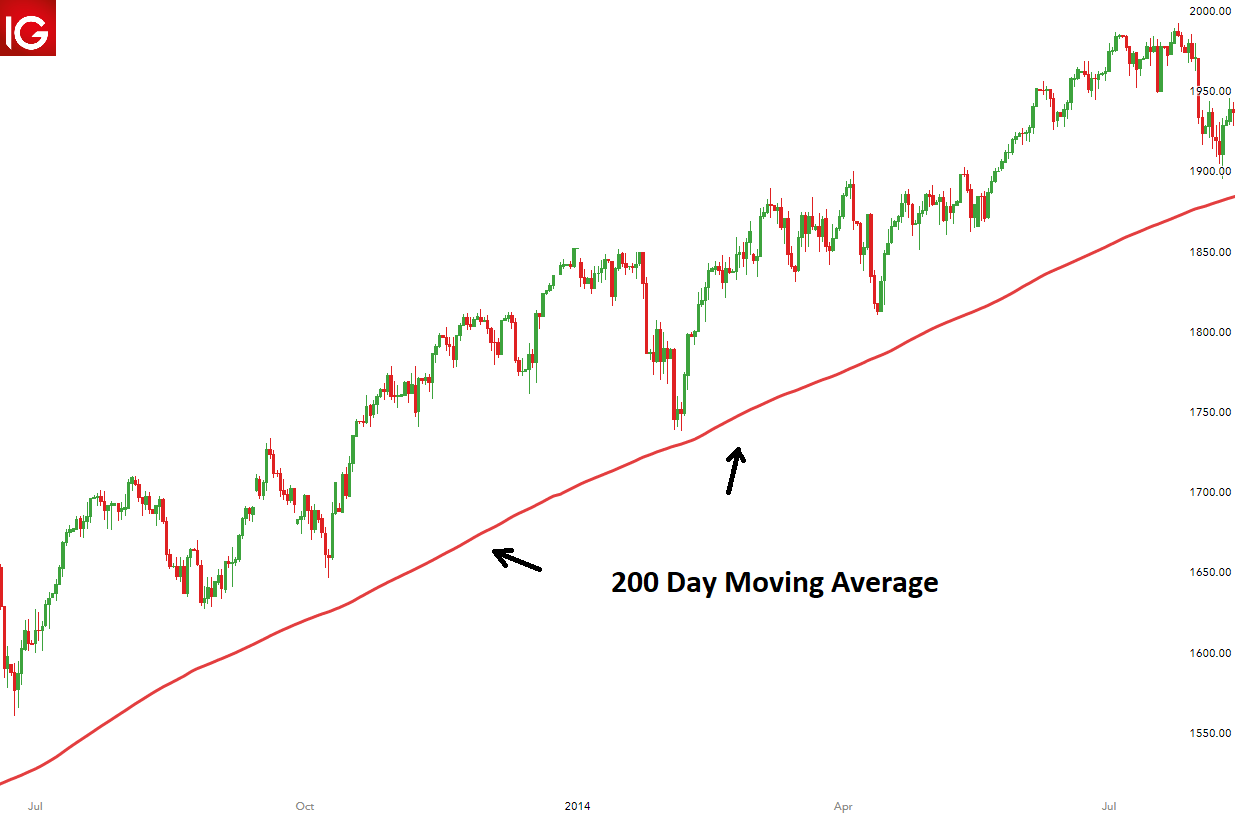
The 200 day moving average is a technical indicator used to analyze and identify long term trends. Essentially, it is a line that represents the average closing price for the last 200 days and can be applied to any security.

200 day moving average chart for the S&P 500

The 20 day moving average is widely used by forex traders because it is seen as a good indicator of the long term trend in the forex market. If price is consistently trading above the 200 day moving average, this can be viewed as an upward trending market. Markets consistently trading below the 200 day moving average are seen to be in a downtrend.

How Do You Calculate the 200 Day Moving Average?

The 200 day moving average can be calculated by adding up the closing prices for each of the last 200 days and then dividing by 200.

200 Day Moving Average Formula = [(Day 1 + Day 2 …. + Day 200)/200]

Each new day creates a new data point. Connecting all the data points for each day will result in a continuous line which can be observed on the charts.

How Do You Use the 200 Moving Average in Your Trading Strategy?

The 200 day moving average has gained in popularity as it can be used in many different ways to assist traders.

Using the 200 Day MA as Support and Resistance

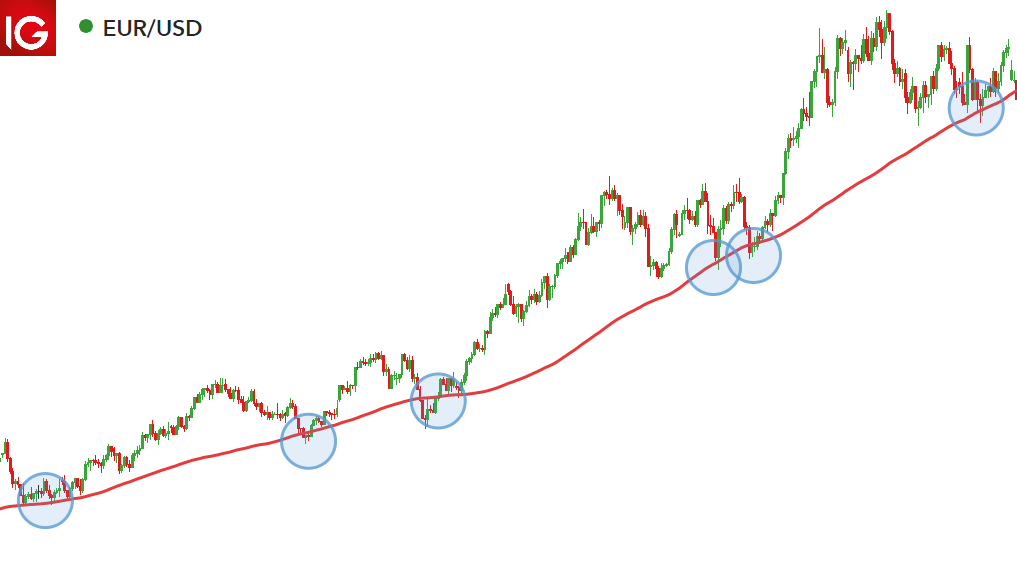
The 200 day moving average can be used to identify key levels in the FX market that have been respected before. Often in the forex market, price will approach and bounce off the 200 day moving average and continue in the direction of the existing trend. Therefore, the 200 day moving average can be viewed as dynamic support or resistance.

Below is an example of how price approached and bounced off the 200 day moving average on the EUR/USD chart:

200 day moving average chart EUR/USD

Traders will look to go long as price bounces off the 200 day moving average when the market is in an upward trend. Likewise, traders will look for short entries after price bounces from the 200 day moving average in a down trending market. Stops can be placed below (above) the 200 moving average in an uptrend (down trend).

MA Crossovers

Once the long-term trend is identified, traders often assess the strength of the trend. This is important because a weakening trend could signal a trend reversal and presents the ideal time to exit an existing trade.

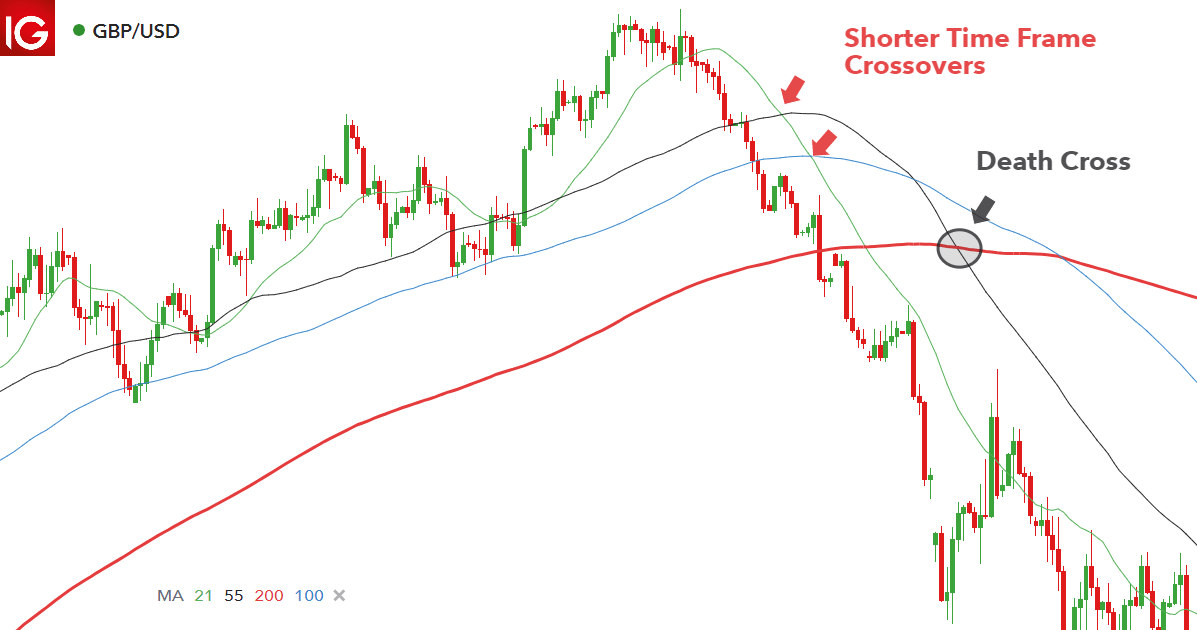
Incorporating shorter term moving averages like the 21, 55 and 100 day moving averages, allows traders to determine whether the existing trend is running out of steam because they track more recent price movements over a shorter time period.

The GBP/USD chart below, shows how the smaller, faster moving averages signal that the uptrend may be about to reverse. The 21 day (green) moving average crosses through the 55 day (black) moving average and continues to cross the 100 (blue) and 200 (red) day moving averages to the downside. These are all bearish signals that appear before the 200 day moving average presents a bearish signal.

shorter time frame moving average crossovers

Using the 200 Day Moving Average as a Trend filter

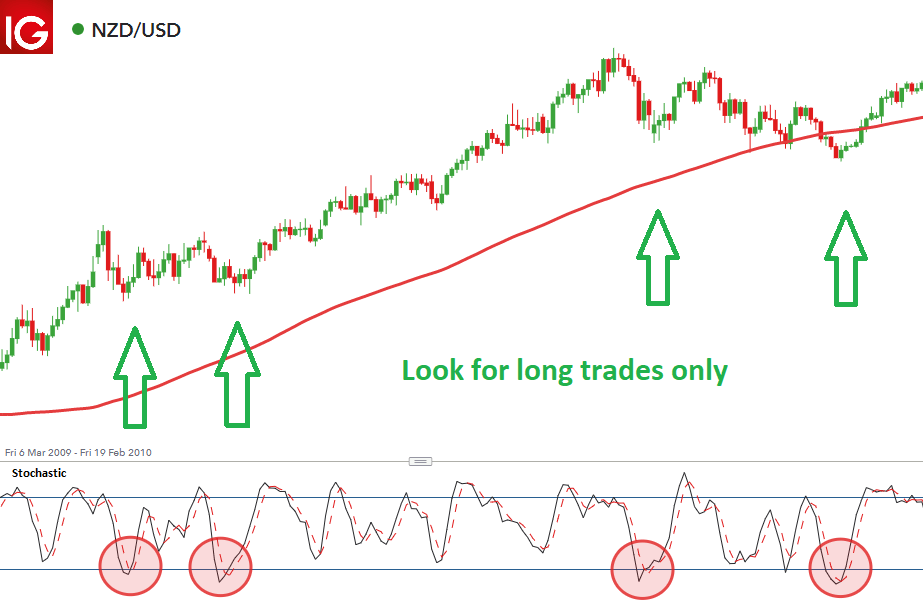
One of the easiest strategies to incorporate with the 200 day moving average is to view the market in relation to the 200 day moving average line. Traders commonly do this to analyze the general market trend and then look to only place trades in the direction of the long-term trend.

In the NZD/USD chart below, the market is trading above the 200 day moving average for a prolonged period of time. This means that the market is trending upwards and therefore, traders should only be looking for long entries into the market. The example below makes use of the stochastic oscillator however, traders should make use of an indicator or any other entry criteria they feel comfortable with.

filternng trades in the direction of the trend using the 200 day moving average chart

200 Day Moving Average Indicator: A Summary

  • The 200 day moving average is a widely adopted indicator showing the direction of the long term trend in any market.
  • Due to its mass adoption, the 200 day moving average can often be considered a self-fulfilling prophecy.
  • Traders use the 200 day moving average to filter trades in the direction of the long term trend and look for bounces off the 200 day moving average to inform trades.

Become a Better Trader with Our Trading Tips

  • The 200 day moving average is just one of many helpful indicators. Expand your trading knowledge by reading our article on some of the most popular technical indicators
  • If you are just starting out on your trading journey it is essential to understand the basics of forex trading in our free new to forex trading guide.
  • Moving averages are trend following indicators. Other trend indicators include the Ichimoku Cloud, Average Direction Index. Alternatively, trends can be identified with the use of trendlines.
Natural Gas Price Rebound Could Extend; What’s Next for Crude Oil?

Natural Gas Price Rebound Could Extend; What’s Next for Crude Oil?

Natural gas: Base-building in progress?

Natural gas prices could be due for further gains on declining drilling activity on oversupply conditions, tighter credit conditions, and oversold technical conditions.

Reports suggest the US natural gas sector is rapidly pulling drilling rigs from the field due to oversupply conditions due to the collapse in natural gas prices in recent months. A drastic reduction in supply is likely to provide a floor to natural gas which is hovering around 2.5-year lows.

In its May Short-term Energy Outlook, the US Energy Information Administration expects the U.S. benchmark Henry Hub natural gas spot price to increase throughout 2023 from its recent lows. The agency expects the monthly average price to reach 3.71 in December on increased demand and reduced production.

Natural Gas Daily Chart

image1.png

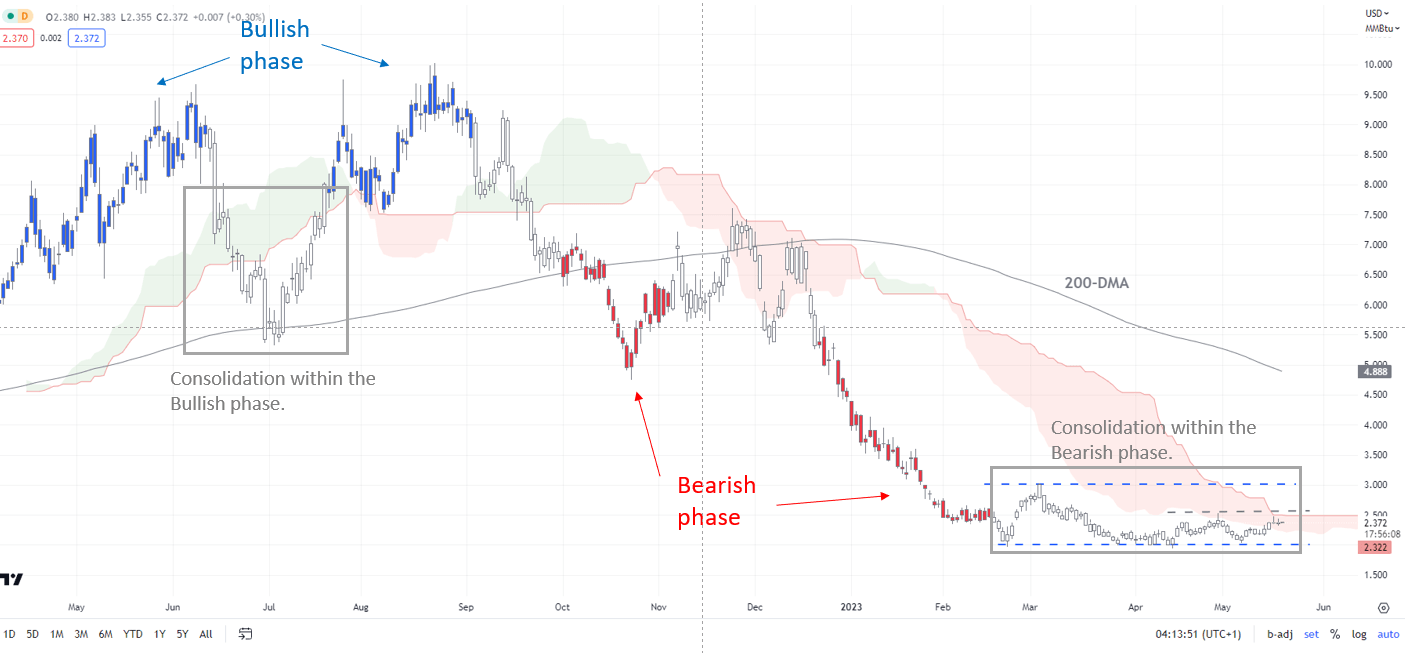
On technical charts, the bearish pressure appears to be fading as natural gas has shifted to a consolidation phase (see colour-coded candlestick charts based on trending/momentum indicators). Moreover, market diversity had been running at extremely low levels. See “Natural Gas Price Setup: Downward Pressure is Abating”, published April 11.

Natural Gas Weekly Chart

image2.png

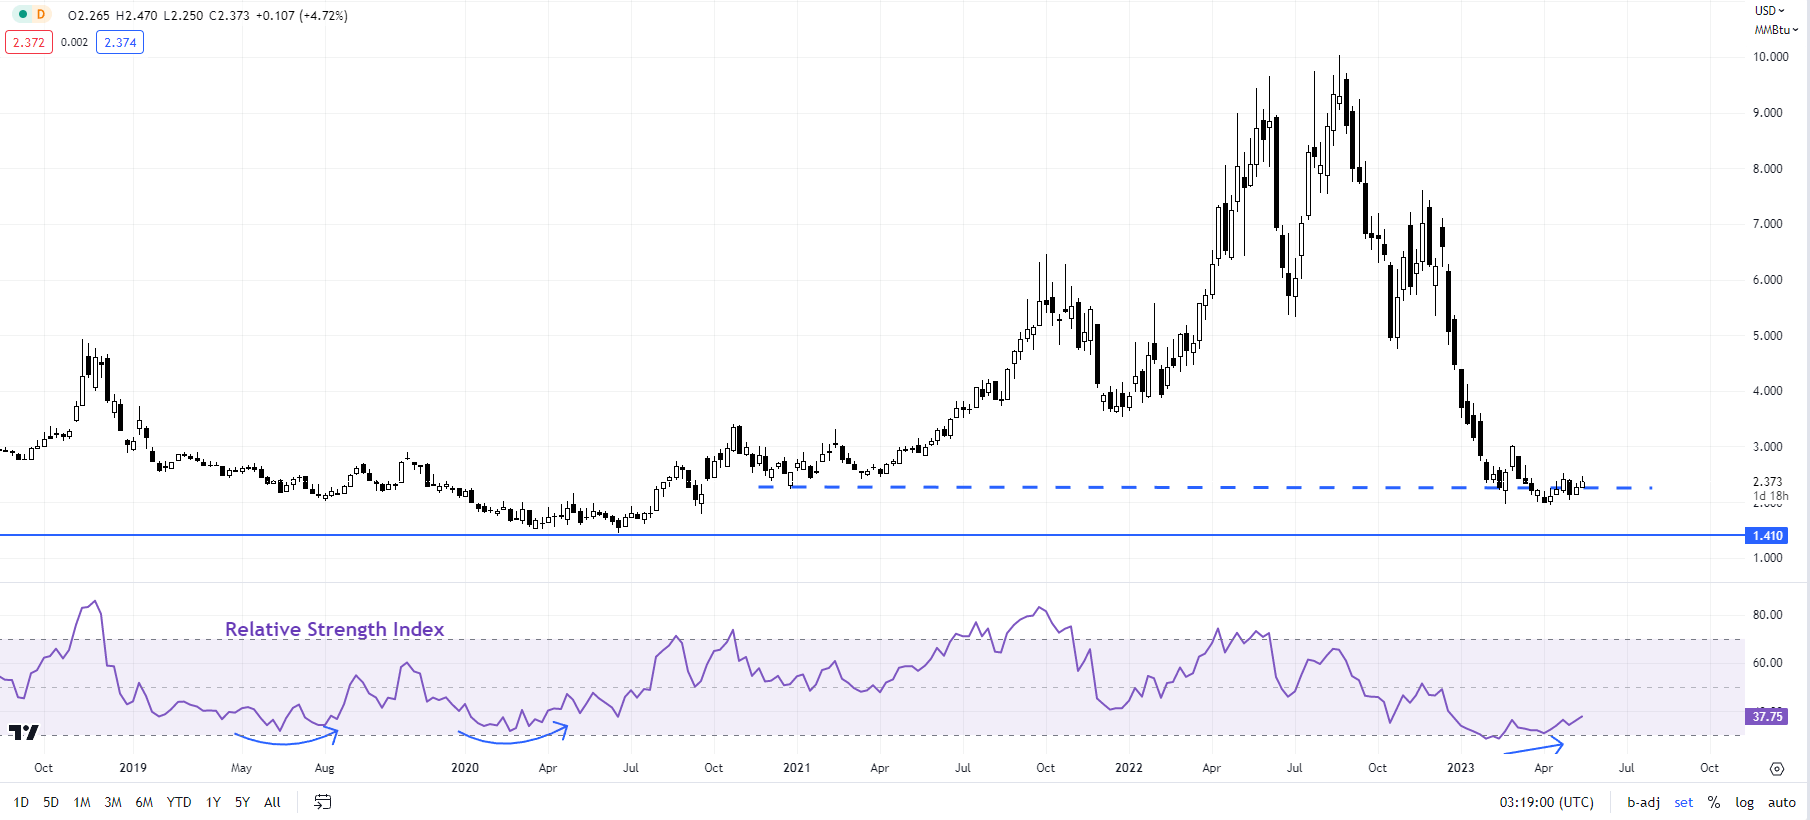
It is now testing a vital ceiling at the April high of 2.52. A break above is needed to confirm that the downward pressure has eased. Such a break could open the door toward the March high of 3.03. Natural gas appears to have found some support at the February low of 1.97. Positive momentum divergence on the daily and weekly charts (declining price associated with higher momentum readings) indicates that the multi-month-long slide is losing momentum.

Crude Oil Daily Chart

image3.png

Crude Oil: Holding above key support

Meanwhile, upward momentum has been lacking even as crude oil has seemingly found a floor for now. While the downtrend hasn’t reversed yet, the recent price action raises the odds that oil may have capitulated. For more discussion, see “Crude Oil Extends Slide in Asia: Is This Capitulation?”, published May 4.

Crude Oil Weekly Chart

image4.png

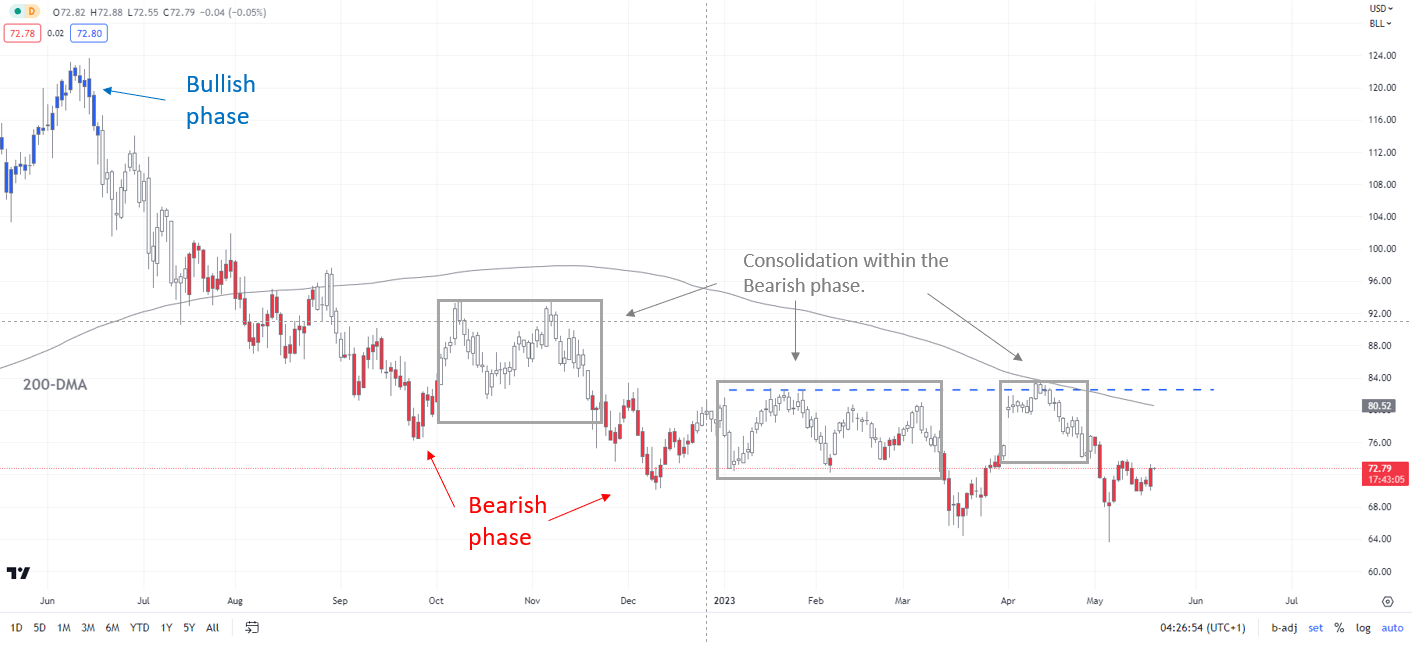
To be fair, the broader trend remains down since mid-2022 as the colour-coded candlestick charts based on trending/momentum indicators show. See recent updates (April 10,April 13, andApril 26) highlighting the consolidation phase despite the output cut by OPEC and its allies in April.

An encouraging sign for bulls is holding above major converged support: the 200-week moving average and the March low. But unless the 82.00-84.00 resistance is broken, the path of least resistance for oil is sideways to down.

Note: In the above colour-coded chart, Blue candles represent a Bullish phase. Red candles represent a Bearish phase. Grey candles serve as Consolidation phases (within a Bullish or a Bearish phase), but sometimes they tend to form at the end of a trend. Note: Candle colors are not predictive – they merely state what the current trend is. Indeed, the candle color can change in the next bar. False patterns can occur around the 200-period moving average, or around a support/resistance and/or in sideways/choppy market. The author does not guarantee the accuracy of the information. Past performance is not indicative of future performance. Users of the information do so at their own risk.

British Pound (GBP/USD) Update: BoE’s Bailey, Elevated US Bond Yields

British Pound (GBP/USD) Update: BoE’s Bailey, Elevated US Bond Yields

UK inflation is expected to ‘fall sharply’ over the coming, starting with the April number – released May 24 – according to BoE Governor Andrew Bailey as high energy prices begin to drop out of the annual calculations. Mr. Bailey, in a speech given at the annual British Chamber of Commerce Conference, also sees food inflation easing, although his timing on this is less sure. While positive on the path of inflation, the UK central bank remains fully committed to bringing down inflation to the 2% target and won’t flinch from hiking interest rates further if needed, Governor Bailey added. On a more positive note, Mr. Bailey added,

‘Having said all that, things are looking a bit brighter than they did a couple of months ago. As the MPC published its November Monetary Policy Report (MPR) last year, we expected a shallow but long recession in the UK economy. In the latest MPR, published last week, we are now forecasting modest, but positive growth and a much smaller increase in unemployment.’

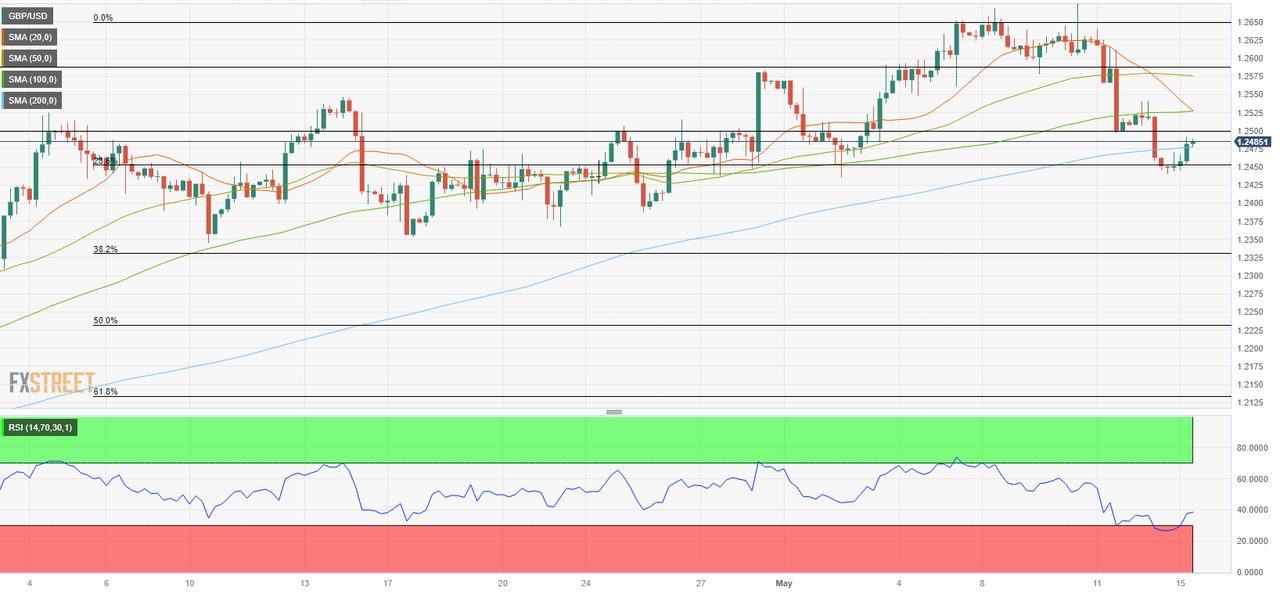
Cable (GBP/USD) is on the back foot over the last couple of days as higher US Treasury yields bolster the US dollar. The yield on the interest rate-sensitive US 2-year rose to a two-week high of 4.12% yesterday after various Fed members’ hawkish views on monetary policy hit the screens. The US 2-year currently trades with a yield of 4.08%. Interest rate cut predictions for this year are being pared back, bringing the market back towards the Federal Reserve’s stance that rates will remain unchanged, or move slightly higher, through the rest of the year.

GBP/USD currently trades around a prior short-term support level at 1.2447 with additional support from the 50-day moving average just below at 1.2391. Below here is a cluster of recent lows down to 1.2350. Initial resistance is seen at 1.2547 before 1.2515 (20dma), 1.2667, and 1.2680 come into view.

GBP/USD Daily Price Chart – May 17, 2023

image1.png


Gold Price Forecast: XAU/USD at Risk of Further Downside Below the Psychological $2000 Mark

Gold Price Forecast: XAU/USD at Risk of Further Downside Below the Psychological $2000 Mark

Gold (XAU/USD) AND DOLLAR INDEX FUNDAMENTAL BACKDROP

Gold prices have steadied following yesterday’s fall as key support level and 50-day MA come into play. The dollar index (DXY) has strengthened in the early part of the week as the continued deadlock over the US debt ceiling continues.

Gold prices have benefitted over the past few months as demand has surged on the back of recessionary concerns and the US banking crisis. However, given all the uncertainties, gold prices failed to sustainably hold above the $2000 mark leading market participants to wonder, is this the end of the bullish cycle? I for one see further uncertainty ahead as Central Banks look to pause rate hikes with Gold likely to be a beneficiary of any further market uncertainty in the second half of the year. The early week dollar strength has come about as safe haven demand for the USD spiked as tensions around the US debt ceiling reached fever pitch yesterday as US President Joe Biden and House Rep. Kevin McCarthy met. There were some positive developments according to both parties. McCarthy did however state that he isn’t optimistic a deal will be reached by the end of the week. Historically speaking the US came close to a debt default in 2011 with a default averted at the last minute. Given the debt ceiling has been raised around 66-68 time since WW2 market optimism this morning may not be misplaced after all.

image1.png

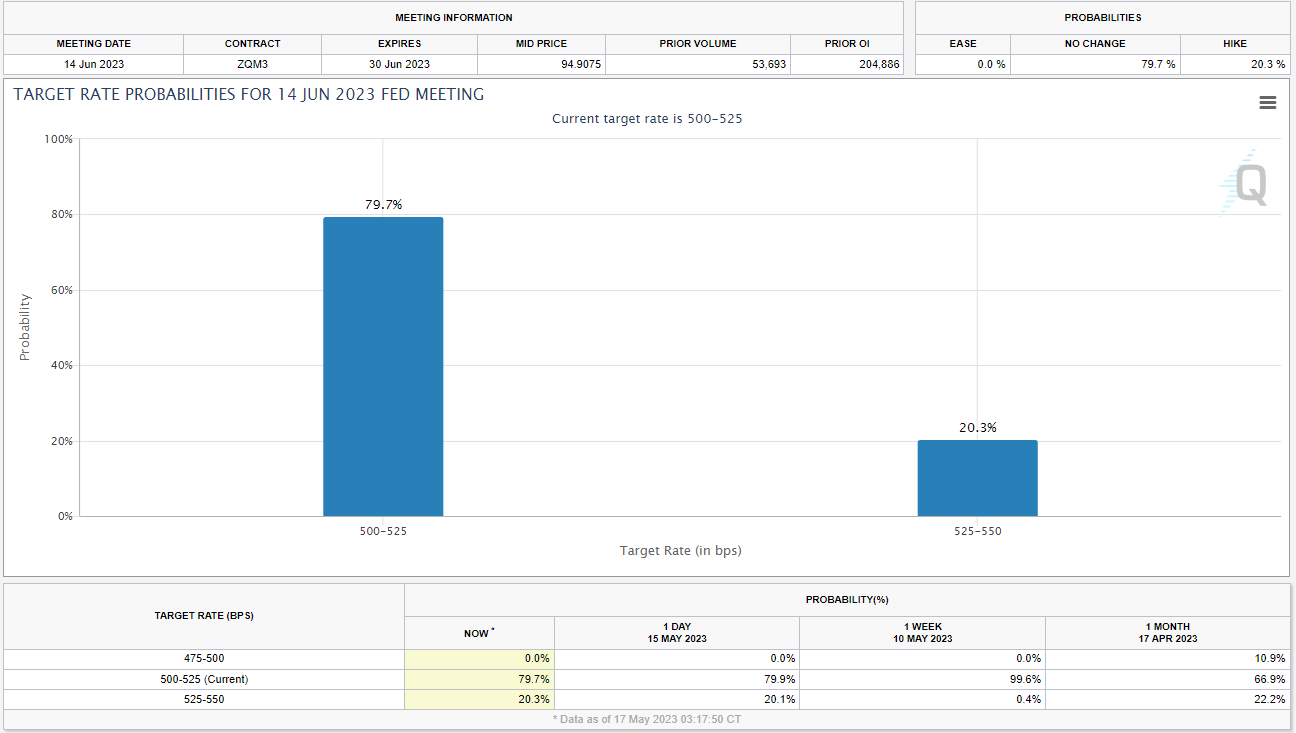
Yesterday’s US data came in mixed with retail sales MoM missing estimates while industrial production ticked higher. US Federal Reserve speakers continue to keep markets on alert as we heard from Atlanta Federal Reserve President Bostic said the Fed would need to stay super strong in fighting inflation even if it leads to an increase in unemployment. Austen Goolsbee from the Chicago Fed said rate cut discussions are premature with Thomas Barkin that he would be comfortable with further rate hikes. The comments and safe haven appeal of the US dollar saw the dollar index (DXY) rally to a 2-week high as it taps into the 100-day MA. The developments over the past week have seen expectations for a pause in Fed rate hikes decline from 99% a week ago down to 79% this morning per the FedWatch Tool above.

Not a lot to look forward to on the calendar today but we do have some medium impact data out of the US. The building permits preliminary data as well as housing starts for April are scheduled for release and may provide a clearer picture of the US housing market.

A picture containing text, font, number, screenshot  Description automatically generated

TECHNICAL OUTLOOK AND FINAL THOUGHTS

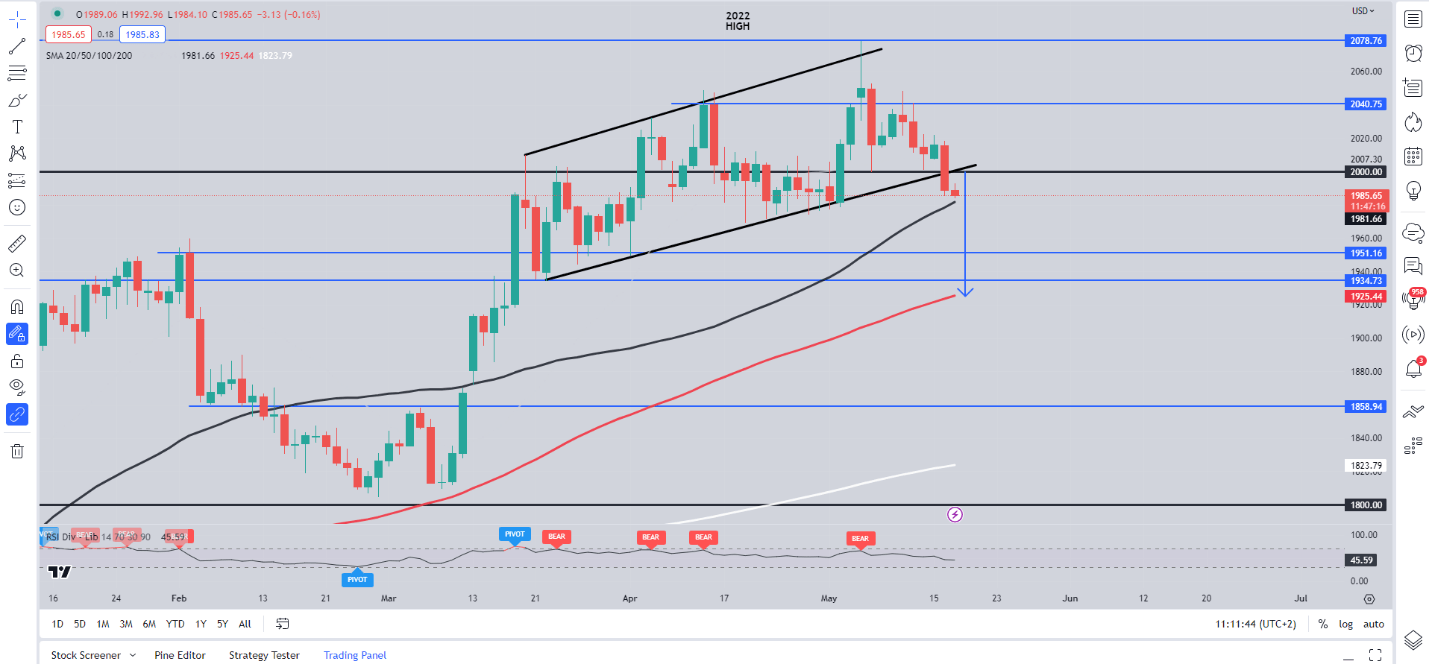
Form a technical perspective, Gold price action has been overshadowed of late by overall market sentiment and safe haven demand. However, the precious metal had been printing lower highs and lower lows since topping out at around the $2079 handle on May 4.

We have broken the ascending channel and currently trade just shy of the 50-day MA resting at $1981.50 with a break below opening up a potential retest of the 100-day MA around $1925. Of course, there are other intraday support levels which could scupper a test of the 100-day MA with support at $1970 and $1950 likely to prove stubborn. A push to the upside brings the psychological $2000 level back into play which currently lines up with the ascending channel breakout.

In short, we have seen some erratic moves of late which could continue with a lack of high impact data market sentiment, dollar index and developments around the US debt ceiling are likely to drive gold prices. Technicals are flashing bearish signals with a bias to the downside in the short-term seemingly appropriate. A daily candle close above the $2007 mark would invalidate the current bearish bias. I would advise caution and attention to developments on the dollar index as well as the US debt ceiling which could result in some unexpected price swings for the rest of the week.

Gold (XAU/USD) Daily Chart – May 17, 2023

image3.png

EUR/USD. 1.0800 may come under pressure soon – ING

EUR/USD. 1.0800 may come under pressure soon – ING

EUR/USD is coming under pressure again. Economists at ING expect the pair to test the 1.0800 level.

Pressure on 1.0800 coming?

“We keep stressing how 1.0800 is probably a key benchmark level to gauge market sentiment about the US debt-ceiling story.”

“We could see some good support at 1.0800, and a break lower could indicate the FX market moving more seriously to price in a US default.”

“The domestic story for the Euro is not deteriorating materially and the decline is almost entirely driven by the dollar leg, although yesterday’s ZEW figures in Germany did send some worrying signals.”


ECB’s de Cos: Stickier inflation to choke growth outlooks – MNI

ECB’s de Cos: Stickier inflation to choke growth outlooks – MNI

European Central Bank (ECB) policymaker and Bank of Spain’s Governor Pablo Hernandez de Cos said in an MNI interview on Wednesday, “the persistence of higher inflation would slow the recovery and would very likely lead to further tightening in the euro area.”

“The longer higher interest rates remain, the more likely that financing cost rises for banks and a deterioration in the quality of credit risk, de Cos added.

Market reaction

At the time of writing, EUR/USD is extending losses toward 1.0800, down 0.33% on the day at 1.0826. Broad-based US Dollar strength amid a cautious market mood is weighing on the main currency pair.