Status of US Dollar as Global Reserve Currency and Exchange Rates: Slow Long-Term Decline on Track

Status of US Dollar as Global Reserve Currency and Exchange Rates: Slow Long-Term Decline on Track

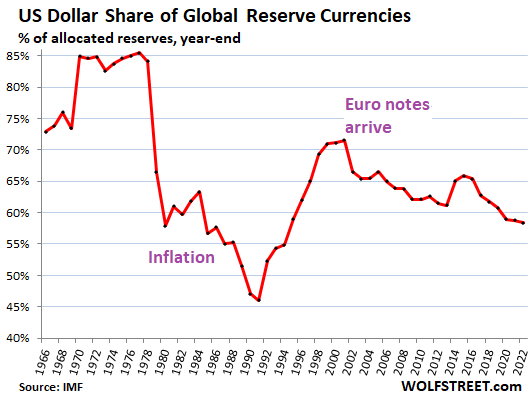
The share of the US-dollar as global reserve currency dropped to 58.4% at the end of Q4, according to the IMF’s new COFER data. This was the dollar’s lowest share of global reserve currencies since 1994.

Back in 1978, the dollar’s share started plunging from around 85% of global exchange reserves as inflation exploded in the US, and other central banks got cold feet holding securities denominated in this stuff. In the 1980s, inflation started to come down. But central banks – and the rest of the world – took a long time to regain confidence in the dollar, and the dollar’s share of reserve currencies didn’t bottom out until 1991, with a share of 46%. Then came the bounce until the euro showed up, which put a stop to the bounce. The chart shows the share of the dollar at the end of each year.
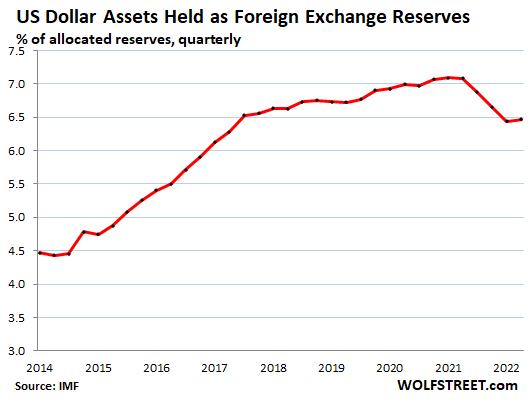
The US dollar as global reserve currency means that foreign central banks and other foreign official institutions hold US-dollar-denominated assets, such as US Treasury securities, US corporate bonds, US mortgage-backed securities, and the like.

These institutions also hold foreign exchange reserves other than dollar-assets. But holdings in their own local currency are not included in foreign exchange reserves; so holdings of dollar-denominated assets by the Federal Reserve are not included; holdings of euro-denominated assets by the ECB are not included, etc. Same for other central banks: their local-currency assets are not included.

In dollar terms, at the end of Q4, central banks other than the Fed held $6.47 trillion in USD-denominated assets, such as US Treasury securities, US corporate bonds, and US mortgage-backed securities.

Even as the dollar’s share has dropped since 2014, holdings of dollar-assets rose from $4.4 trillion in 2014 to $7.1 trillion in Q3 2021. But then, note the $621 billion drop in USD holdings starting in Q4 2021, which was when the Fed started talking about ending QE and kicking off rate hikes – and by now it has hiked by 475 basis points.
The other major reserve currencies.

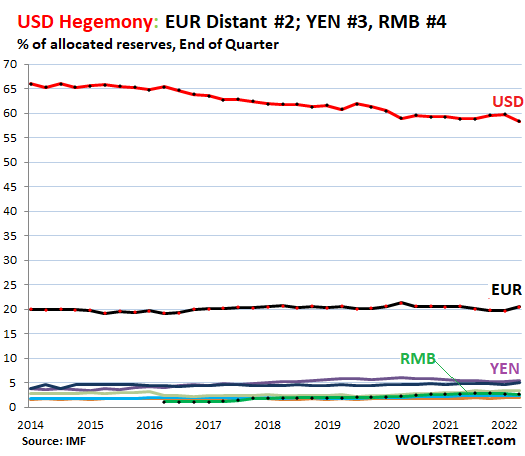
The euro is the second largest reserve currency, with a share of 20.5% at the end of 2022. Back in the day when the euro was created, there was talk that it would reach “parity” with the dollar, but the Euro Debt Crisis brought to light the euro’s structural weakness, which ended the parity talk, and the euro has maintained a share of roughly 20% since then.

The yen, the third-largest reserve currency, had a share of 5.5% (purple line at the top of the colorful spaghetti at the bottom in the chart).

The British pound, the fourth largest reserve currency, had a share of 4.9% (blue line just under the yen).

The Chinese renminbi, the fifth largest reserve currency, lost a little ground last year, with its share dipping to 2.7% at the end of 2022. Due the capital controls, convertibility issues, and other issues, it seems central banks are leery of RMB-denominated assets and are moving slowly or not at all. At this pace, the RMB won’t get close to the USD as reserve currency for decades (green line near the very bottom).

The other currencies in the spaghetti: Canadian dollar (2.4%), Australian dollar (2.0%), and Swiss franc (0.2%). There is a number of other currencies with a tiny share each (each less than the Swiss franc’s share), and all of them combined have a share of 3.4%.
Dollar-exchange rates impact foreign exchange reserves.

The values of foreign exchange reserves denominated in euros, yen, British Pound, RMB, and other currencies are translated into USD figures at the exchange rate at the time, for reporting purposes, so that they can be summed and compared.

For example, the value of Japan’s official holdings of euro-denominated assets is expressed in dollars at the EUR-USD exchange rate at the time. So the magnitude, expressed in dollars, of euro-denominated assets held by Japan rises or falls with the USD-EUR exchange rate, even if Japan’s holdings don’t change.

In other words, the exchange rate between the USD and other reserve currencies impacts the magnitude of the non-USD assets.

Since 2000, the exchange rates of the major currency pairs have bounced up and down within a fairly wide band, as shown by the Dollar Index [DXY], which is dominated by the euro and yen, but also tracks the British pound, Canadian dollar, Swedish krona, and Swiss franc.

At the end of Q4, the IMF’s cutoff point for this reserve currency data, the DXY closed at 103.4, where it had been in the year 2002, but with a lot of scary rollercoaster rides in between (data via YCharts):
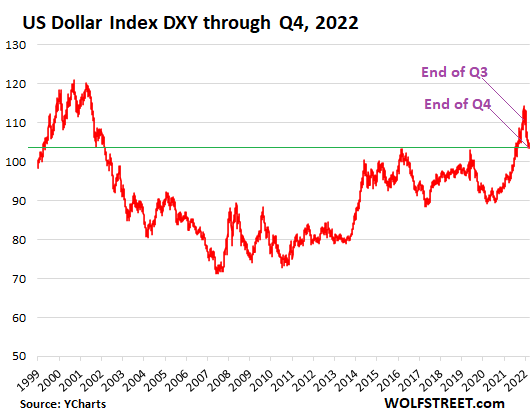
So the dollar’s exchange rate with the euro and the yen at the end of 2022 was roughly where it had been in 2002. But back then, the dollar’s share of reserve currencies had been 66.5%; and at the end of 2022, it had fallen to 58.4%. So the decline in the dollar’s share is not due to exchange rates.

Trade surplus and large reserve currency, no problem.

The Eurozone – whose currency is the #2 reserve currency with a 20% share – has had a trade surplus with the rest of the world in recent years, particularly with the US. This shows that an economy with a trade surplus can also have one of the top reserve currencies, disproving some theories that the country with a large reserve currency must have a large trade deficit.

The big enabler: But having the dominant reserve currency enables the US to run up its twin-deficits: the gigantic US government deficit and the monstrous trade deficit, fueled by Corporate America’s three-decade search of cheap labor, products, and services. If in the future the USD-denominated assets lose a lot of share among reserve currencies, both of these deficits will be more difficult and expensive to fund.

China: It is also likely – and I think good for the global and even the US economy – that China’s RMB-denominated assets, given the huge size of the economy, will eventually ever so slowly become a larger player amid global exchange reserves.

German output rises slightly whilst input costs plummet amid rapidly improving supply conditions

German output rises slightly whilst input costs plummet amid rapidly improving supply conditions

German manufacturing output edged slightly higher for the second month running in March, aided by increased availability of components and materials, latest PMI® survey data showed. The improvement in supplier performance was by far the greatest seen in the series history and represented an unwinding of the unprecedented disruption brought about by the pandemic. The decline in manufacturing input costs meanwhile gathered pace. Less positively, demand remained under pressure as customers refrained from placing new orders due to low confidence, rising borrowing costs and a desire to run down inventories. Accordingly,

UK manufacturing falls back into contraction as trend in new business remains weak

UK manufacturing falls back into contraction as trend in new business remains weak

The UK manufacturing sector fell back into contraction territory in March, as output declined following a slight increase in February. Market conditions remained subdued overall, as new export business decreased and overall new order books posted only fractional growth. There was positive news on the price and supply fronts, however, as cost inflation eased and average supplier lead times improved to the greatest extent in survey history. The seasonally adjusted S&P Global / CIPS UK Manufacturing Purchasing Managers’ Index® (PMI®) fell to 47.9 in March, down from February’s seven-month high of 49.3

AUD/USD: Aussie to benefit if the RBA emphasizes the possibility of further hikes – Commerzbank

AUD/USD: Aussie to benefit if the RBA emphasizes the possibility of further hikes – Commerzbank

The Reserve Bank of Australia (RBA) will hold its monthly meeting on Tuesday. The key question is whether the RBA will take a break in its rate hike cycle and how it expects interest rates to develop in the near future, economists at Commerzbank report.

Will the RBA pause its rate hike cycle?

“There is certainly a risk that after a cumulative 350 basis points of rate hikes, the RBA will pause for now and wait for the quarterly price index and another labor market report.”

“Still, it could emphasize the possibility of further hikes and make them conditional on the next data releases. This would take some wind out of the market’s rate cut expectations. The Aussie would certainly benefit from such an outcome.”

Silver Price Analysis: XAG/USD keeps the red below $24.00, downside seems cushioned

Silver Price Analysis: XAG/USD keeps the red below $24.00, downside seems cushioned

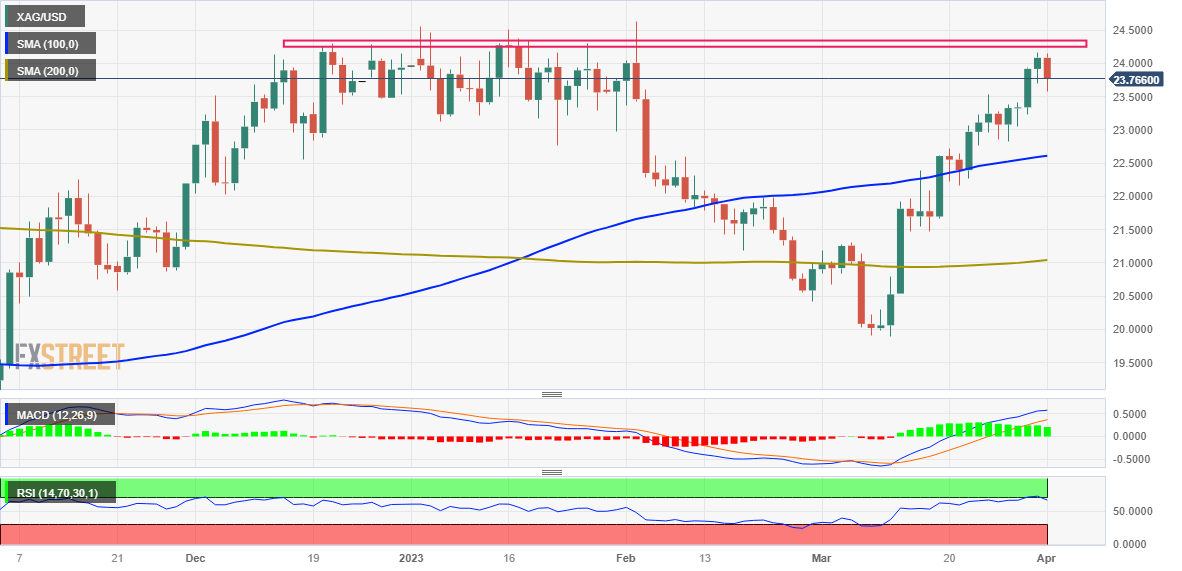
Silver kicks off the new week on a downbeat note and snaps a four-day winning streak to a nearly two-month high, around the $24.15 region touched on Friday. The white metal maintains its offered tone through the early part of the European session and trades around the $23.75 zone, down over 1.30% for the day.

From a technical perspective, the recent strong move up from the YTD low – levels just below the $20.00 psychological mark, stalls ahead of the $24.20-$24.25 static resistance, which should now act as a pivotal point. Some follow-through buying, leading to a subsequent strength beyond the multi-month peak, around the $24.60-$24.65 area touched in February, will b seen as a fresh trigger for bullish traders.

Given that oscillators on the daily chart have pulled back from overbought territory, the XAG/USD might then aim to reclaim the $25.00 psychological mark for the first time since April 2022. The upward trajectory could get extended further towards the next relevant hurdle near the $25.75-$25.80 region en route to the $26.00 round-figure mark and the April 2022 swing high, around the $26.20-$26.25 area.

On the flip side, the daily low, just ahead of the mid-$23.00s, now seems to protect the immediate downside. Any subsequent slide is more likely to attract fresh buyers near the $23.00 mark and remain limited near the $22.80-$22.75 region. That said, a convincing break below might prompt some technical selling and drag the XAG/USD towards the $22.25 intermediate support en route to the $22.00 round-figure mark.

Silver daily chart

fxsoriginal

Key levels to watch

EUR/GBP may keep hovering around 0.8800 this week – ING

EUR/GBP may keep hovering around 0.8800 this week – ING

Economists at ING expect the EUR/GBP pair to stablize around the 0.88 level in the next few days.

A quiet week in the UK

“The Pound should continue to move in tandem with the Euro, given few catalysts to drive a consistent divergence from the common currency and external (Dollar) factors dominating in FX. So, EUR/GBP may keep hovering around 0.8800 in a week where both the UK and Eurozone’s economic calendars are pretty much empty.”

“If a move to 1.10 in EUR/USD was delayed by OPEC+, the same could be said about a move to 1.25 for Cable.”

“The Dollar leg of GBP/USD will keep driving most moves in the pair this week and US data will be in focus.”

EUR/USD recovers above 1.0800 as markets stabilize

EUR/USD recovers above 1.0800 as markets stabilize

EUR/USD is cutting losses to regain 1.0800 in early European trading. Unexpected OPEC+ oil output cut fuelled oil price rally and stoked up inflation fears, boosting the safe-haven US Dollar alongside firmer US Treasury yields. The focus now shifts to the US ISM PMI.

EUR/USD has met resistance in the 1.0900/1.0910 (psychological level, end-point of the latest uptrend) area late Thursday, confirming that level as a significant resistance. The Relative Strength Index (RSI) indicator on the four-hour chart declined toward 60, pointing to a loss of bullish momentum.

In case the pair manages to hold above 1.0860 (ascending trend line, 20-period Simple Moving Average (SMA)), however, buyers could remain interested. In that scenario, EUR/USD needs to rise above 1.0900/1.0910 and use that level as support to be able to clear 1.0930 (static level, March 23 high) and target 1.1000 (psychological level).

On the downside, a four-hour close below 1.0860 could attract sellers and cause the pair to decline to 1.0820 (Fibonacci 23.6% retracement of the latest uptrend, 50-period SMA) and 1.0800 (psychological level).

After having registered impressive gains on Thursday, EUR/USD has lost its traction and declined below 1.0900 on Friday. Inflation data from the Eurozone failed to trigger a significant market reaction. The pair’s near-term technical outlook points to a loss of bullish momentum and a drop below 1.0860 could open the door for further losses.

Eurostat announced that Harmonized Index of Consumer Prices (HICP) declined to 6.9% on a yearly basis in March from 8.5% in February. On a concerning note, however, the Core HICP, which excludes volatile food and energy prices, rose to 5.7% in the same period on the back of a monthly increase of 0.9%. Nevertheless, investors largely ignored this data.

In its Economic Bulletin published on Thursday, the European Central Bank (ECB) reiterated that inflation in the Eurozone is projected to remain too high for too long. “ECB staff now see inflation averaging 5.3% in 2023, 2.9% in 2024 and 2.1% in 2025,” the publication further read.

The US Bureau of Economic Analysis (BEA) will release the Personal Consumption Expenditures (PCE) Price Index data for February later in the day. The Core PCE Price Index, the Fed’s preferred inflation measure, is forecast to hold steady at 4.7% on a yearly basis and is expected to rise 0.4% on a monthly basis.

Since base effects are likely to distort the annual reading, market participants will pay close attention to the monthly PCE inflation print. Although investors will want to see the March jobs report and Consumer Price Index (CPI) figures before deciding whether the US Federal Reserve will leave its policy rate unchanged at its next meeting, a stronger-than-forecast monthly Core PCE Price Index is likely to help the US Dollar find demand ahead of the weekend. On the other hand, a soft print should have the opposite effect and weigh on the USD, helping EUR/USD regain its traction.

US dollar Price Setup This Week: EUR/USD, GBP/USD, USD/JPY

US dollar Price Setup This Week: EUR/USD, GBP/USD, USD/JPY

Key US dollar currency pairs could settle in a range ahead of the Easter holidays, with a key focus on global manufacturing activity data (including US ISM due today) and US payroll data due Friday.

Data released Friday showed US inflation eased a bit in February, but perhaps not enough to warrant an imminent US Fed rate pause. Elsewhere, Euro area headline inflation dropped by most on record in March, but core price pressures accelerated, keeping alive hopes of further European Central Bank tightening. The Bank of England has left the door open for further hikes, while the Bank of Japan’s next meeting at the end of April will be closely watched as the new central bank governor takes charge.

Moreover, US macro data have been stronger than expected since February (Economic Surprise Index is at a one-year high). UK macro data have surprised to the upside in recent weeks, but Euro area and Japan economic data have been less upbeat since February and March respectively.

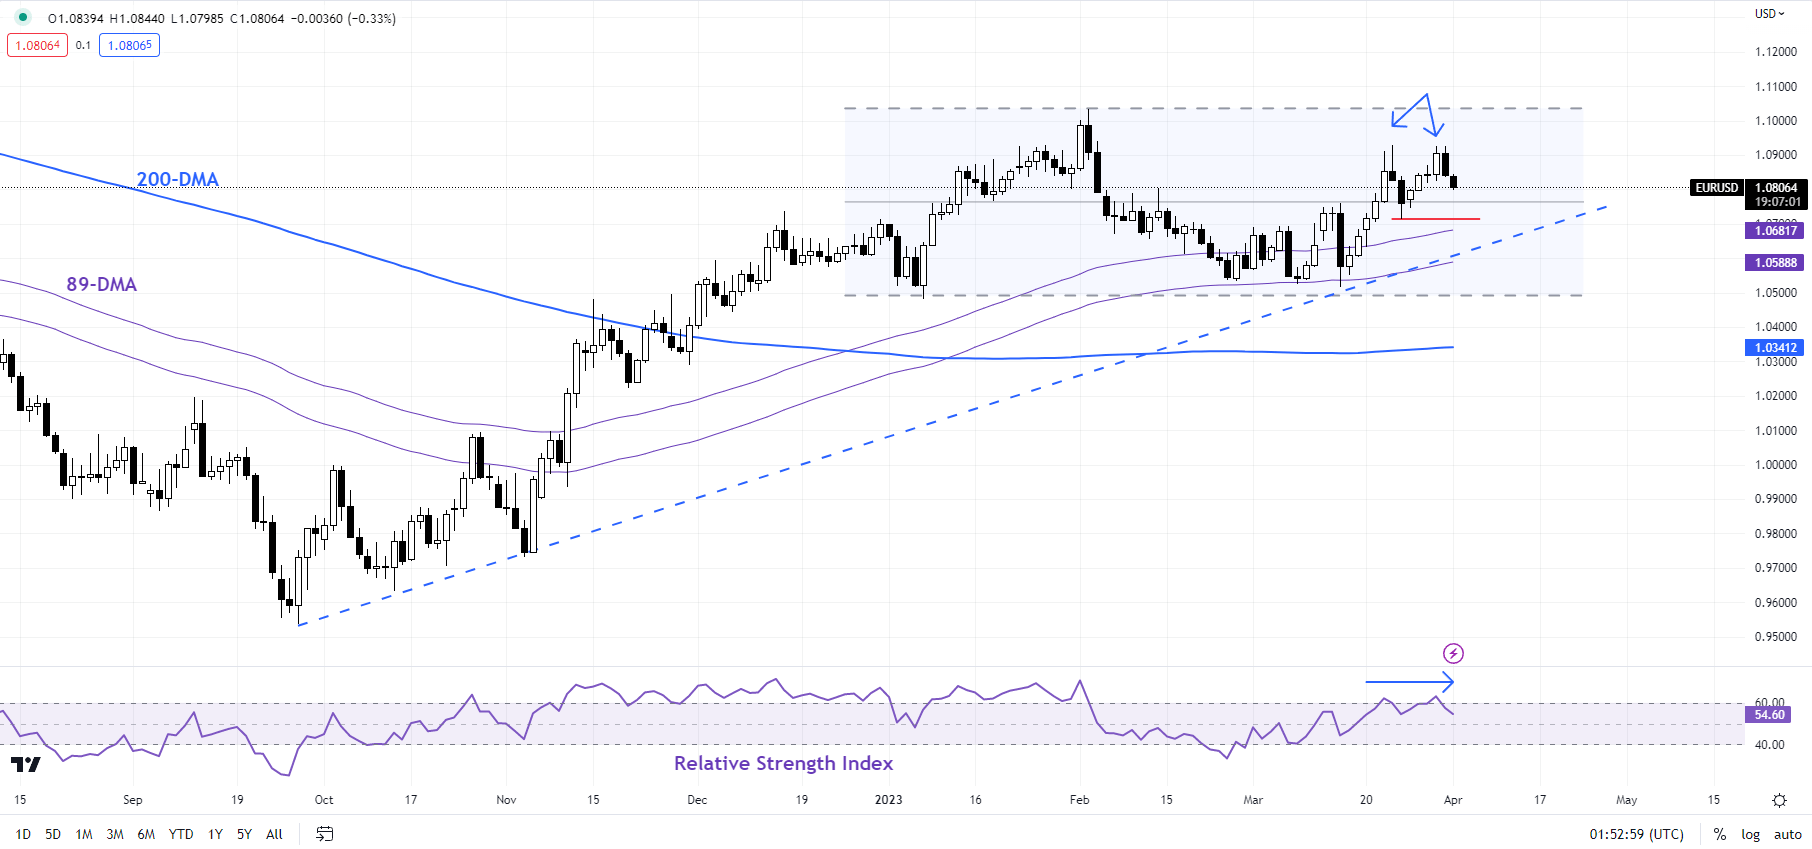
EUR/USD Daily Chart

image1.png

EUR/USD – Upside capped for now

EUR/USD appears to be struggling to extend gains – momentum on the daily charts has stalled in recent sessions as the pair approaches stiff resistance at the February high of 1.1035. Immediate support is at the March 24 low of 1.0710. Any break below would trigger a minor double top (the late-March highs), exposing downside risks toward the March low of 1.0515. Beyond the very near term, EUR/USD looks set to remain within its recently well-established range of 1.05-1.10.As highlighted in the previous update, the rebound last month from around a key floor at the January low of 1.0480 keeps the higher-top-higher-bottom sequence (uptrend) from late 2022 intact.

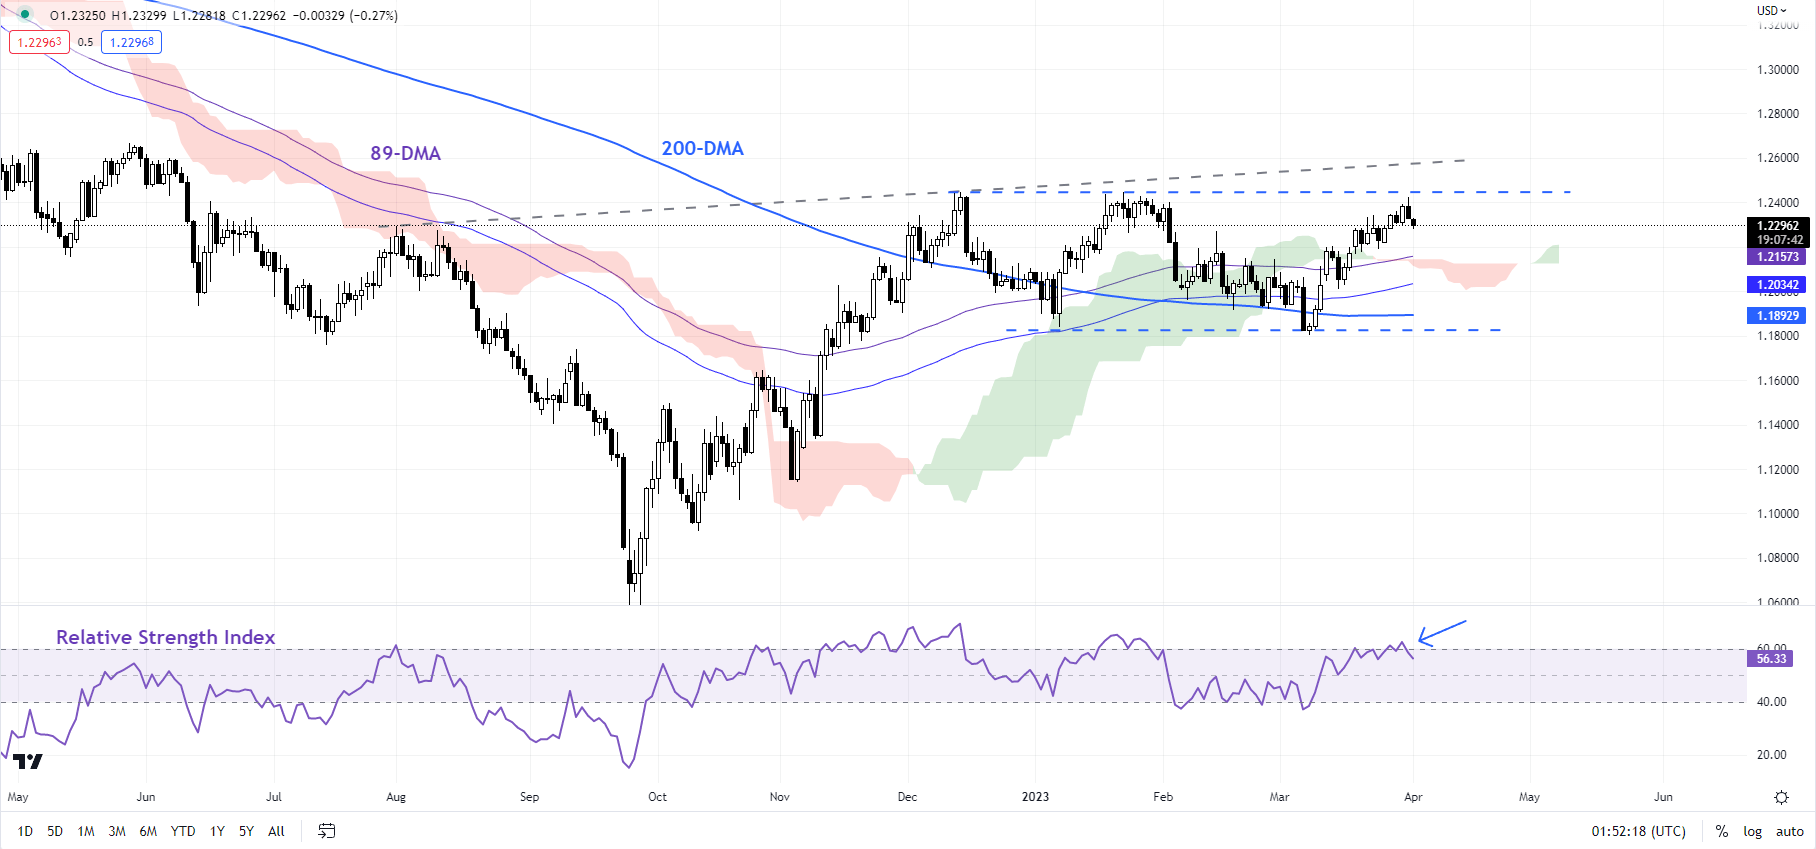
GBP/USD Daily Chart

image2.png

GBP/USD – Tough hurdle at 1.2450

GBP/USD’s failure last month to break below a crucial support at the January low of 1.1840 indicates that the uptrend from late 2022 remains in place. For more discussion on this see “British Pound Price Setup: GBP/USD, EUR/GBP, GBP/JPY”,published March 29. Having said that, the rally since early March appears to be losing steam somewhat as the pair has run into a tough hurdle at the December high of 1.2450. Still, any downside could be limited, with quite a strong cushion near the late-March low of 1.2200. As noted in theprevious update, any break above 1.2450 could potentially open the door for meaningful gains in GBP/USD.

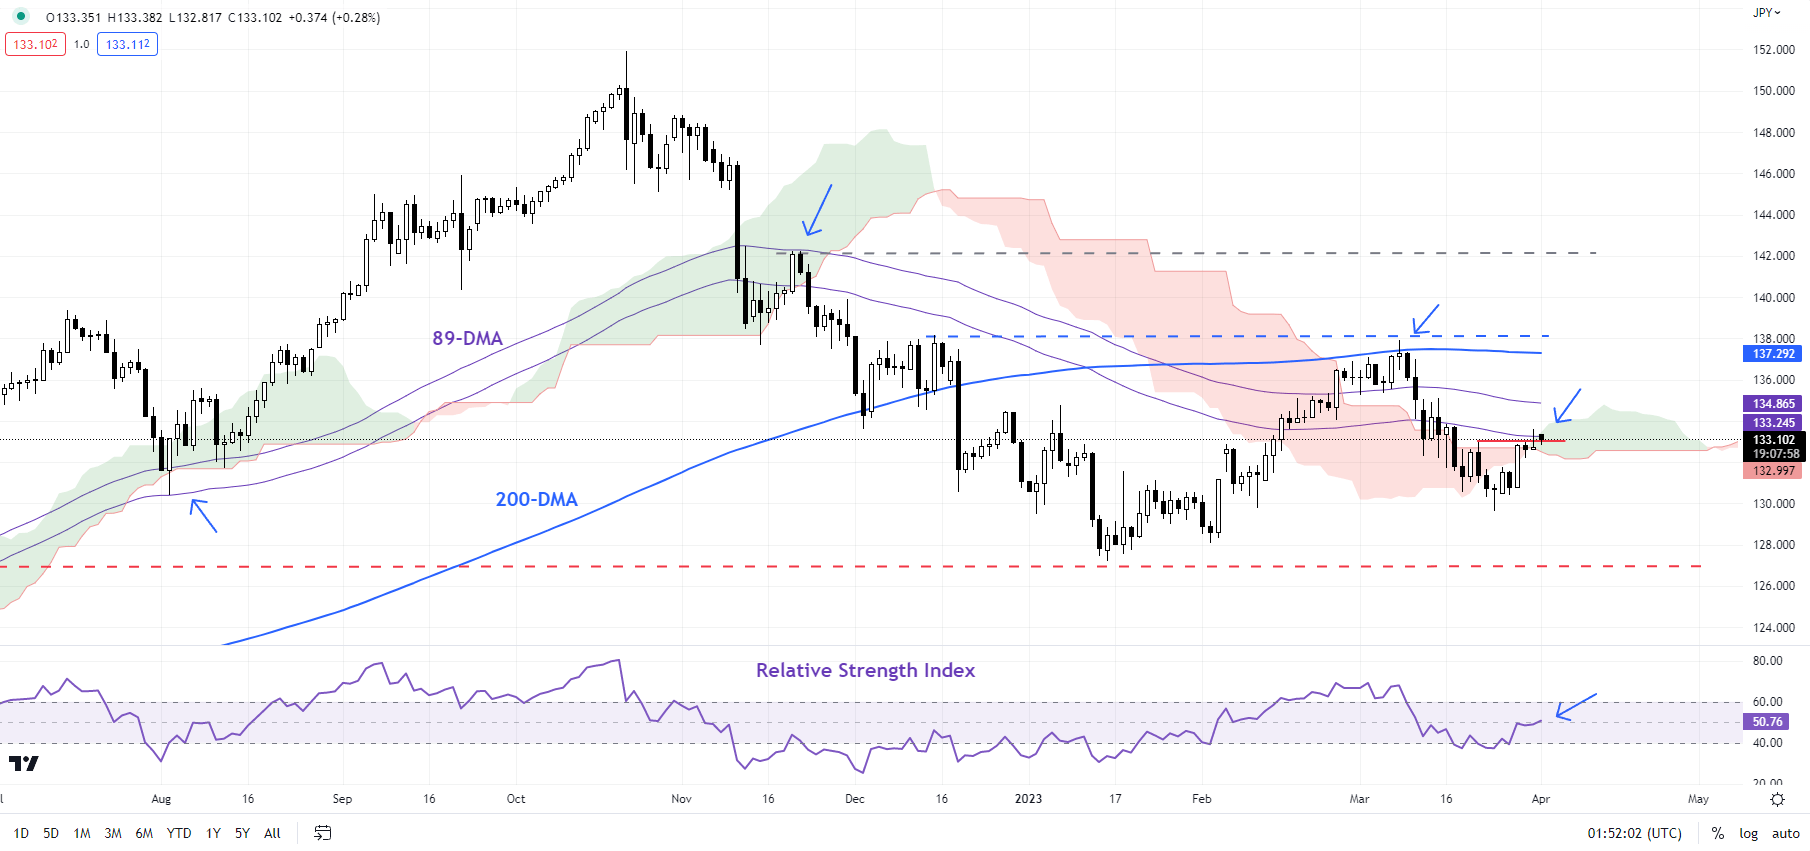
.USD/JPY Daily Chart

image3.png

USD/JPY – Tests a vital barrier

USD/JPY is testing a fairly strong converged ceiling: the 89-day moving average, the Ichimoku cloud cover on the daily charts, and the late-March high of 133.00. For now, the broader bias remains down (See “Japanese Yen Price Setup: USD/JPY, AUD/JPY, EUR/JPY”, published March 27), but any break above the converged barrier could alleviate some of the immediate downside risks, and raise the prospect of a broad range of 127-138 developing in the near term. Furthermore, a break above the converged barrier could open the way toward the 200-day moving average, roughly coinciding with the March high of around 138.00.

Gold Price Dips as US Dollar Firms While Crude Oil Soars. Where to for XAU/USD?

Gold Price Dips as US Dollar Firms While Crude Oil Soars. Where to for XAU/USD?

The gold price is under pressure to start the week against a US Dollar that is stronger across the board. Higher Treasury yields all along the curve underpinned the greenback but it is the crude oil price that has gone to moon on Monday.

On Sunday, OPEC+ announced a 1.1 million barrel per day reduction to its output target. Russia has recently confirmed that they will maintain their 500k fewer barrels per day target through to the end of the year.

The squeeze on supply was already impacting markets with a gain of over 9% last week fuelled by the news that Turkey will no longer be able to have pipeline access from Kurdistan

Black gold opened over 8% high first thing but has since retreated. The WTI futures contract traded at US$ 81.69 bbl early on, while the Brent contract notched a peak of US$ 86.44.

Not surprisingly, APAC energy stocks posted solid gains. The broader Asian equity indices are mostly higher with the exception of Hong Kong’s Hang Seng Index (HSI) which is in the red.

This is despite the Evergrande property group announcing a debt restructure that has been well received by the market with its various stock listings and bonds rallying.

China’s March Caixin manufacturing PMI disappointed, coming in at 50.0 rather 51.4 forecast and 51.6 prior.

French President Emmanuel Macron will be visiting China this week.

The US Dollar consolidated higher against most major currencies with the exception of the oil-linked Canadian Dollar and the Norwegian Krone.

Treasury yields recovered from losses seen going into the close on Friday. The jump in oil prices seems to have added to concerns for inflation going forward and what that may mean for the Fed’s rate path.

Looking ahead, after Swiss CPI and multiple European PMIs, the market will focus on US manufacturing ISM. The RBA will be making its rate decision tomorrow and the market is pricing for the bank to leave the cash rate where it is at 3.60%.

The full economic calendar can be viewed here.

GOLD TECHNICAL ANALYSIS

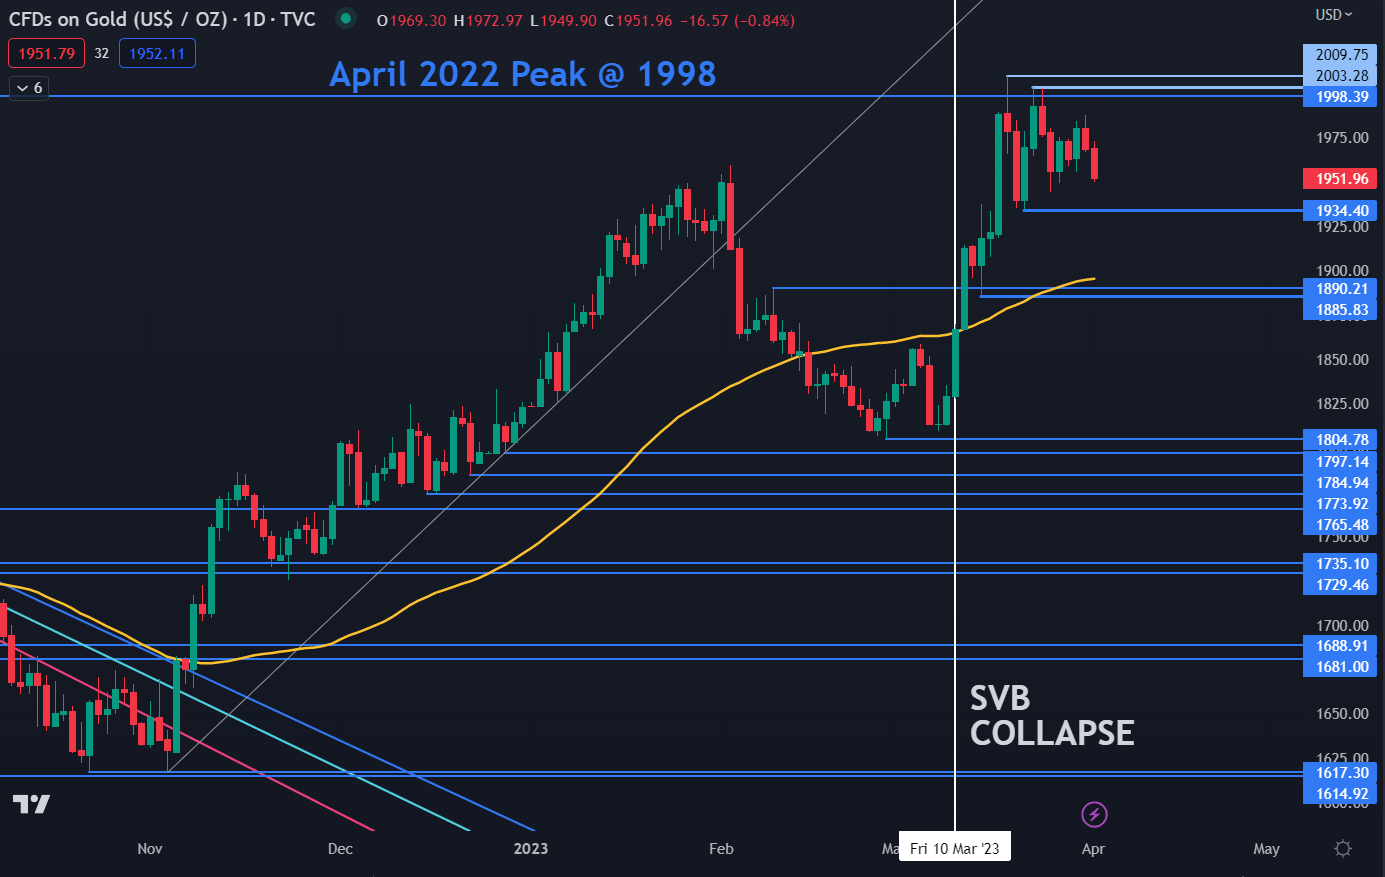
Gold sunk below USD 1,950 today as it consolidates within its two-week range.

Nearby support could be at the recent lows and breakpoint of 1,934, 1,890 and 1,886. The 55-day Simple Moving Average (SMA) may lend support at 1,895.

On the topside, resistance might be at the previous peaks of 1,998, 2,003 and 2010.

image1.png


Gold Price Dips as US Dollar Firms While Crude Oil Soars. Where to for XAU/USD?

Gold Fundamental Forecast: Gold Glowing into Q2 as Fed Peaks

Gold Fundamental Forecast: Gold Glowing into Q2 as Fed Peaks

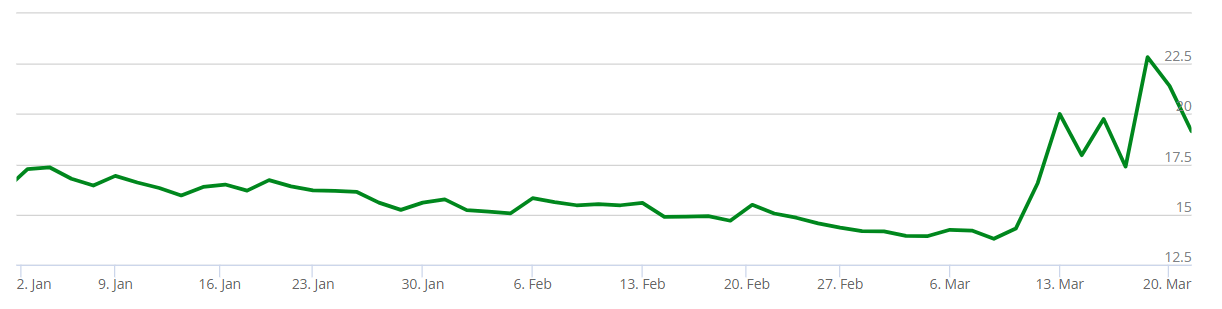
Moving into the second quarter of 2023, gold prices are gaining traction in line with the global banking crisis and uncertainty surrounding the Federal Reserve. Contagion risks from financial market fears have allowed the safe-haven appeal of gold to drive bulls to the cause but this can be fleeting for a quarterly period. Increased volatility has been another contributor to shinier bullion as measured by the GVZ chart below. This measures the market’s expected 30-day price movement in the SPDR Gold Trust (the largest physically backed gold exchange traded fund (ETF) in the world).

CBOE GOLD ETF VOLATILITY INDEX (GVZ) – 2023

image1.png

Source: Cboe.com

The latest volumes for GLD support the recent upside with volumes flowing into the fund steadily rising throughout March, highlighting the mostly positive association between GVZ and GLD respectively. The question remains, will this trend continue through Q2 or not?

SPDR GOLD TRUST (GLD) TRADED VOLUMES (2022-2023)

image2.png

Source: ETF.com

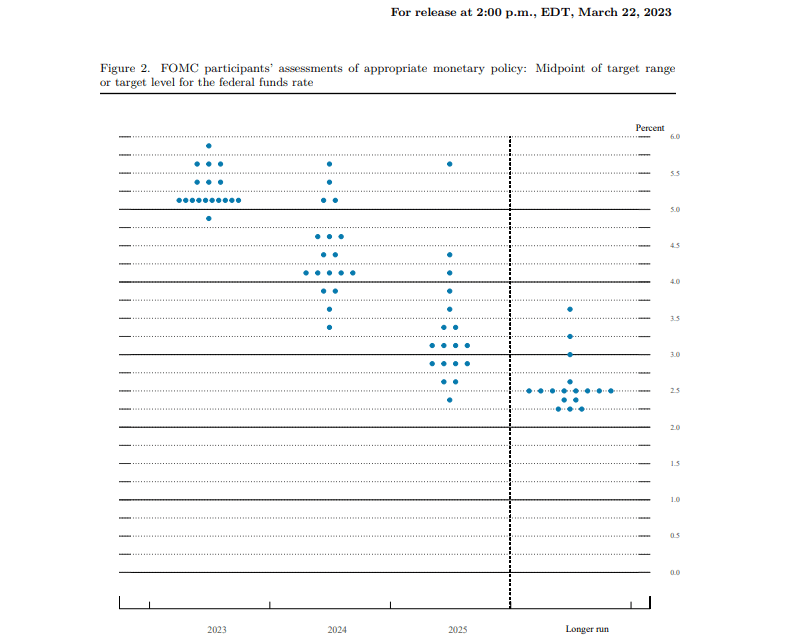
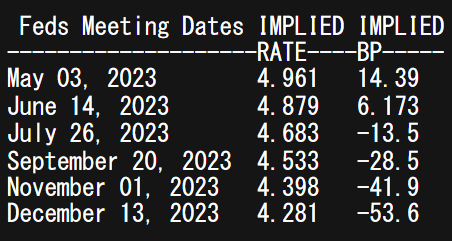
That brings us to the March FOMC rate decision where interest rates were raised by 25bps to 5% in a tight labor market environment alongside elevated inflationary pressures. The updated Fed dot plot is shown in the graphic below and is currently backed by money market pricing shown via the Fed funds implied interest rate probabilities. It seems that we have reached the peak at 5%; however, with inflation still ‘sticky’ and the US economy relatively robust, it leaves the Fed with a tough decision ahead to quell inflation.

FOMC Dot Plot March 22nd, 2023

image3.png

Source: Federal Reserve

FED FUNDS RATE PROBABILITIES

image4.png

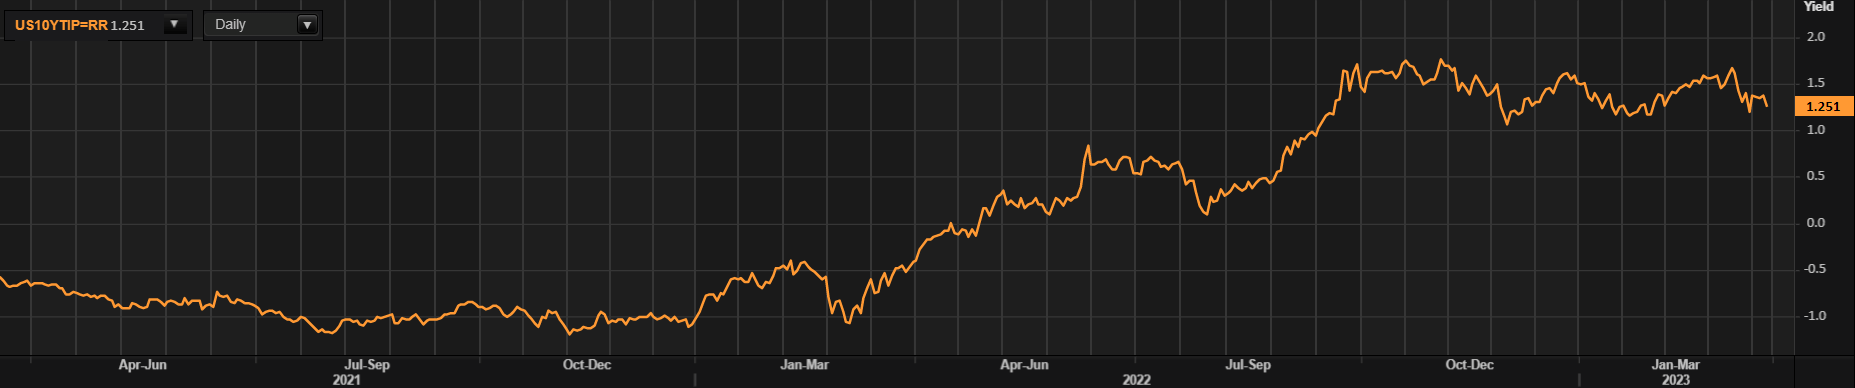
Real yields are perhaps the most influential variable for gold prices bearing in mind that the yellow metal is non-interest bearing and therefore reacts negatively to higher interest rates and US real yields. Since, late 2022, real yields have been constrained between 1% – 1.75% with no real directional bias, but with the recent forward guidance from the Fed, real yields may track lower throughout Q2, leaving gold unyielding to downside stresses.

U.S. 10-YEAR REAL YIELD

image5.png