China holds lending benchmarks for 6th month, but more easing seen

China holds lending benchmarks for 6th month, but more easing seen

SHANGHAI : China kept its benchmark lending rates unchanged for a sixth straight month in February, as expected, with the world’s second-largest economy showing more signs of recovery from a pandemic-induced slump.

A clutch of better-than-expected data recently suggests economic activity is rebounding as Beijing exited from its stringent zero-COVID strategy in December and shifted to a pro-growth policy stance.

The one-year loan prime rate (LPR) was kept at 3.65 per cent, while the five-year LPR was unchanged at 4.30 per cent.

“We expect the PBOC to stay accommodative in the first half of this year, but only through liquidity-related actions, not rate cuts,” analysts at Barclays said in a note.

“Unlike the U.S. and EU, China remains the outlier on monetary policy, with still benign inflation and recovering but still weak activity creating room for the PBOC to remain accommodative in the first half.”

In a poll of 27 market watchers, 21, or 78 per cent of all participants, predicted no change to either rate.

New bank loans in China jumped more than expected to a record 4.9 trillion yuan in January as the central bank looks to kick-start recovery while new home prices rose for the first time in a year, as Beijing stepped up support for the property sector that accounts for a quarter of the domestic economy.

Market participants also said the LPR decision was within expectations, as the People’s Bank of China (PBOC) ramped up medium-term liquidity injections, rolling over maturing policy loans last week while keeping the interest rate unchanged.

The medium-term lending facility (MLF) rate serves as a guide to the LPR and markets mostly use the medium-term rate as a precursor to any changes to the lending benchmarks.

In spite of recovering momentum, some analysts expect rates will ease after China’s annual parliamentary gathering in March, when the government announces key growth targets for the year.

“We think the PBOC may cut the MLF rate and banks will subsequently reduce the LPRs as early as March following the annual session of the National People’s Congress which is scheduled to begin on March 5,” said Tommy Wu, senior economist at Commerzbank.

“Macro policy stimulus will likely be announced during the annual session, and it will be a good timing for the PBOC to cut rates and signal that it stands ready to support the economic recovery.”

Tommy Xie, head of Greater China research at OCBC Bank, agreed rates would likely be cut in the coming months.

“Easing monetary policy is likely to work hand in hand with the expansionary fiscal policy in the face of weak domestic demand. A lower interest rate will help minimise the cost of the issuance of government bonds,” Xie said, adding that lower mortgage rate could also help defuse systemic risk.

The LPR, which banks normally charge their best clients, is set by 18 designated commercial banks who submit proposed rates to the central bank every month.

Most new and outstanding loans in China are based on the one-year LPR, while the five-year rate influences the pricing of mortgages. China last cut both rates in August to boost the economy.

Hoping For an Early Fed Pivot Does Not Mean We Will Get One

Hoping For an Early Fed Pivot Does Not Mean We Will Get One

Every economic age has its dominant phrase. Think of the ‘irrational exuberance’ which then-Federal Reserve Chair Alan Greenspan fretted about during the 1990’s dot-com bubble. If that’s too far back for you, what about European Central Bank chief Mario Draghi in 2012 promising skeptical markets that he’d do ‘whatever it takes’ to save the Euro?

The buzzword of this inflation-ravaged era is more succinct. In fact, it’s just one word – ‘pivot.’

For our purposes it means the point at which the United States Federal Reserve will feel it can stop raising interest rates and begin to offer the possibility that they could start to go down.

image1.pngIt’s easy to see why that word dominates. 2022 brought, among other dark things, interest rate rises unprecedented in the working lives of many people now engaged with financial markets. The US central bank has hit the monetary brakes no fewer than seven times, pushing the benchmark rate up to a target range of 4.25-4.5%. That’s the highest rate in fifteen years. Moreover, while there are clear rhetorical signs that the Fed is now more cautious about raising rates than it was back in the summer, there are equally clear signals that borrowing costs will go higher yet and that it may not top out below 5%.

Given that the Fed Funds rate spent much of the time between 2009 and 2021 barely above zero, the scale of the turnaround has been astonishing.

And given that so many market participants cut their teeth in a long era of docile inflation, cheap money and ever-flowing credit, it’s no wonder that so many should be keen that the Fed does indeed pivot as soon as possible. The thing about Golden Ages is that people always want them back.

But that doesn’t mean they come back. Of course, the key to whether or not the Fed will, in fact, pivot, will be found in the inflation data. And the picture there is still very unclear.

Boosted by a number of factors, from the war in Ukraine through to Covid’s supply-chain havoc and a general rethink of the previously dominant trend toward ever-more globalization, prices surged in 2022 by measures not seen for fully 40 years. The US was not alone in facing this gale, of course. Other countries did so too, and some had it a lot worse. Inflation has run hotter in Europe thanks among other factors to its energy dependence on Russia.

Even Japan has seen a resurgence of pricing power, where inflation has been thought dead for decades.


image2.pngBut the US still runs the table, and it’s the success of the US response which will matter most. And there are some encouraging signs. The Fed’s preferred measure of inflation continued to slacken in November, providing another indicator that price pressures may indeed have peaked earlier in the year.

The Personal Consumption Expenditures price index, or PCE, rose 5.5% on the year, well below the 6.1% rise seen just a month earlier. The core measure, which cuts out the volatile effects of food and energy costs, was up by a more reassuring 4.7% annualized. Both readings were at their lowest since October 2021.

The release chimes with official Consumer Price Index data for the same month, which showed a similar slackening.

Nevertheless, price rises there still stand at 7.1%, which is a very long way indeed from the 2% rate targeted by the Fed. Moreover, the US central bank’s mandate is to promote stable prices and maximum employment. There may not be many active in the markets today who remember the inflationary pressures of the 1970s and early 1980s. However, there will be many in the Fed who do remember them, and how hard-won the victory was. The monetarist students at the US central bank will be only too aware that they can’t afford to end the rate rising process until inflation – and as importantly, inflation expectations – have been actually and obviously seen to be crushed.

Hence, we see things like stocks falling despite robust Gross Domestic Product numbers. Investors are seeing everything through the inflation prism, and any sign that the Fed’s action has yet to clearly cool economic activity just has investors ever-more convinced that the pivot is not here yet.

5.5% inflation may be better than 6.1%, but it’s still outrunning the Fed’s target by a huge amount, and there’s simply no way policymakers are going to stop fighting while that’s the case. Chair Jerome Powell and the rest of the Open Market Committee well know that their success in getting inflation down will define their time.

Many commentators think we might get very close to pivot territory by the late spring of next year, but in truth we’d probably have to see a marked moderation in wage momentum and, probably, employment growth. Both have remained surprisingly strong despite the Fed’s actions.

Inflation also has a nasty tendency to get sticky. Faced with rising prices, employees demand higher wages, which only add to cost pressures at a time when there’s usually little option but to pass these on again to consumers. And so on…

The upshot of all this is that it could yet be a very long time before the Fed actually does ‘pivot,’ and any prognosis that such a thing could happen in the early part of 2023 depends on evidence of a pretty rapid economic slowdown coming soon. If the economic data don’t start to support this thesis unambiguously in the early months of the year, then the waiting for the pivot could prove a much longer game than many in the markets now hope it’ll be.

One year since Russia’s invasion – Europe faces three changes as it settles into new reality

One year since Russia’s invasion – Europe faces three changes as it settles into new reality

A reality check for Europe

When Russia started its invasion of Ukraine in the early hours of Feb 24th last year, the European security order changed overnight. Media outlets showed dark images of burning buildings in Kyiv, providing a very unpleasant reminder for Europeans that a military conflict is not only a thing of the past.

Wars, as distant as they have been to an average European for long, cause massive losses on human capital. Since the start of the war, more than 7,000 Ukrainian civilians have lost their lives and more than 11,000 have been injured. The war has displaced more than 14 million people. The people who are now deceased, injured, displaced or mobilised could have been productive, both for the private sector and for their country. Some of them will of course build a new life and start to work elsewhere but it will take time.

Despite the discomfort a war brings, it is also a healthy reminder. All conflicts cause massive human suffering and economic losses, but the ramifications from conflicts do not respect country borders. According to the IMF, Ukraine is estimated to have lost at least one-third of its GDP last year, while the OECD has estimated total costs from the war at USD 2.8 trillion in lost output for the global economy. That is more than ten times the size of the Ukrainian economy.

Rethinking our economic model

The losses for the global economy mostly come from higher energy and food prices, as well as disrupted supply chains. Europe now grapples with an acute energy crisis that could last for years. Before the war, 25% of the EU’s imported petroleum and 39% of the natural gas originated from Russia. By the third quarter of 2022, these shares had fallen to 14% and 15% respectively. After the EU imports ban on Russian oil entered into force in December 2022, this share has shrunk even further.

For decades, many European countries fostered close economic ties with Russia, and industries in many large European countries relied on cheap, fossil energy from Russia. The war has forced Europe to rethink; it has triggered a race to build more emission-free energy production capacity, not only in Europe but globally. The European Commission now plans an additional investment of EUR 210 billion on energy independence and security by 2027. Cutting Russian fossil fuel imports should save an additional EUR 100bn.

Dollar’s Friday Breakout Potential: EURUSD, GBPUSD, AUDUSD and USDJPY

Dollar’s Friday Breakout Potential: EURUSD, GBPUSD, AUDUSD and USDJPY

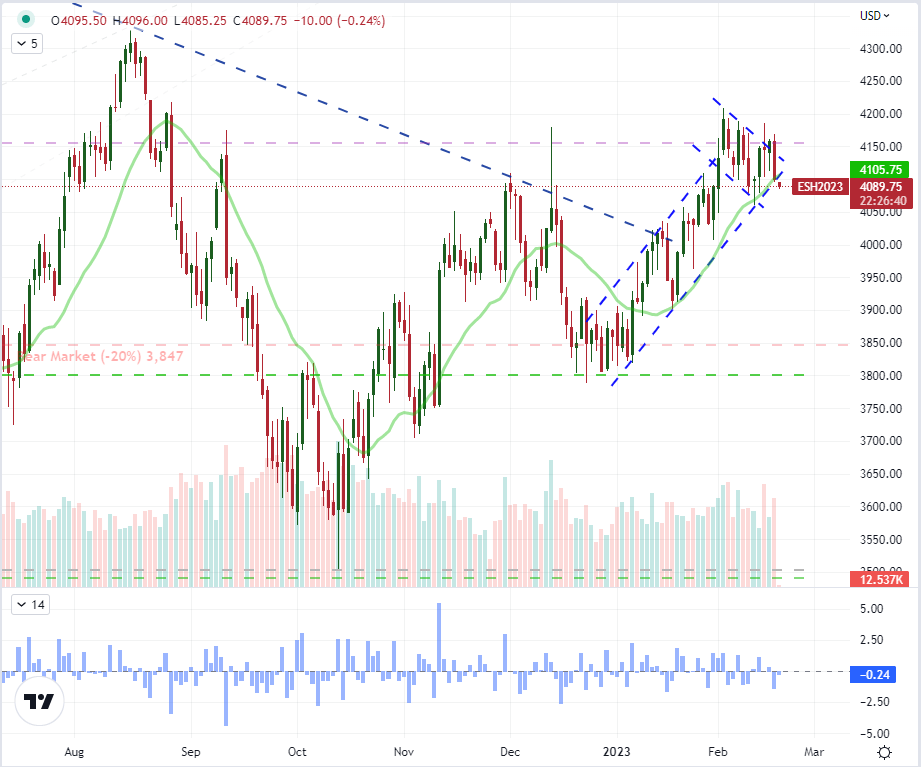
We are approaching the weekend and there is the added anticipation surrounding the extended holiday liquidity drain through Monday in US markets. Normally, this would be an occasion for the markets to simply settle into established ranges and allow any short-term premium in implied volatility gauges to simply bleed off. However, it wasn’t so long ago that we witnessed critical technical developments occur just before weekend drains which left the markets to dwell on speculative intent over entire weekends only to pick the thread back up the next week. What is the probability that we are facing yet another one of these outlier events this go around? Typically, I would say that congestion on measures like the S&P 500 (channel and wedge) or Dow Jones Industrial Average (horizontal range and triangle) are readily observed patterns and the VIX still in the lower 10th percentile of its past year’s range is presents a higher probability of the ‘path of least resistance’ outcome. On the other hand, there is some provocative testing on the charts – such as the S&P 500 emini futures slipping the 20-day simple moving average and channel floor pre-Tokyo trade. What’s more, the difference between scenarios carries potentially dramatically different tempos should a charge of fear show up versus a quiet settling into uncomfortable chop in bulls’ favor to end the week.

of clients are net short.
Change in Longs Shorts OI
Daily 13% -9% -1%
Weekly -8% 6% -1%
What does it mean for price action?
Get My Guide

Chart of S&P 500 Emini Futures with 20-day SMA, Volume and 1-Day Rate of Change (Daily)

image1.png

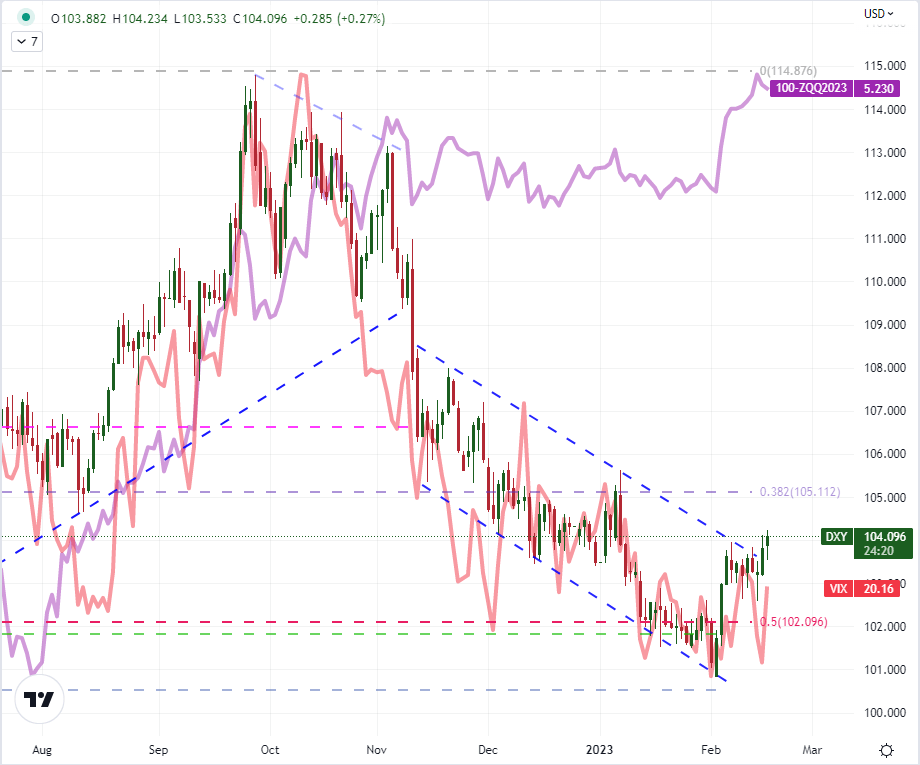
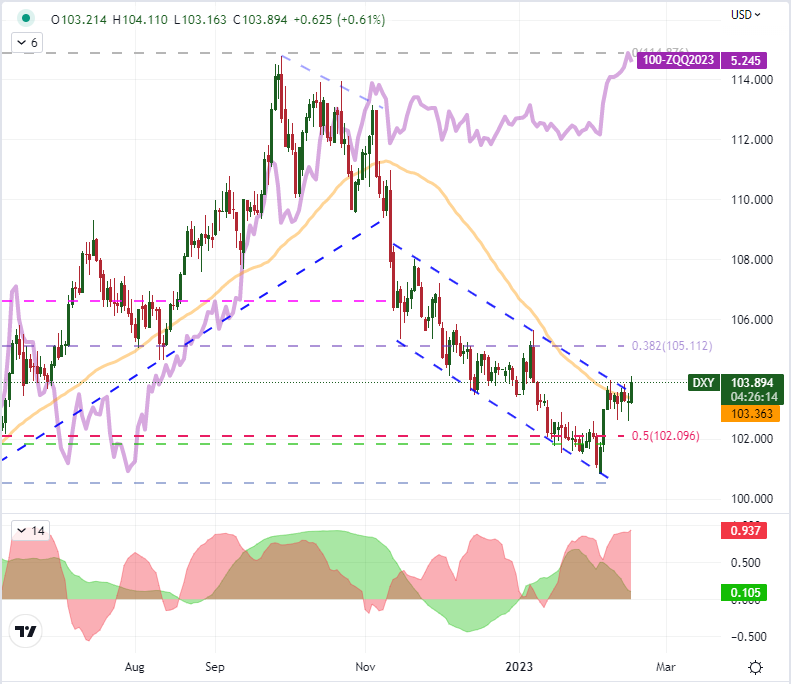
While many traders have their favorite ‘risk asset’ there tends to be far less interest in go-to safe havens. In a world that seems to promote ‘long only’ perspective with shares trading representing the most common market exposure for investors over the past century, that isn’t too surprising. However, the market movements in a ‘risk off’ scenario are far more aggressive than the typical advance. While there are assets like gold, Treasuries, money markets and others that are referenced in textbooks; the Dollar is perhaps my preferred haven asset of the moment given its ultimate liquidity and its greater current sensitivity to downdrafts in speculative assets. We’ve seen the recent swell in the DXY Dollar Index has drawn more from the fresh lift given to Fed rate expectations, but the upside on the market’s hawkish view will likely be very restricted going forward with large gaps between official updates. Alternatively, sentiment is flippant and can explode ‘out of the blue’. Should the S&P 500 bite on its tentative break during Friday exchange hours, it will likely in turn charge the VIX and give a more capable push for the Greenback.

Chart of DXY Dollar Index Overlaid with Implied Fed Funds Aug 2023 Rate, 20 and 60-Day Correl (Daily)

image2.png

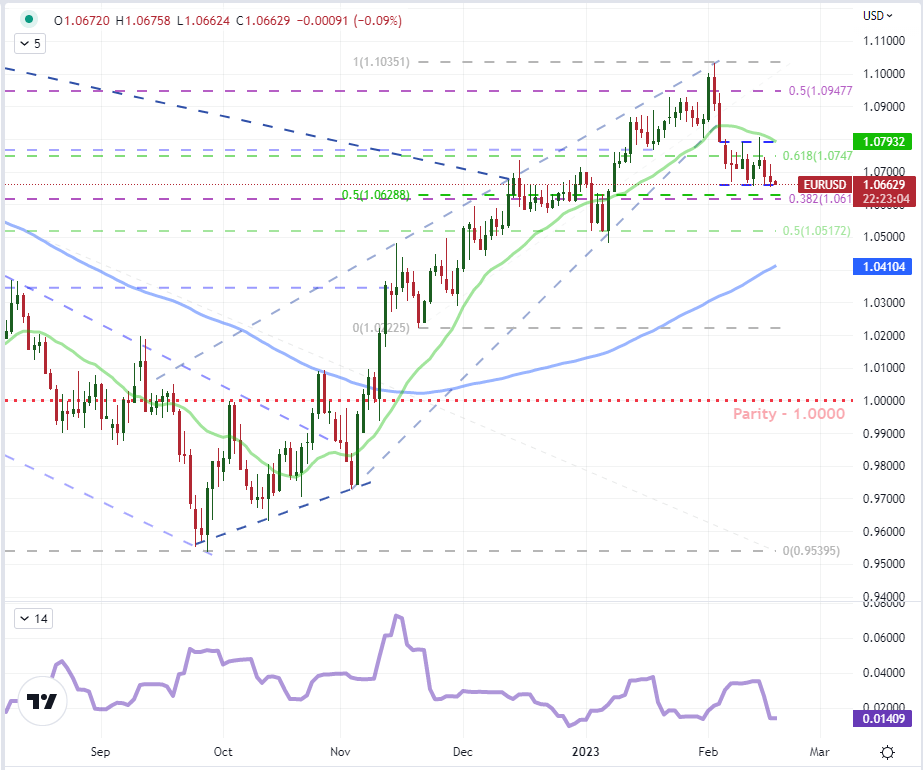
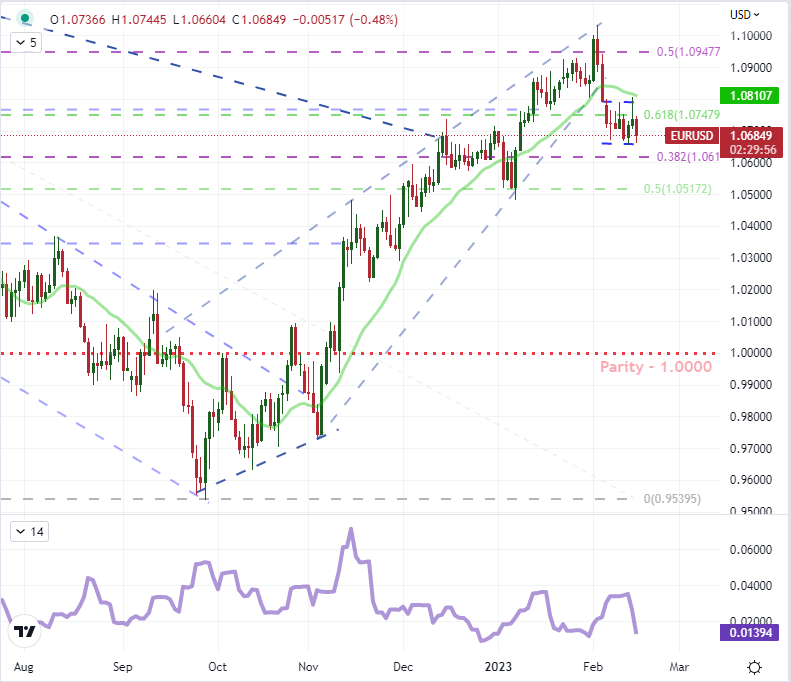
The DXY Index can be a good reference for the currency’s health, but it isn’t what most active FX traders are monitoring for making their calls on momentum. USDJPY has been of greater interest to me for this reason, and the break above 133 earlier this week was noteworthy, but a single pair – even a liquid one such as this – will not define the Dollar overall. Yet, if we see more of the ‘majors’ conform to a broader USD bid; the potential for a productive follow through will rise substantially. First and foremost, my attention is on EURUSD. The most liquid currency pair in the world bar none, we have a series of lower lows that has kept the pressure on the lower bound (roughly 1.0650) of the past two weeks. There is more technical support below this (a cluster of Fibs), but more breaks could see more capable momentum.

Chart of EURUSD with 20 and 100-Day SMAs, 10-Day Historical Range (Daily)

image3.png

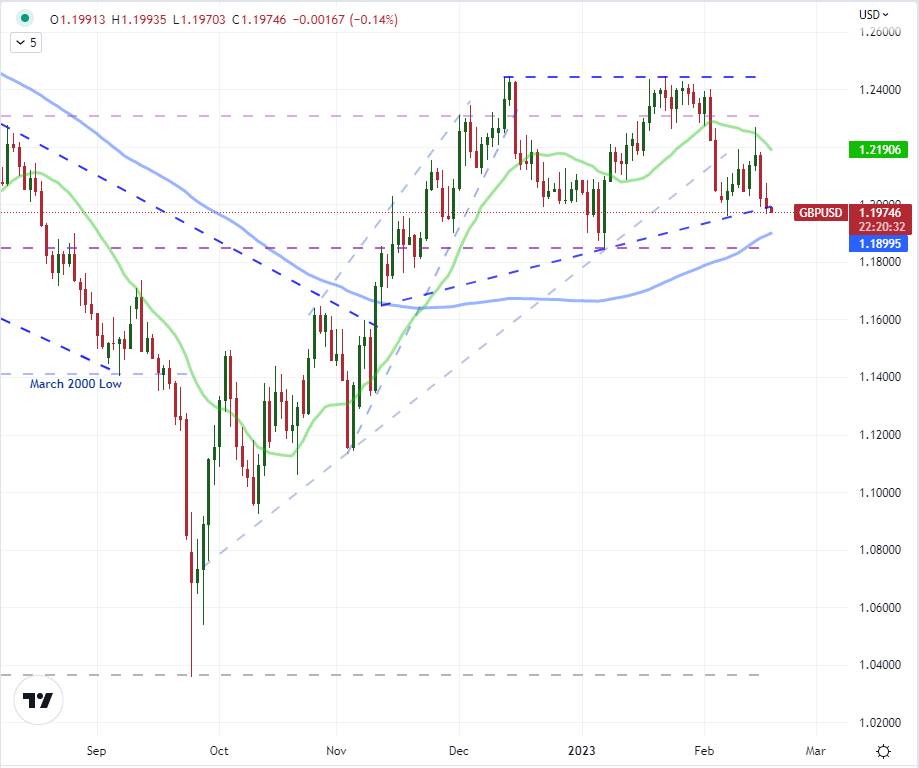
In a similar position to EURUSD, GBPUSD is entering Friday threatening a break of three-month rising triangle’s support. My trendline was at 1.2000, but the specific technical ray matters less than the build up of traction towards more bearish progress. It was remarkable that the added pressure of the UK inflation earlier this week – which sent many other Sterling crosses into significant movement – was curbed for the Sterling. If we take out the February low here and then move on to the 100-day SMA, it could generate a lot of heat in the broader view of the Dollar.

Chart of GBPUSD with 20 and 100-Day SMAs (Daily)

image4.png

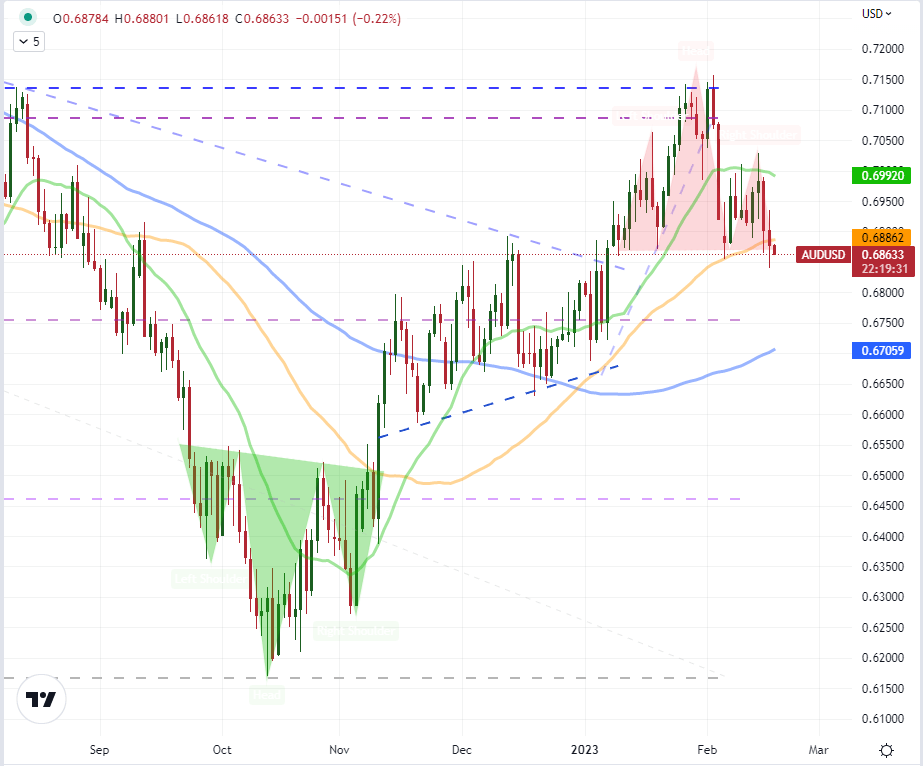
Much further down on the Bank for International Settlements’ (BIS) liquidity scale to EURUSD, USDJPY and GBPUSD is AUDUSD. This is not the type of cross that would singlehandedly motivate a commitment from the world’s largest currency. Yet, I’m not looking for a leader in this instance because conditions are not simply looking for a fundamental or technical catalyst. What we are seeking is breadth in the Dollar’s move to overcome a liquidity restriction. As such, a break of the head-and-shoulders pattern here would add considerable weight to a productive Dollar end to the week.

Chart of AUDUSD with 20, 50 and 100-Day SMAs (Daily)

image5.png

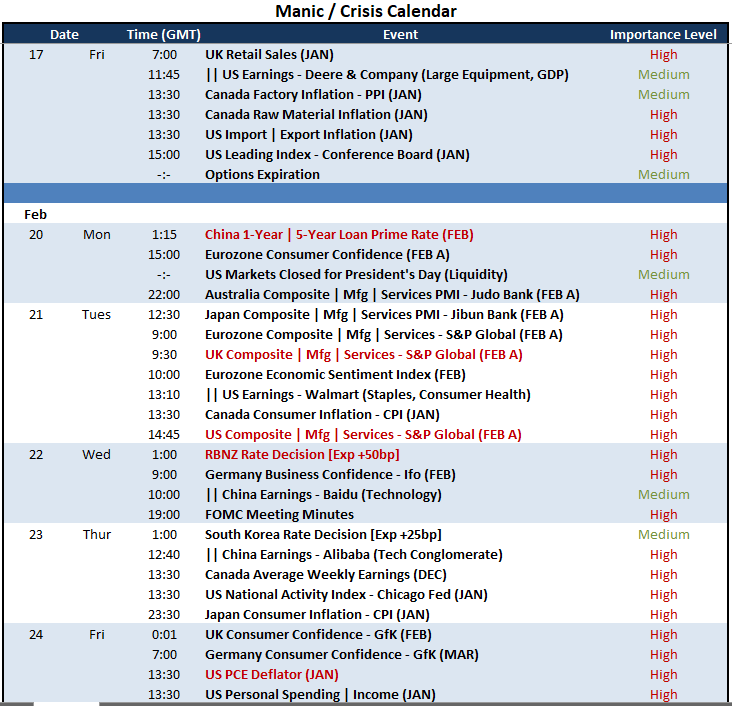
For event risk, I believe that any volatility from the market would come first and the listings we have Friday would be used as justification after the fact – this is why its important not to commit to the dogma of any one single analysis type. Nevertheless, I think US import inflation could speak to monetary policy while the Conference Board’s leading index has stood out as a ‘recession’ signal recently. The Pound will also have UK retail sales while the Loonie will pick up on upstream inflation. Then there is also the options expiration which can frequently cause distortion in ‘the roll’.

Top Global Macro Economic Event Risk for Friday and Next Week

image6.png

US Dollar Bumped Higher by Hawkish Fed and Blistering PPI. Higher USD?

US Dollar Bumped Higher by Hawkish Fed and Blistering PPI. Higher USD?

The US Dollar jumped higher overnight after two Federal Reserve speakers talked up the prospect of 50 basis point hikes and a business inflation gauge re-accelerated.

Cleveland Fed President Loretta Mester and St. Louis Fed President James Bullard both indicated that they would consider a 50 bp lift of the Fed funds target rate at the meeting in late March.

Both board members previously made their hawkish stance well known. The swaps and futures markets have priced in only 25 bp at the next two meetings.

The producer price index (PPI) data came in hot for January at 0.7% month-on-month, above the 0.4% anticipated and -0.5% previously. This gave an annual print of 6.0% year-on-year, surpassing the 5.4% forecast.

Similarly, the core measure also picked up steam, with PPI ex-food and energy increasing by 0.5% last month against 0.3% expected and 0.1% prior. The heat in the PPI numbers comes on the heels of CPI data seen earlier in the week that also re-accelerated in January.

Housing starts and building permits were a slight miss, coming in at 1309k and 1339k respectively for January. Initial jobless claims were slightly less at 194k for the week ending February 11th, while continuing claims were in line with expectations at 1696k for the week ending February 4th.

The solid data saw Treasury yields once again move higher across all tenures with the back end seeing the most gains. This saw the closely watched 2s 10s yield differential contract to -0.78% after trading at -0.88% this week, a level not seen since the early 1980s.

The higher yields appeared to underpin the greenback as it made six-week highs in EUR/USD, USD/JPY, GBP/USD, AUD/USD and NZD/USD, as well as the DXY index.

Later today we will hear from Richmond Fed President Thomas Barkin and Federal Reserve Governor Michelle Bowman. The degree of their hawkishness will be closely scrutinised by the market and could move the ‘big dollar’.

DXY, (USD) INDEX, 2-YEAR AND 10-YEAR TRESUTIES AND 2s 10s CURVE

image1.png


Momentum Slowing as the UK FTSE Index Scales to New Highs

Momentum Slowing as the UK FTSE Index Scales to New Highs

There is more evidence that upward momentum is slowing as the UK FTSE 100 index scales to record highs, raising the prospect of a pause / minor retreat in the rally.

To be sure, there is no sign of reversal – indeed higher highs on the daily charts imply that the trend is still up. However, the higher highs are getting registered on slowing momentum suggesting buyer fatigue could be setting in given the extent and the pace of the rise over the past few months (see the daily chart). This is especially so as the index is testing quite a tough hurdle, including the upper edge of a rising channel from 2003 (now at about 8350), slightly above the 2018 high of 7903 (see the monthly chart).

FTSE INDEX Daily Chart

Unless the index stops making new highs, the path of least resistance could still be up. In other words, at the very least, the index needs to stop making new highs for any consolidation to take place. Moreover, any consolidation may not necessarily imply a reversal of the uptrend – the FTSE 100 index could well go sideways.

In this regard, there is plenty of support on the downside that could restrict any potential pullback. The initial cushion is at the January high of 7875, followed by the end-January low of 7708, near an uptrend line from October. Stronger support is on the 200-day moving average, roughly coinciding with the lower edge of the Ichimoku cloud.

image2.JPG

Source Data: Bloomberg; Chart Created by Manish Jaradi Using Python.

As noted in the previous update, technical and breadth market indicators suggest there is scope for a further rise in UK equities in the coming weeks/months. There is more evidence from breadth market indicators recently supporting an optimistic outlook.

As of Thursday, 87% of the members in the UK FTSE 100 index were above their respective 30-week moving averages (WMA), not too far from 90% a week ago. Data from 2002 onwards suggests that when 88%-94% of the members were above their respective 30-WMAs, the index has been up 63% of the time over the subsequent 90 days (the distribution plot on the right panel). In addition, last week, 46% of the members were at new 8-week highs. In cases where 40%-46% of the members stage new 8-week highs, the index has been up 60% of the time over the subsequent 3 months (the distribution plot on the left panel).

FTSE INDEX Monthly Chart

image3.png

Looking beyond the near term, from a multi-week perspective, a potential bullish reverse head & shoulders pattern (the left shoulder at the 2018 low, the head at the 2020 low, and the right shoulder at the 2022 low) suggests any consolidation could be short-lived (see weekly chart).

What Past Global Recessions Can Teach Us About the Next One

What Past Global Recessions Can Teach Us About the Next One

The global economy is ‘perilously close’ to falling into recession according to the World Bank’s latest forecast.

It now predicts world economic growth of 1.7% this year, a steep climbdown indeed from the 3% hoped for back in June. As for why, well, take your gloomy pick. Top of the list we find Russia’s invasion of Ukraine, of course. But inflation, higher interest rates, Covid-related supply chain problems and a dialing-back of the globalization trend previously dominant for decades all feature malevolently.

If the World Bank is proved correct, we’re staring down the barrel of the feeblest global growth since 1991, apart from 2009 and 2020. And those are years with world recessions of their own to their names, thanks – respectively – to a global financial crisis and Covid.

Moreover, if 2023 joins the list, it will also be the first time since the 1930s that there’ll have been two world recessions in a single decade. The 1920s may have roared. On current evidence the 2020s will be lucky to get away with merely whimpering. Barclays Capital analysts are reportedly warning that 2023 will see the worst global economic conditions in forty years.

Developed Market Slowdown Is an Ominous Sign

Worryingly, we have seen growth in the world’s richest economies slow down sharply. It was around 2.5% overall in 2022. This year it may limp in at 0.5%. Maybe. For more than twenty years, crashes like that have foreshadowed a global recession.

But how exactly are these recessions defined, and what if anything can we learn from those which have gone before?

For the purposes of this article, we’ll focus on recession in the modern, industrial era. Doubtless historians have made elegant, educated guesses as to the global hit forced on humanity by ice ages, the Fall of Rome, and any number of historically distant calamities. We’ll leave those to them.
What Exactly Is a Global Recession?

The generally accepted definition of a national recession hinges on those ‘two successive quarters of negative growth’ that are so terrifying to politicians everywhere. Unfortunately, a global recession can’t be quite so narrowly defined, or indeed so readily felt. It’s likely that few economic agents in a country hit by recession will be totally immune from it. However, a global recession won’t hit all countries equally, and a national recession need not happen when a global one does. For example, five acknowledged global recessions since 1950 had an echo in the United States. But the US also had an extra one in the same period.

So, how do we define a global recession?

Well, the International Monetary Fund has said in the past that an annual world-total Gross Domestic Product (GDP) growth rate of less than 3% would qualify. Perhaps a more nuanced definition, and perhaps a more widely accepted one, is a period in which world per-capita GDP is seen to decline.

By this measure there have been 14 global recessions since 1870, and five since the end of World War 2 in 1945. As for what we might learn, well, the most recent – those of 2009 and 2020 – had their roots in very specific “one-off” causes. The first was triggered by the collapse of the US subprime mortgage markets. The subsequent banking Armageddon came about thanks to a long and catastrophic under-estimation of financial risk which too many in the sector were, wrongly, incentivized to permit. The second was a direct result of the astonishingly rapid spread of Covid-19 and the measures taken worldwide to defeat the virus.

Still, all global recessions have their specific, proximate causes. These are extremely difficult to predict before the fact, making overall lessons commensurately tough to draw. The world recessions of 1975 and 1979 were triggered by oil price shocks, and high energy costs were still ravaging the global economy into 1982 when another recession hit. 1991’s version had its roots in a US credit crunch, the first Gulf War and the disintegration of the Soviet Union.

That said, many of them are started by price rises, whether they are caused by an increase in the cost of an essential commodity or for some other reason. In developed, monetarist economies, a rise in inflation is almost bound to lead to higher borrowing costs. Central banks are, after all, mandated to keep inflation in check. The problem is that, while that very system involves slowing the economy, when recession threatens, the trick of containing price growth without inflicting much more severe economic damage than necessary becomes far harder.

A very long period of docile inflation and essentially negligible borrowing costs has served to blunt memories of how difficult that balance is to strike. And that’s a shame because the chances of fighting inflation and avoiding at very least a string of damaging national recessions seems to be fading.

Central Banks Walk a Dangerous Line

Politicians from the Eurozone, UK and US are already pleading with central banks to go easy on the pace of interest rate rises, as thought that hadn’t occurred to the central banks themselves. However, while inflation remains above target as it does, independent monetary authorities will argue that they are mandated to ignore these pleas and keep borrowing costs high.

And there are at least six factors common to all global recessions. We see both rising unemployment and decreasing wages. That’s a toxic combination for both wage earners and politicians, so political instability tends to rise. In the financial world, investment gets deferred or abandoned entirely while asset prices deteriorate, weakening even if they don’t fall sharply. Default rates rise, hollowing out weaker financial sectors and hitting even the strongest. Credit becomes extremely hard to get. This last factor is likely to be a huge problem for a generation of market participants who don’t recall it being anything other than easy.

So, is there any light in all this darkness? Well, one small crumb of comfort can be found in the fact that, while the world may be close to recession, it’s not there yet. While there seems little chance of peace in Ukraine anytime soon, the situation there is fluid and a meaningful cessation of hostilities would surely do much to take the edge of current, gloomy forecasts.

Even if it doesn’t, recessions do tend to be mercifully short-lived things compared to phases of expansion. The average length of one is about eleven months.


Gold Prices Remain Vulnerable Amid Hawkish Fedspeak and Further Hike Odds

Gold Prices Remain Vulnerable Amid Hawkish Fedspeak and Further Hike Odds

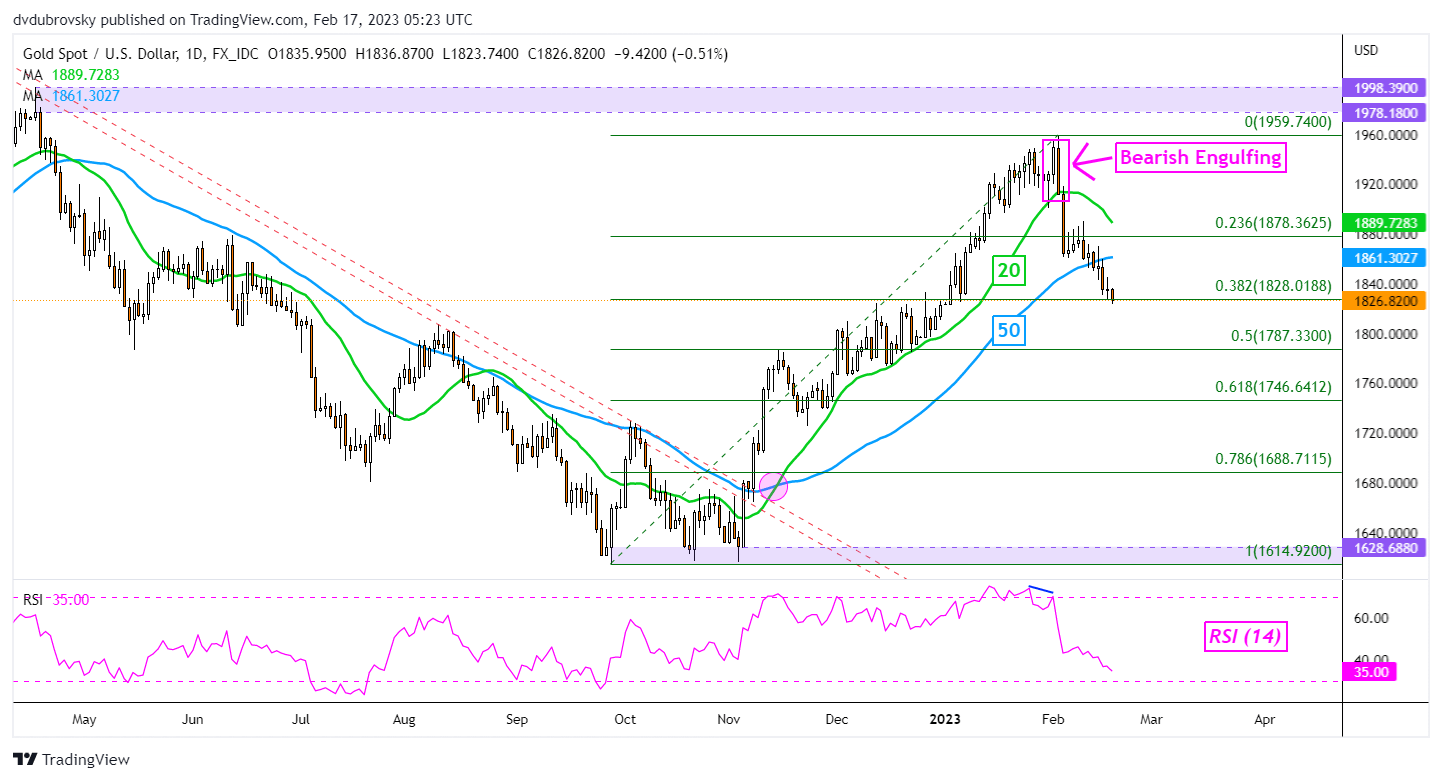
Gold prices were little changed by the end of Thursday’s trading session, but the yellow metal extend its recent losing streak during Friday’s Asia-Pacific trading session. The anti-fiat yellow metal is now on course to sink over 2 percent this week. In fact, the 5.25% drop so far in February is shaping up to be the worst month since June 2021.

This week in particular, prices have been wobbly since the aftermath of Tuesday’s US inflation report. For January, the country saw unexpectedly higher CPI data, opening the door to a still-hawkish Federal Reserve. The reason why this matters is that markets have been slowly unwinding expectations of a rate cut pivot towards the end of this year.

On Thursday, risk aversion struck Wall Street. It was revealed that two Fed policymakers, Loretta Mester and James Bullard – presidents of the Cleveland and St. Louis branches, respectively – were still open to another round of 50-basis point rate hikes. As a result, markets continued selling Treasury yields as bond prices dipped and yields rose. The 10-year rate has breached notable technical levels and faces resistance.

Heading into the remaining 24 hours, the economic docket notably dies down before the weekend starts. Federal Reserve Bank of Richmond President Thomas Barkin is making a speech at 13:30 GMT. If he reiterates similar hawkish rhetoric from other policymakers, gold could experience quite a volatility day as markets continue to align themselves with the reality the central bank is trying to project.

XAU/USD Daily Chart

XAU/USD continues to decline after confirming a breakout under the 20- and 50-day Simple Moving Averages (SMA). That is setting up prices for further losses as the 38.2% Fibonacci retracement level at 1828 is being tested. Falling under the latter exposes the midpoint at 1787. Otherwise, a turn higher has immediate support as the 50-day SMA.

XAU/USD Daily Chart


Japan’s Trade Deficit Smashes Record Amid Global Slowdown

Japan’s Trade Deficit Smashes Record Amid Global Slowdown

Japan’s trade deficit surged to a record in January, as one-off factors including the lunar new year holidays dragged on exports amid a backdrop of a slowing global economy.

The trade gap jumped to ¥3.5 trillion ($26.1 billion) from ¥1.45 trillion in December, topping ¥3 trillion for the first time in comparable data going back the late 1970s, the finance ministry reported Thursday. The deficit far exceeded the previous record, although it was smaller than analysts’ estimates.

Export growth slowed sharply to 3.5%, with chip-making equipment among the largest drags, in a sign of weakening global tech-sector demand. The value of shipments to China sank 17.1%, dragged down by cars, auto parts and chip machinery. Exports to the US and Europe also grew at a weaker pace of 10.2% and 9.5% respectively.

Imports meanwhile continued to show double-digit gains with a 17.8% increase from a year ago, as costly energy shipments continued to inflate the import bill. Japanese firms also likely tried to secure inventory from China before lunar new year celebrations.

The record deficit casts a cloud over Japan’s economy, as it struggles for recovery momentum with a new Bank of Japan governor set to take over from Haruhiko Kuroda and his decade of monetary easing. While one-off factors contributed to the deficit, the government and the central bank will need to keep a close eye on how much growth is slowing abroad.

“Japan’s exports are unlikely to show a strong pickup so the overall economy will probably continue to have a lackluster recovery,” said Takeshi Minami, chief economist at Norinchukin Research Institute. “That will be a headache for the BOJ when they consider normalization.”

China’s sudden turnaround on its virus policy has also meant a hit to Japan’s exports, as Covid cases surged following the end of China’s Covid-Zero policy, causing disruption across the country. Shipments to China and other Asian countries account for more than 50% of Japan’s overall exports.

What Bloomberg Economics Says…

“Looking ahead, we expect the trade deficit to narrow sharply in February, driven by a year-on-year jump in exports. The average of the shortfalls in January and February, though, will probably be on par with the deficit in December 2022.”

— Yuki Masujima, economist

For the full report, click here

The data also showed that the average exchange rate last month was 132.08 yen to the dollar, 15% weaker than a year earlier. Although the weaker yen and higher oil prices — the two main factors behind the prolonged trade deficit — have faded compared to last year’s peak, their effects still appear to be lingering.

Another round of expanding import bills may trigger further price hikes. Nationwide inflation reached a 41-year high in December, as companies, especially food manufacturers, passed higher costs onto their products. Accelerating inflation has eaten into consumers’ purchasing power, a trend reflected in household spending’s second straight month of declines in December.

“What’s not certain is how quickly the deficit will shrink as the global economy is expected to slow further from here,” said Norinchukin’s Minami. “There’s less pessimism emerging over the global economic outlook, but I would say the effect of a rapid tighteing by central banks will hit harder in the coming months.”

Dollar Breaks Higher While Dow Holds its Range: Which Move Metabolizes?

Dollar Breaks Higher While Dow Holds its Range: Which Move Metabolizes?

There were two speeds among the dominant market measures I tend to monitor on the global macro spectrum. For much of the market, there was reticence that would fold before major technical boundaries were truly tested. And for a small segment of the financial spectrum, there were some action-oriented breaks. The most prominent technical development on my radar was from the US Dollar. The DXY Dollar Index advanced a fairly modest 0.6 percent Wednesday, but that progress would come at the expense of the descending trend channel resistance that has developed since the high on November 11th (the day after the pivotal October CPI release) was put into place. The break from the past six-day horizontal congestion was a little more ambiguous for conviction however. Amongst the ‘majors’ (the most liquid Dollar-based pairs), USDJPY earned its ‘break’ credentials in a 104 pip rally that decisively cleared the 103.00 level founded on a five-week range high and the 38.2 percent Fibonacci retracement of the 2021 to 2022 bull run. As appealing as that picture may be, the trouble starts to arise when we attempt to trace back a fundamental motivation and realize that other majors have yet to second the move for the Greenback.

Chart of DXY Dollar Index Overlaid with Implied Fed Funds Aug 2023 Rate, 20 and 60-Day Correl (Daily)

image1.png

Chart Created on Tradingview Platform

There are a few major fundamental motivation from which the Dollar tends to draw on when generating volatility and trend. Its safe haven status is arguably the most potent driver, but volatility was notable very benign this past session. Alternatively, we have the monetary policy differentials which have been a frequent driver of the FX market over the past year. Here, we have seen a significant build up in US-based rate forecasts these past few weeks first after the NFPs earlier in the month and the slower-than-expected deceleration in CPI this week. That said, the charge in Fed Fund futures implied rates was significant yesterday when the Dollar was landlocked and the jump occurred Wednesday as that pressure ebbed. Looking to other Dollar-based pairs, it seems that USDJPY may be an outlier at the moment – and scenario probabilities tend to favor the majority. A more common picture for the Dollar can be drawn from EURUSD. The world’s most liquid currency pair was lower – in favor of the Dollar – this past session, but it still fell neatly within its 8-day range between 1.0800 and 1.0650. Should this pair mark a break, it could significantly alter the calculus; but holding the lines will exact a strong influence over the benchmark currency.

Chart of EURUSD with 20-Day SMA and 8-Day Historical Range (Daily)

image2.png

Chart Created on Tradingview Platform

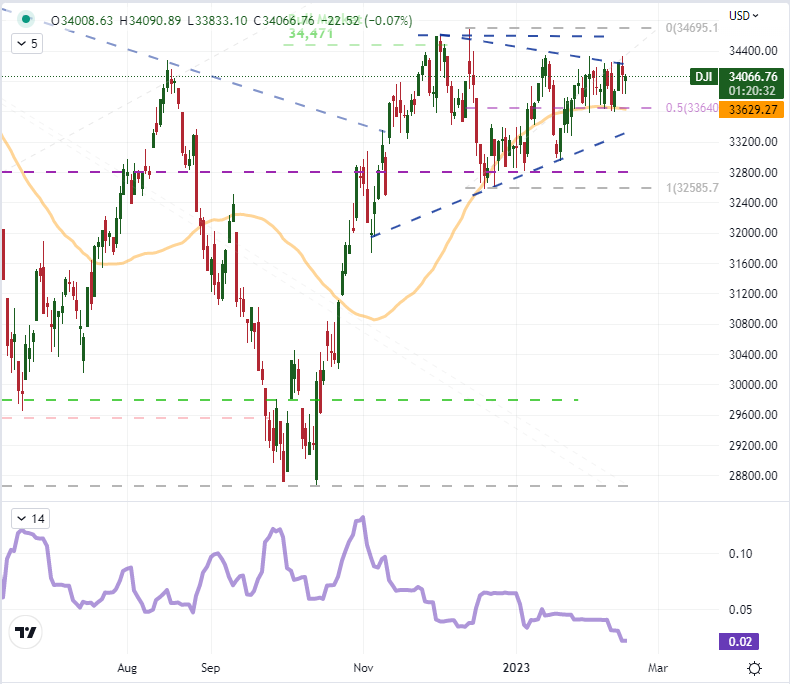
Between the Dollar and the Dow as a model for market tempo, I would have to say that the US equity index seems to better reflect the backdrop. The ‘blue chip’s’ inside day (whereby the range of Wednesday fit neatly within Tuesday’s as a sign of indecision) summed up the picture nicely. There is a much larger congestion pattern that this index has committed to built out of a wedge with the 50-day simple moving average and midpoint of the past three months’ range as support. This has in turn helped build out a 14-day historical range that is the most restrictive trading for the benchmark since September 9, 2021 – before the market made its first notable bearish break of the post-pandemic bull run. A resolution will come eventually, but conviction is necessary for providing real traction for trend development. In the meantime, volatility measures for equities, Treasuries, FX, oil, gold and emerging markets have all noticeably deflated.

of clients are net short.
Change in Longs Shorts OI
Daily -4% 2% 0%
Weekly -5% 3% 0%
What does it mean for price action?
Get My Guide

Chart of Dow with 50-Day SMA and 14-Day Historical Range (Daily)

image3.png

Chart Created on Tradingview Platform

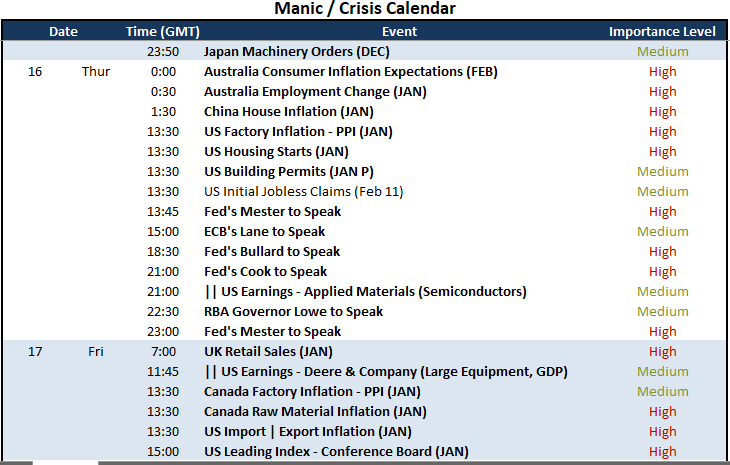
The best remedy for aimless and quiet markets is an acute fundamental spark that can tip a deeper fundamental theme that in turn sets a blaze on speculative conviction – bullish or bearish. Unfortunately, what we have on the docket through the end of the week is not the kind of event risk that I would expect to seriously charge a major regional market or asset class – much less the global macro landscape. While I will take in some modest earnings event risk, the Australia employment data, Chinese housing inflation and UK retail sales; it is the Fed speak that seems to carry the most potential for me. While upstream US inflation (PPI and import) is noteworthy and housing data an important economic conduit at the moment, the central banker rhetoric could tip the scales on rate expectations following the CPI release earlier this week. It is a high bar to truly charge the market, but it is perhaps the most capable ‘known’ update on tap.

Top Global Macro Economic Event Risk for the Next 48 Hours

image4.png