image1.png

Euro Rides High as US Dollar Ponders the Path Ahead with Fed and G-20 in the Frame

The Euro continues to threaten to make a new 3-month peak against the US Dollar as currency markets pause somewhat. This is in the aftermath of last week’s US CPI and while the G-20 in Bali gets underway today.

The Euro was aided by comments from Federal Reserve Vice Chair Lael Brainard overnight.

She hinted that the pace of the Fed’s hiking program might need to slow at some time ‘soon’. At the same time, she also made it clear that there was still some work to do in terms of the Fed’s fight on inflation.

Treasury yields ticked up a few basis points out to 10 years in the US session and they have been steady so far through Asian trade.

The G-20 got underway and the highlight so far has been the apparent cordial comments around US-China relations from both sides.

The meeting yesterday between US President Joe Biden and Chinese leader Xi Jinping led to the positive language used from all parties as tensions appear to be thawing to some degree.

This is the first time the leaders have met while holding the top job of their respective countries. They met several times before when both held the role of Vice President.

An agreed communique from the G-20 is something that observers hadn’t been very confident of achieving going into the meeting, but now it seems possible.

Mainland Chinese and Hong Kong equity indices were buoyed by the prospect of government support for the property sector. The Hang Sang index gained more than 3.5% at one stage, defying some soft economic data.

Chinese year-on-year industrial production came in at 5.0% instead of the 5.3% anticipated to the end of October. Retail sales for the same period were -0.5% rather than the 0.7% forecast.

Elsewhere, Japanese seasonally adjusted 3Q quarter-on-quarter GDP came in -0.3% against forecasts of 0.3% and against the 0.9% previously.

Seasonally adjusted annualised quarter-on-quarter GDP to the end of September was -1.2% instead of 1.2% anticipated and 3.5% prior.

After a delayed reaction, USD/JPY had a crack higher after the news, moving above 140.60.

Crude oil slid lower overnight after the Organization of Petroleum Exporting Countries (OPEC) cut their demand forecast for the fourth quarter again.

The WTI futures contract dipped toward US$ 85 bbl while the Brent contract is under US$ 93 bbl. Gold has held onto overnight gains, trading above US$ 1,770 at the time of going to print.

RBA meeting minutes were out today and revealed that the bank considered a 25- or 50-basis point lift in rates at their meeting 2-weeks ago.

They hiked by 25 bp then but going forward they are said that they are prepared to pause or return to large hikes depending on data at the time.

After UK jobs data, there will be EU GDP numbers followed by US PPI.

The full economic calendar can be viewed here.

EUR/USD TECHNICAL ANALYSIS

EUR/USD has been chopping resistance wood this week as it seeks to overcome a series of breakpoints and the August peak at 1.0369. This level may continue to offer resistance.

Further up, the 200-day simple moving average (SMA) could offer resistance at 1.0428.

The recent rally broke above the upper band of the 21-day simple moving average (SMA) based Bollinger Band. A close back inside the band might signal a pause in the bullish run or a potential reversal.

Support could be at the breakpoints at 1.0198, 1.0094 and 1.0090. The latter coincides with the 10-day SMA.

image1.png


Trading Economic Data Means Looking Past the Numbers

Economic Data, Foreign Exchange Trading, Central Banks – Talking Points

  • All fundamental trading strategies are rooted in economic data
  • But reactions to that data can be puzzling, and complex
  • The likely effect of any number on monetary policy is often most important

The foreign exchange market’s reaction to economic data is one of the most important subjects for traders to consider, but also one of the most vexed.

The monthly round of official and private releases from around the world covers everything from inflation and employment to the forward-looking views of corporate purchasing managers. Together with central bank pronouncements, it forms what we might call the framework of foreign exchange trading.

Major Economic Releases Can Dominate Trade

Markets may well hunker down, losing both volume and volatility, in the run-up to an eagerly anticipated number. Official US labor market statistics are perhaps the most obvious example here. When the trading community expects serious gains or crushing losses the session can be subdued from Asia’s open and right across Europe as participants nurse suspicions or hopes. Even when the market expects neither many traders will – in financial journalism’s enervating cliché – “wait and see.”

This makes sense of course, enervating or not. Obviously, there’s a link between the economic performance of a country with a freely floating currency and the performance of that currency against its peers. At the most basic level a strong piece of economic data will boost a currency, a weaker one will tend to see it fall.

However, to take the matter no further would be a grave error. For one thing, individual pieces economic data tend to influence currencies in a very fleeting way. The gains provided by even a blockbuster, expectation-shattering number can be undone by the end of a day’s session, and well before that in some cases. It may even mean no more than a few minutes’ spike one way or another.

So, there’s clearly more to know about data and its effects.

The first and perhaps most important thing is that, while data provide the rhythm, the world moves to a monetarist cadence and central banks will always play lead. So, ultimately, the longer-term effects any piece of economic news must be considered with a view to how it might change monetary policy. No single data release is ever likely to do that, and markets would have caused to worry if it did. Central banks like to be ahead of the numbers, ready to tighten or loosen policy as needed before trends turn.

Therefore, we might see the markets only very briefly cheer strong retail sales, say, or powerful job creation. They might be great for the politicians, but, if inflation remains docile, they might not mean anything at all in terms of central bank policy changes. And if rates aren’t going up or coming down, then the longer-term effect of the data on the currency won’t amount to much.

Of course, these days docile inflation is little more than a happy memory across much of the world as war in Ukraine boosts both food and fuel prices at a time when post-Covid supply chain storms are still raging.

Currencies Can Fall Even When Interest Rates Rise

In July of this year, the United States Federal Reserve delivered a three-quarter point interest rate rise, something which would have been considered extraordinary monetary action for most of the past thirty years. And yet the US Dollar actually lost ground by the end of the session for, in its post-rate-hike remarks, the Fed left markets reasonably sure that future actions were going to be a lot more measured.

So, we can on occasion see the phenomena of a ‘dovish’ rate hike, or even a ‘hawkish’ rate cut. That’s when a central bank takes action but strongly implies that it has finished doing so, or that the barrier to more is extremely high. Higher interest rates have not been terribly helpful to rare-breed Sterling bulls this year either. The United Kingdom’s political and economic turmoil has left the market wondering if its economy can bare higher borrowing costs. The US certainly looks much better placed to do so.

 With all this in mind, merely watching and reacting to pieces of economic news is unlikely to make for a satisfactory trading strategy. Indeed, the Dollar’s broad gains this year have rendered data watching all-but meaningless in many countries. Their currencies have fallen against the Greenback regardless of the numbers as the US currency reveals itself as the ultimate safe-haven play.

Competent traders know where the market is focused and where in the business cycle we are. What that tends to mean in practice is which specific data releases are most likely to trigger changes in the monetary mood music.

These can change dramatically over time. Older readers may well recall the days when western industrial production figures were the ones to watch for the best central bank steer. In more recent times unemployment figures took over. Policymakers were leery of wage inflation and, poised to “withdraw the punchbowl” if the labor market party showed any sign of getting out of hand.

Now of course inflation figures themselves are perhaps the ones which traders look at most obsessively, with prices’ stubborn elevation. One day, the focus will move on again. It always does. But a nuanced approach to trading economic data should remain a constant.

Chinese Industrial Output and Retail Sales Disappoint for October

US Dollar May Rise Against the Chinese Yuan, but USD/CNH First Needs to Find Support

Chinese Yuan Remains Vulnerable to Slowing Global Growth

The US Dollar has been taking a dive against the Chinese Yuan of late. This is leaving USD/CNH heading for its third weekly decline if losses hold until Friday. That would be the worst losing streak since April 2021. On top of this, the pair is down about 4 percent this month, the most since the pair began trading in 2012. Is this the pair’s turning point? Or has USD/CNH overcorrected?

On Tuesday, China released a couple of key economic metrics for October. These included fixed asset investments, industrial production and retail sales. In the image below, all of them disappointed compared to economists’ expectations. In particular, retail sales fell 0.5% y/y versus 1% seen. These were not great and continued to show that certain corners of the country are struggling.

China is a heavily outward-facing economy due to key trading relationships with the rest of the world. As forecasted in my top trading opportunity for the fourth quarter, “as global growth slows (which is the likely scenario going forward), the Chinese Yuan could continue running into trouble.” Perhaps some of this was reflected in Tuesday’s set of data.

For my Q4 top trading opportunity, I used a multiple linear regression model to estimate that USD/CNH might aim towards 7.15 in the coming months. This is based on control variables such as Chinese exports, CPI, retail sales, G20 real GDP and more. Given the latest downturn in USD/CNH, the price dropped below this level. As such, it may be that a turn higher becomes the increasingly likelier outcome down the road.

Chinese Industrial Output and Retail Sales Disappoint for October

Chinese Industrial Output and Retail Sales Disappoint for October

USD/CNH Technical Analysis

Unlike the fundamentals, it might be too soon to call a bullish reversal for USD/CNH from a technical standpoint. The pair has confirmed a breakout under the August rising trendline, which is quite bearish. Prices are fast approaching the early October low at 7.0128 without clear signs of slowing, or a support level reinforcing. The 100-day Simple Moving Average is also nearing. The latter may reinstate the dominant upside focus. Until a clear bullish technical signal is made present, the fundamentals may have to step aside for the time being.

Daily Chart

USD/CNH Technical Analysis

Bear Market Rally or Turning Point (Again)?

A warm thank you to the numerous readers who immediately decided to use the early bird discount and secure their spot for the macro learning journey together in 2023.

As a reminder, in this recent piece I announced that from Jan 1st, 2023 The Macro Compass will graduate from a newsletter to a comprehensive macro platform.
This content will become much more frequent and be enhanced by macro courses, interactive tool, model portfolios and much more.

As a newsletter reader, you can sign up now and get access to TMC services throughout 2023 at a 20% discount using the code ‘‘TMC’’ at checkout – it’s applicable for all tiers.
The offer is valid for another 17 days and there are ~1,200 spots left.
Check out the website and available products here.


Do you remember July?
Here we are again: left to assess whether we are looking at a bear market rally or a sustainable turning point for the stock market.

Last week’s softer than expected inflation print spurred a massive rally across asset classes: the 60-40 portfolio posted one of its strongest 2-day performances ever, precious metals zoomed higher while the US Dollar took a beating.

The magnitude of the market reaction was exacerbated by technical reasons we will discuss, but to assess medium-term implications we need to break down the CPI report and take a broader look at the global macro puzzle.

Hence, in this article we will:

  • Decompose the latest CPI report looking at the drivers behind the surprise, with a particular focus on the inflation features the Fed is the most interested in;
  • Contextualize the markets’ reaction, taking into account cross-asset signals and keeping an eye on lessons from the past;
  • Look at Long-Term ETF portfolio implications and tactical trade ideas that could be considered going forward.

    A Breakdown of The CPI Report

    Core CPI came in at a monthly pace of 0.27% for October 2022, the lowest monthly print since summer 2021.

    When it comes to inflation, growth and other macro drivers here on TMC we prefer looking at momentum rather than one-off prints: this helps smoothen volatility and seasonality, and Powell told us he’s looking at inflation the same way with a particular focus on the 3-month moving average.
    Here is how it looks like now:

    Using this momentum metric, we are still far from levels consistent with 2% YoY core inflation (see 2017-2018) but the pace has undeniably slowed down from its peak.

    As we had two false positives in late 2021 and mid-2022, it’s worth looking into the underlying drivers and the breadth of this inflation surprise – the Fed is also very attentive to how broad inflationary pressures are.

    The biggest negative contributors of the core CPI print were goods (especially transportation, i.e. used cars) and medical care services, while the most positive topline contributor was shelter inflation.

    The positive news is that goods disinflation is finally here – and it was about time.
    The transition from a pandemic, goods-centric world to a post C-19 services driven economy and the decongestion of global supply chains will ensure further weakness in goods prices.

    The NY Fed Global Supply Chain index is now sitting at only 1 standard deviation away from its long-term mean: we are not totally out of the woods yet, but definitely making progress there.

    Source: New York Fed GSCI (Global Supply Chain Index)

    The less positive news is that almost 70% (!) of core CPI components still run at above 4% annualized inflation rates, which makes inflationary pressures still broad.

    And most importantly, as shelter inflation lags house prices and on-the-ground negotiated rents it’s very unlikely its monthly pace will markedly slow down before ~6 months from today.

    Ex-energy core services CPI is running at 6.7% YoY, the fastest pace in over 40 years.

    Going forward, as goods disinflation accelerates and the momentum of core services inflation stabilizes we should expect MoM core CPI prints to range around 0.3-0.4%.

    That implies YoY core CPI will be slowly trending down towards 4% by June 2023: a welcome development, but still way too high for the Fed to feel at ease.

    By the end of 2023 though, my models point towards a rapid drop in inflation at or below 2% coupled with a likely earnings recession.
    The very negative Global Credit Impulse print in July 2022 leads YoY CPI by 5 quarters and it therefore suggests a major downtrend in inflation and nominal growth in Q3-Q4 next year.

    On the inflation front, we can expect only partial good news going forward followed by a rapid disinflationary trend in the second half of 2023.
    But that second leg will be also associated with higher unemployment rate and an negative EPS growth.

    In other words, a recession.

UK: Asking prices drop as ‘less frantic’ property market emerges – Rightmove

The housing market is becoming more price sensitive as listing values drop and cuts rise, Rightmove claims.

The portal’s latest data shows 7% of unsold properties had their prices reduced last month, slightly up on the 7.5% that were reduced in October 2019.

It is double the 4% of properties that had price cuts in October 2021.

Rightmove’s House Price Index showed the average listing coming to market is now valued at 1.1% lower than a month before, with annual growth slowing from 7.8% to 7.2%.

That puts average asking prices £366,999.

Rightmove said buyer demand is still up by 4% on the more normal market of 2019, but down by 20% on October last year

First-time buyer properties continue to be the most affected sector, with year-on-year demand down by 26% in October, while second stepper demand is down by 17%, and top of the ladder is down by 15%, according to the portal.

The analysis showed a 13% annual increase in new sellers coming to market, while average stock per agent dipped slightly from 50 to 49 in October.

The typical time on the market has also increased to the highest level since January 2022 at 40 days.

Tim Bannister, Rightmove’s director of property science, said: “The now largely superseded mini-Budget sped up the slowing of market activity that we had been seeing since the summer, and we’re now in another state of limbo as we wait for any surprises or help in Jeremy Hunt’s Autumn Statement on Thursday.

“The frenzied market of the past two years has turned into a more normal market more abruptly and less smoothly than we were expecting.

“Though many are getting on with moves, especially those with a purchase already agreed, understandably there are people who are pausing for thought.

“Some buyers have decided to turn their attention to Christmas instead, and be part of the New Year jump in home-moving activity.”

Bannister said there isn’t a glut of unsold properties, and the average number of enquirers for the low number of available properties for sale is still over a third higher than it was back in October 2019, which he said is helping to prevent any price falls by more than is usual at this time of year.

He added: “The era of historically low interest rates and the buying frenzy are over, which could make way for a more normal market that opens up potential opportunities for those who were put off entering the frantic market over the past two years.”

image1.png

Japanese Yen Boosted Against US Dollar on Soft US CPI. Has USD/JPY Broken Trend?

USD/JPY remains under pressure at the start of this week after tumbling lower into the weekend in the wake of softer US CPI data.

The deceleration in price pressures has led to perceptions that the Fed may not have to raise rates as far next year as had previously been anticipated.

The easing in the CPI number didn’t change the swaps and futures markets pricing for the December Federal Open Market Committee (FOMC) meeting. Both markets are pricing in a 50 basis point hike.

Last week saw Japanese PPI remain at an elevated level, with mixed results in the data. The month-on-month figure for October was 0.6% rather than the 0.7% forecast and previously.

The year-on-year read was 9.1% instead of the 8.8% expected and 9.7% prior. The disparity is explained by an upward revision to previous months.

It is a big week ahead for Japanese data. GDP, industrial production, machine orders and national CPI reports lead the way from Tuesday onwards.

The inflation print could be especially crucial in light of the market reaction to US CPI and the implications for the Bank of Japan’s (BoJ) approach to monetary policy going forward.

The BoJ have a policy rate of -0.10% and are maintaining yield curve control (YCC) by targeting a band of +/- 0.25% around zero for Japanese Government Bonds (JGBs) out to 10-years.

According to a Bloomberg survey of economists, Japanese GDP is forecast to grow 0.3% in the third quarter compared with the prior three months, yielding a year-on-year figure of 1.2%. Both readings are seasonally adjusted.

This is against 3.7% year-on-year CPI anticipated for October, which illustrates the Japanese economy’s susceptibility to stagflation at this time.

USD/JPY TECHNICAL ANALYSIS

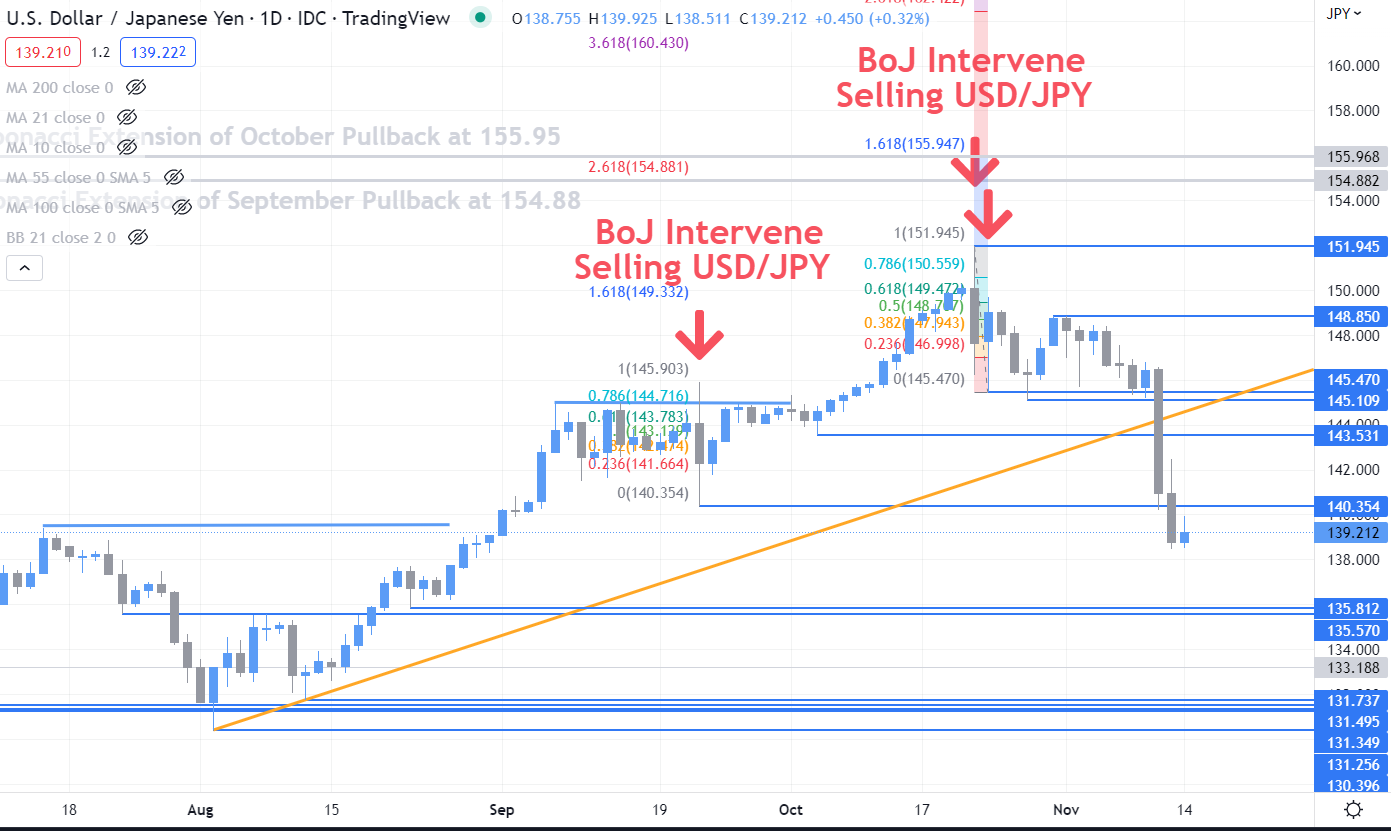
USD/JPY broke below the lower bound of an ascending trend channel last week in an abrupt move that could signal the petering out of the bullish trend.

Previous support levels that have been broken might now offer breakpoint resistance at 140.35, 143.53, 145.11 and 145.47.

Support could be at the previous low and break point of 135.81 and 135.57 respectively.

image1.png

image1.png

EUR/USD Technical Outlook: Tough Barrier Ahead

EUR/USD TECHNICAL FORECAST – NEUTRAL

The Euro is running into pretty strong resistance that could at least temporarily stall the recent rally against the US Dollar.

EUR/USD is testing a tough converged ceiling: the 200-day moving average, the August high of 1.0370, near the January 2017 low of 1.0340. The last time the pair was above the long-term average was in mid-2021, so a decisive break above it will be bullish, and not just from a short-term perspective.

EUR/USD Daily Chart

image1.png

A break above the 200-day moving average would be a sign that the medium-term bearish outlook is changing. A decisive breach above could pave the way toward 1.0615 (the 38.2% retracement of the 2021-2022 slide). Momentum on shorter-time frame charts, including intraday and daily timeframes, remains positive, suggesting that a retreat is not imminent.

However, the trend and momentum on higher timeframe charts, including the weekly and the monthly, favor Euro weakness. Hence, the path of least resistance from a multi-week perspective remains sideways to down. In this regard, the key focus is on immediate support around 1.0250-1.0300. Any break below could push the pair towards 1.0120, near strong support at the late-October high of 1.0090. EUR/USD needs to stay above 1.0090 for the short-term upward pressure to hold.

EUR/USD Monthly Chart

image2.png

EUR/USD’s medium-term trend is down. The single currency’s break this year against the greenback below a slightly upward-sloping trendline from 2015 indicates that the broader picture remains bearish. The price objective following the breakout of the seven-year sideway range works out to around 0.8900.

image1.png

USD/CNH Technical Outlook: Short-Term Pullback to Continue?

USD/CNH SHORT-TERM TECHNICAL FORECAST – NEUTRAL

The Chinese yuan’s rise above key resistance against the US Dollar seems like confirmation that downward pressure on the Chinese currency has faded in the interim.

USD/CNH 240-minutes Chart

image1.png

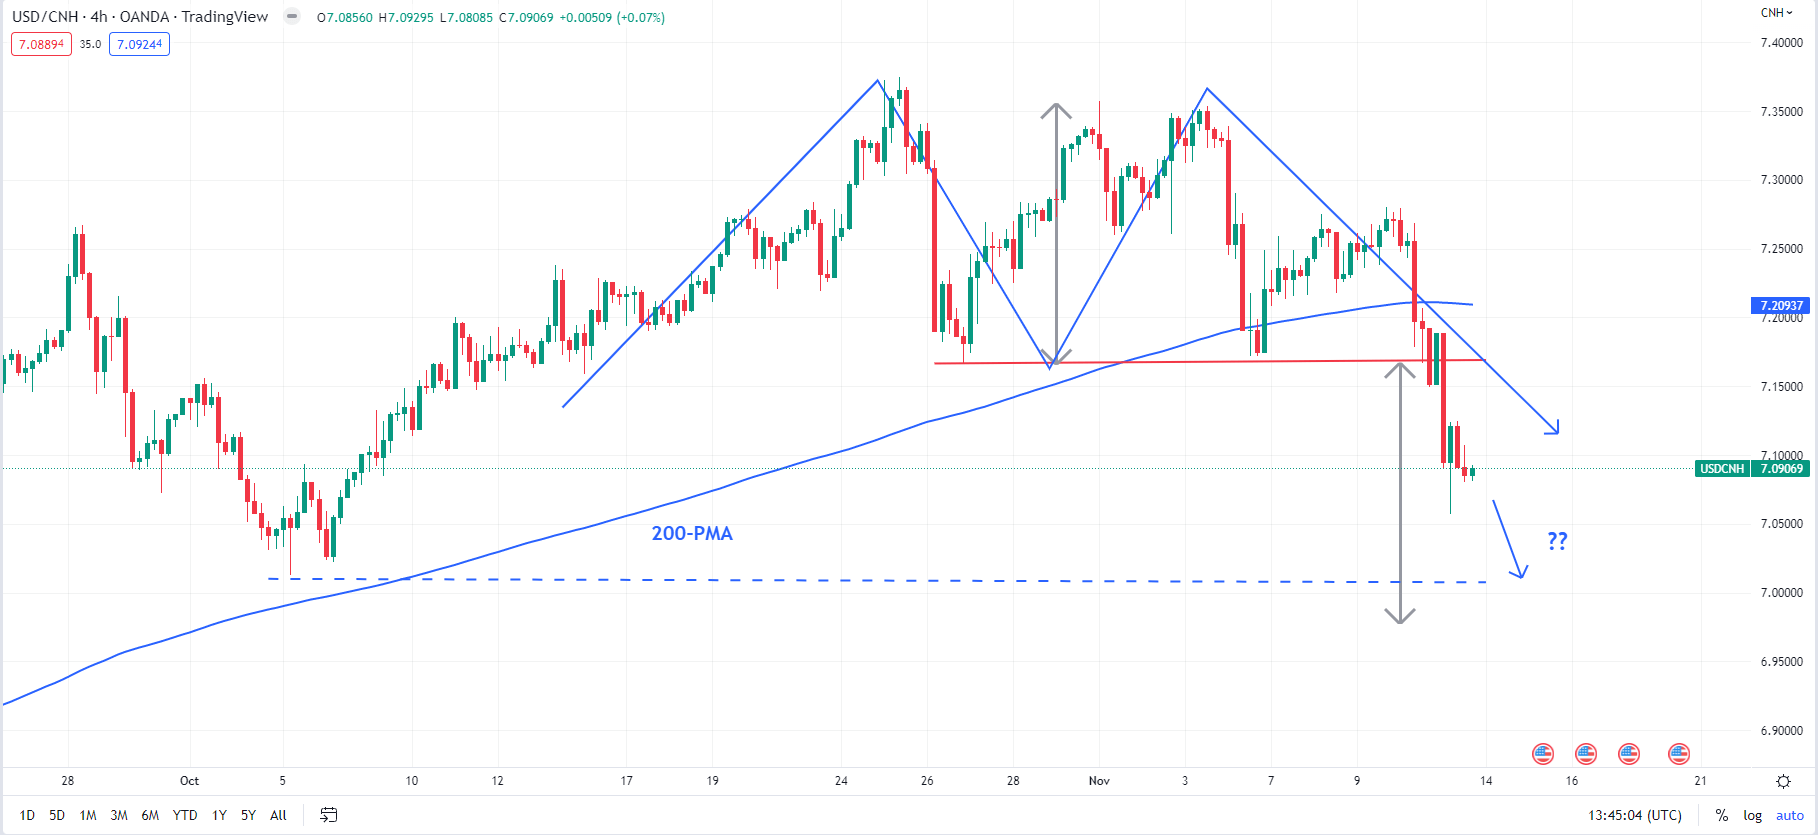
USD/CNH has fallen below quite a strong cushion at the October 27 low of 7.17, near the 200-period moving average on the 240-minute charts. It rebounded last week from this barrier but failed to cross above the mid-point of a slightly downward-sloping channel from the end of October (at about 7.25) –a path that was highlighted in the previous update. The bearish break has triggered a Double Top pattern (at the October and early-November highs), opening the way toward the October low of 7.01 (see chart above).

USD/CNH Monthly Chart

image2.png

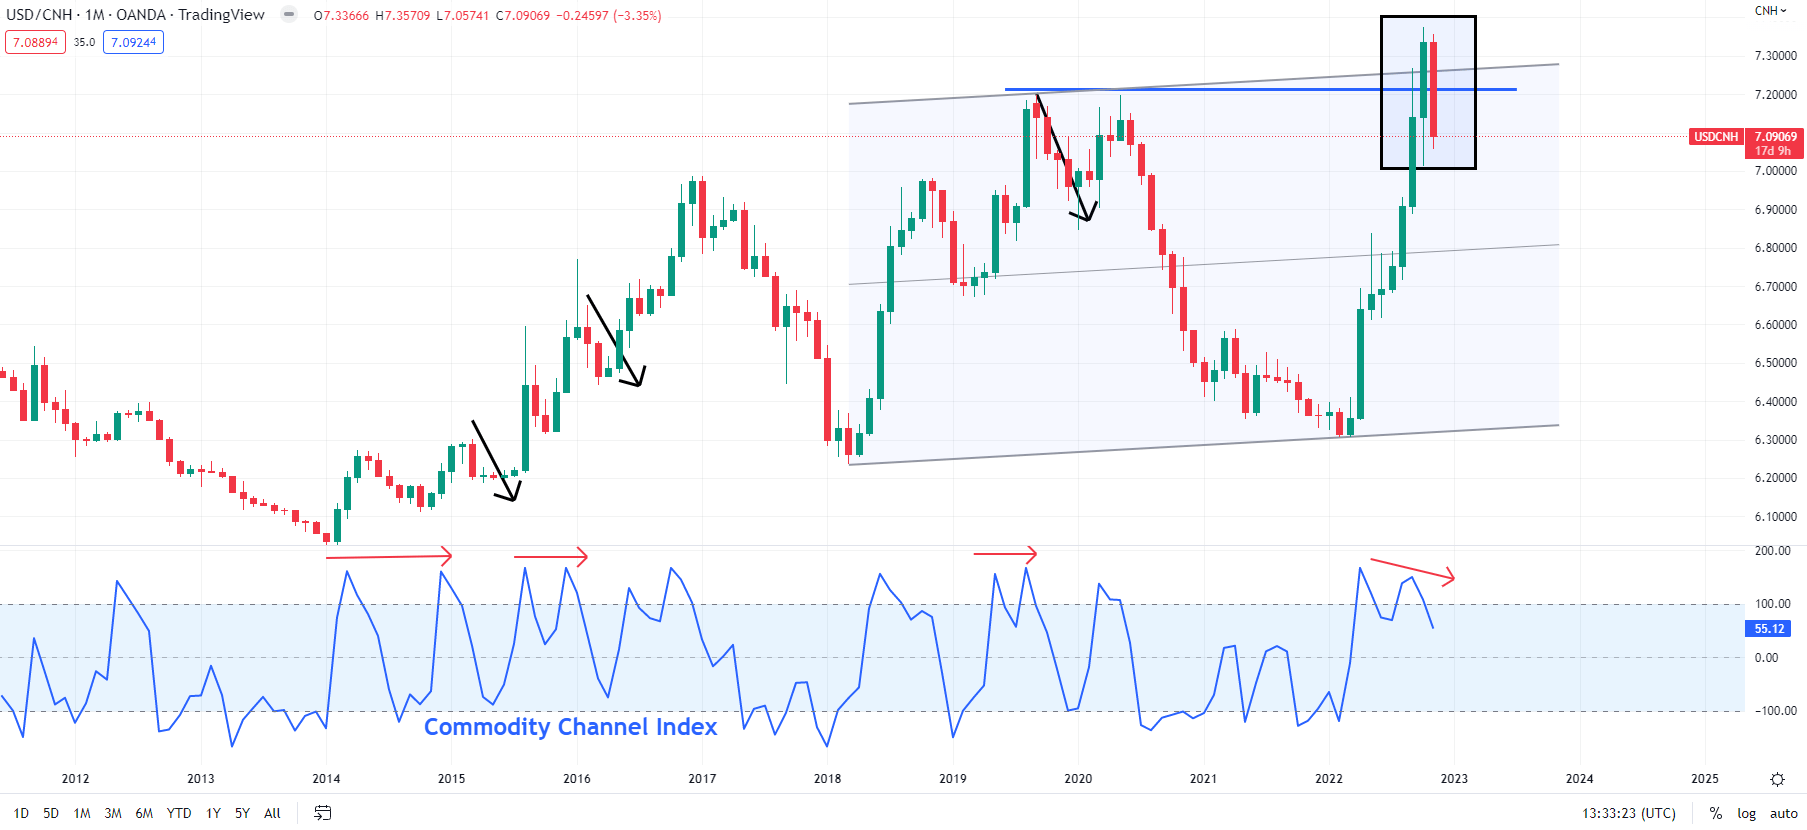
A month ago, I pointed out the risk of a pause in the USD/CNH bull run. At that time, the pair briefly rose above a major hurdle at 7.20, where the 2019 and 2020 highs coincided with the upper edge of a slightly upward-sloping channel from 2018 (see chart above). At the same time, negative divergence (rising price associated with stalling or weakening momentum) on the monthly, weekly, and daily charts indicated that the seven-month-long rally was showing signs of fatigue.

USD/CNH Daily Chart

image3.png

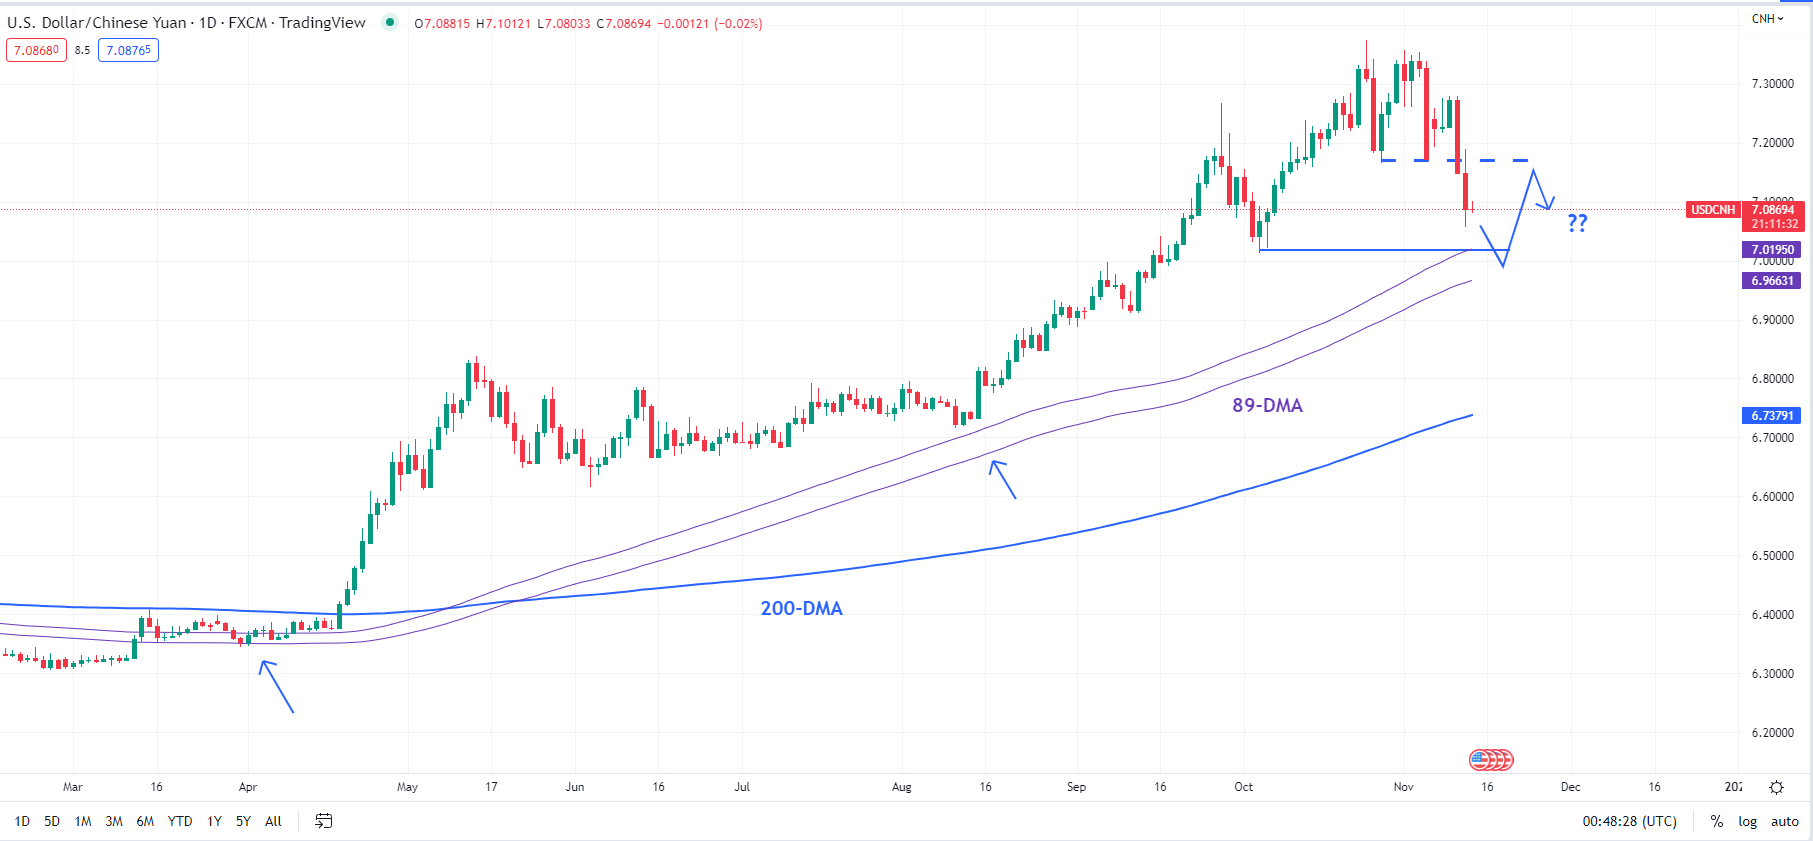
Zooming in on the daily charts, the floor at 7.01 is reinforced at the 89-day moving average (now at about 7.00), which hasn’t been broken since the USD/CNH rally began earlier this year. Hence, some sort of a rebound from around 7.00-7.01 wouldn’t be surprising. However, any such move could encounter stiff resistance marked by former support at 7.17. Still, upward momentum on longer-term charts, including the weekly and the monthly charts, remains strong (despite the recent drop in USD/CNH), so any retreat could be limited.

image1.png

Gold Looks Like Neither Inflation Hedge nor Safe Haven

For an asset often touted as some ultimate “safe haven” or “inflation hedge”, gold is having a difficult year.

If the metal really is what so many of its adherents believe it to be, then these should be some of the best days it has seen for years. After all, inflation has re-awakened across the globe. And that after decades of such obliging docility that a whole trading generation won’t have encountered price rises of current magnitude in their lives. Inured to a world in which even 2% inflation targets often proved elusive, 2022 has provided hard lessons.

And yet gold’s downtrend remains very much in place.

You don’t have to look very far to see need for a haven asset either. Russia’s invasion of Ukraine has crippled a European economy still utterly reliant on Putin’s regime for its energy needs. Tensions between China and the US threaten the last thirty years of largely peaceful globalization, to the point where many commentators are prepared to call it over. Covid has of course played its baleful part too, stunting global growth and, again, forcing a rethink of supply chains. Resilience is now prioritized where once price held sway. China’s neighbours increasingly eye its ambitions toward Taiwan with concern. Military budgets are rising across the region.

And still gold continues to weaken.

In truth the metal has spent much of the time since March behaving rather more like a classic ‘risk asset’ than any sort of haven.

image1.png

Stock markets and gold have been falling more or less together since March, which looks counterintuitive if the latter really is any sort of effective haven or inflation hedge.

Clearly, as can be seen on the chart above, prices do rise when disaster strikes or inflation rises. But it’s also clear that such gains have been short lived, and that neither has come close to breaking the prevailing downtrend.

Gold is Inflation-Sensitive, But Interest Rates Dominate

In truth gold is responsive to inflation, but really via the transmission channel of interest rate expectations.

The metal famously offers nothing beyond the prospect of price rises or, perhaps, capital preservation. There’s no yield on offer to the gold holder, no dividend. No perks of any kind, really. So, the years of historically low interest rates seen across the world and especially in the US since 2009 have flattered the asset. When yields are generally low, or even negative, the opportunity cost of holding onto a non-yielding asset shrinks too.

Now matters have gone into reverse. With interest rates rising sharply around the world, the appeal of non-yielding gold is fading.

In truth, the most powerful influence on the price of gold is the expected path of interest rates, especially in real terms. The lower the expected real rate goes, the greater is the appeal of an asset that yields nothing. Once they start to rise, gold looks short of good points.

There is possibly a caveat or two to add here. Gold’s fortunes may yet revive if the considerable firepower currently deployed by central banks in the inflation fight starts to look ineffective. The US Federal Reserve seems to be having some success in bringing prices to heel, but it’s certainly far too early for much optimism. Other monetary authorities are yet to ramp up their efforts, and it’s far from clear how successful they will be. Don’t forget that we’ve not seen inflation targeting tested in quite this manner before. In the recent past interest rate rises have been modest and quite pain-free for central banks. They’re not anymore. Increases in borrowing costs will mean real pain for businesses and consumers.

Gold Likely to Remain a Diversification Play

Moreover, in the increasingly uncertain economic and political environment we’re all getting used to, it’s hard to see precious metals being entirely evicted from portfolio recommendations. In hard times diversification is usually the watchword. The global environment might well become more supportive too. India may not have the world’s largest official holdings, but it has long been the country with the most gold within its national territory. In short, 1.4 billion people who have a long tradition of holding physical gold are getting richer. That may not see gold prices surge, but it’s bound to add some long-term support. Indeed, physical gold ownership is offered by retail banks across Asia in a way that would seem quite unfamiliar for most in the West.

But to participate in the gold market, it’s important to distinguish between investing in the metal and trading its shorter-term price moves.

If gold is viewed as some sort of defense against what we might call ultimate macro shocks, threats to the entire monetary system and fiat currency itself, then it seems illogical to hold it in any sense other than the physical. Gold products, exchange-traded funds and so on, make very little sense on this score, offering returns in the very fiat currencies which would supposedly be on the ropes should those macro shocks appear.

Trading price moves can of course be done via any method, but those keen to participate would be well-served to remember that what will matter over time are those interest-rate expectations even if the ‘haven’ or ‘inflation hedge’ impulses will clearly be seen to move the market from time to time.

As we’ve seen this year on a few occasions, those impulses fade before the interest-rate fundamentals, which seem to always reassert themselves.