gold_246-768x419

Gold Price Forecast: Easing Financial Conditions Leave the Fed in a Tricky Spot

Gold’s rally since October has been nothing short of impressive considering the underlying fundamental landscape. That said, this past week offered a slowdown for the yellow metal. XAU/USD is up about 5.7% so far this month, but the past 2 weeks have seen stagnation. Still, despite prices slowing, the yellow metal is on a 6-week winning streak. That is the longest since the summer of 2020.


With that in mind, considering the recent slowdown, has gold run too far and could prices reverse in the week ahead? All eyes are on the next Federal Reserve interest rate decision, due on Wednesday at 19:00 GMT. After hiking rates by 50-basis points, the consensus is that the central bank will tighten by just 25bps as headline inflation continues slowing. That would bring benchmark lending rates to 4.5 – 4.75%.


The problem here for gold is that markets could be getting ahead of themselves. Since the beginning of this month, traders have added almost 2 more rate cuts looking 2 years out – see chart below. This is on top of a pivot priced in for later this year. As a result, financial conditions have eased, pushing up stock markets and crucially, sinking the US Dollar. Longer-term Treasury yields have also pulled back slightly.


When the dollar and bond yields are falling, this is a prime environment for gold. The yellow metal is often referred to as the ‘anti-fiat’ instrument. It has no inherent yield for someone holding the asset outside of anticipated appreciation. As such, when the return on cash diminishes (as in traders price in Fed rate cuts), gold tends to benefit and vice versa.


Do easing financial conditions bolster near-term inflation expectations? Data since 2007 seems to show that this is inconclusive by looking at breakeven rates. That being said, the Fed may grow worried about easing financial conditions when inflation is still far above target. This opens the door for the central bank to keep the focus on near-term tightening. As such, the risk for gold might be skewed to the downside in the week ahead.

Market Outlook on Fed Rate Hikes – Now Versus End of December


–Market Outlook on Fed Rate Hikes - Now Versus End of December

Australian Dollar May Rise After US GDP Boosted Dow Jones, S&P 500, Nasdaq 100

Australian Dollar May Rise After US GDP Boosted Dow Jones, S&P 500, Nasdaq 100

Asia-Pacific Market Briefing – AUD/USD May Rise After Rosy US Session


The sentiment-linked Australian Dollar pulled cautiously higher on Thursday after US GDP data bolstered risk appetite on Wall Street. At the end of the session, the Dow Jones, S&P 500 and Nasdaq 100 gained 0.61%, 1.1% and 1.76%, respectively. This risk-on dynamic dented demand for haven assets, pushing the US Dollar lower.


In the fourth quarter of 2022, the US economy grew 2.9% q/q. That was higher than the 2.6% consensus. However, personal consumption – the largest segment of growth – expanded only 2.1% against the 2.9% estimate. The details of the report showed that the upside surprise in the headline rate was caused by volatile components, such as inventory growth and government outlays.


Overall, this likely painted a mixed picture. Arguments can be made here that point towards a hard and soft landing. This may keep the Federal Reserve on its current path with markets looking for the tightening cycle to soon conclude in the coming few months. The Australian Dollar has also been benefiting from a surprisingly strong local inflation report earlier this week that increased RBA rate hike bets.


Heading into Friday’s Asia-Pacific trading session, AUD/USD is eyeing Australian PPI data for the fourth quarter. Elevated readings that fall in line with the CPI report may keep markets focused on a more hawkish RBA. Furthermore, if traders extend the rosy Wall Street trading session in Asia, the Australian Dollar may continue benefiting.


Australian Dollar Technical Analysis


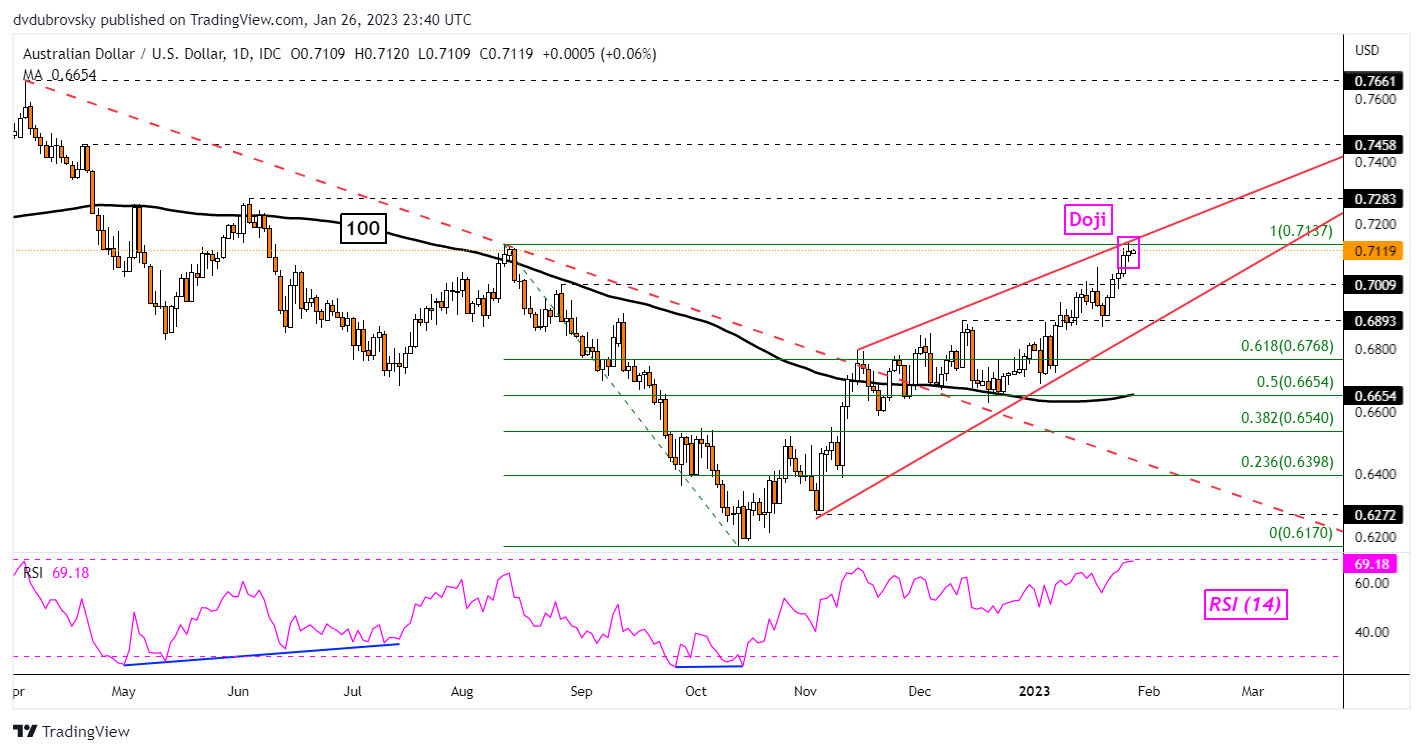
On the daily chart, AUD/USD appears to be trading within the boundaries of a bearish Rising Wedge. Meanwhile, a Doji candlestick pattern has emerged as prices tested the August high. The latter is a sign of indecision. Should prices reject resistance, a turn lower towards the floor of the wedge may occur. Otherwise, extending gains exposes the May high at 0.7283.

AUD/USD Daily Chart

AUD/USD Daily Chart


EUR/USD Forecast: ECB’s Lagarde and U.S. Data in Focus for Euro Today, Turnaround Looming?

EUR/USD Forecast: ECB’s Lagarde and U.S. Data in Focus for Euro Today, Turnaround Looming?

EURO FUNDAMENTAL BACKDROP

The euro lost some ground after yesterday’s better than expected U.S. Durable Goods Orders and GDP releases respectively. The dollar now looks to be finding its footing once more and could be interesting going into next week’s Federal Reserve interest rate decision. Today has a couple events to look out for including European Central Bank (ECB) President Christine Lagarde (see economic calendar below). The frequency of Lagarde’s speeches of late has almost diminished her impact on financial markets and the euro which leads me to believe that today’s guidance may not have a substantial impression.

From a U.S. perspective, PCE and core PCE will be under the spotlight and I suspect that anything higher than estimates could see the greenback garner support. Michigan Consumer Sentiment rounds off the trading day with forecasts showing a marked improvement on the January read which could leave EUR/USD bears on the front foot heading into next week’s central bank studded week.

EUR/USD ECONOMIC CALENDAR

image1.png

TECHNICAL ANALYSIS

EUR/USD DAILY CHART

image2.png

Daily EUR/USD price action has stalled around the 1.0900 psychological handle coinciding with an overbought Relative Strength Index (RSI) read. Negative/bearish divergence is still in play and could follow through should next week’s Fed interest rate decision take a hawkish tilt. Currently the ECB’s meeting is likely to result in a 50bps increment and is largely priced into market pricing but the Fed is currently clumped into a “pivot” narrative with recessionary fears quelling anything marginally aggressive. There is a real chance that the Fed may surprise to the upside via forward guidance as opposed to shifting to a 50bps rate hike.

Resistance levels:

  • 1.0936
  • 1.0900

Support levels:

  • 1.0800
  • 1.0774
  • 1.0736

BEARISH IG CLIENT SENTIMENT

IGCS shows retail traders are currently SHORT on EUR/USD, with 61% of traders currently holding short positions (as of this writing). At DailyFX we typically take a contrarian view to crowd sentiment; however, due to recent changes in long and short positioning, we arrive at a short-term upside disposition.

Bitcoin Technical Outlook: BTC/USD Rally Stalls

Bitcoin Technical Outlook: BTC/USD Rally Stalls

BITCOIN SHORT-TERM TECHNICAL OUTLOOK – BULLISH

Bitcoin’s technical outlook has improved in recent weeks after repeated breaks above key resistance areas and the pause in recent days appears to be a consolidation given the pace and the extent of the rise since the end of last year.

BTC/USDshort-term technical bias changed to bullishafter it broke above a crucial ceiling on the 89-day moving average (a significant barrier since mid-2022), coinciding with another barrier at the mid-December high of 18370. The subsequent break above the 200-day moving average has confirmed that the short-term downward pressure has indeed faded.

BTC/USD Daily Chart

image1.png

Having said that, momentum, though still bullish, has eased a bit in recent days, as the accompanying daily chart shows. In a way, the stall in price is not surprising given the nearly 40% jump since the end of December. This comes about just as BTC/USD is approaching another cap at the August 2022 high of 25200, near the 200-week moving average (now at about 24650). As theprevious update noted, BTC/USD needs to clear the 24650-25200 area for the medium-term downward pressure to ease.

BTC/USD Weekly Chart

image2.png

Already there have been tentative signs in recent months pointing to the possibility of a broader base building in cryptocurrencies.See the mid-November updatewhich maintained the short-term outlook as neutral. For the short-term outlook to stay bullish, BTC/USD needs to stay above the vital cushion zone at 18370-19650, which includes the 200-day moving average and the mid-December high.

Natural Gas Prices Can’t Seem to Get a Break, is There More Pain Ahead?

Natural Gas Prices Can’t Seem to Get a Break, is There More Pain Ahead?

Weekly Chart – Mild Weather Continues Pointing Natural Gas Lower

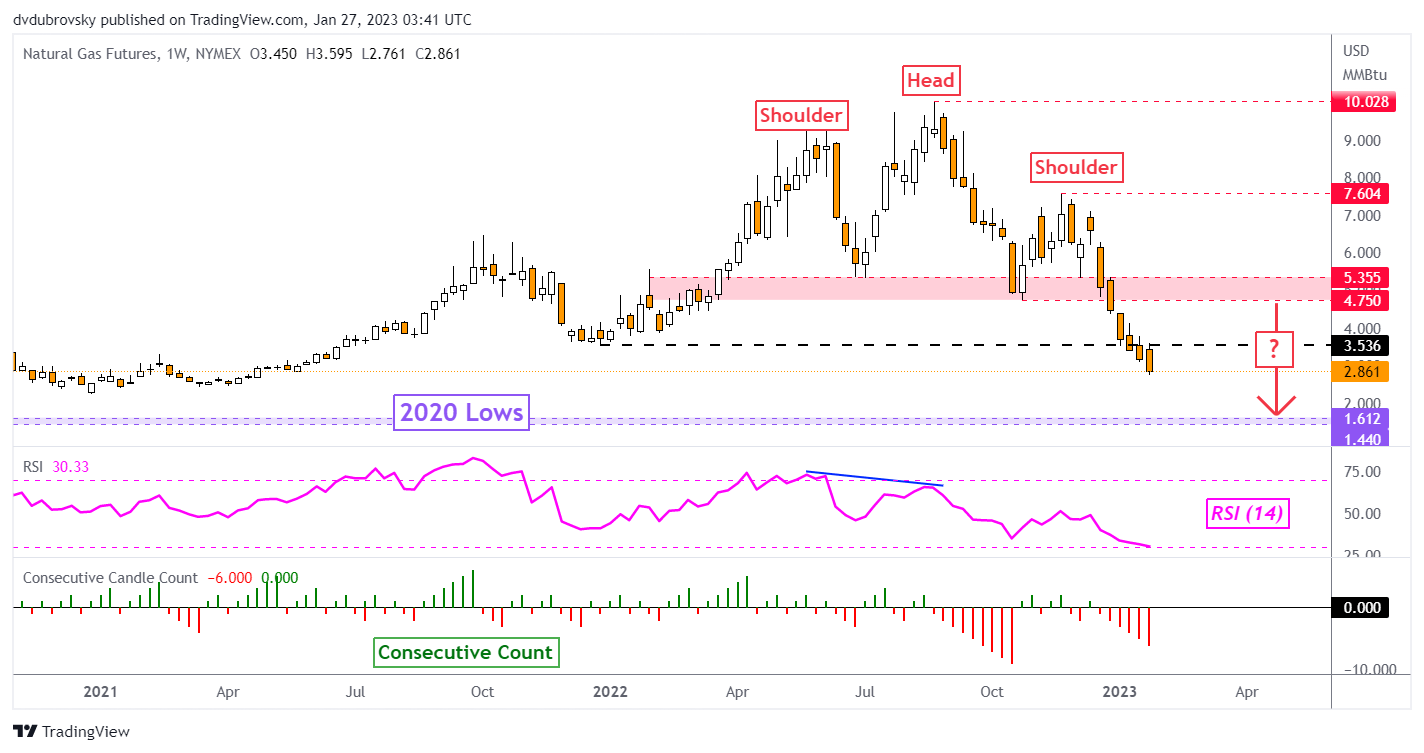
Natural gas prices continue to plummet, with the commodity closing under $3 dollars for the first time since May 24th, 2021. The United States and Europe stocking up inventories ahead of winter and mild weather have contributed to the +70% plunge since August. According to Bloomberg, recent weather estimates in the United States have resulted in traders betting on mild temperatures in February.


On the weekly chart below, natural gas continues to move lower in a path projected by a Bearish Head & Shoulders chart pattern. January is shaping up to be a 36% drop. That would be the worst monthly performance since December 2018 as the commodity aims for a 6th consecutive week of losses. Let us take a look at the daily chart to paint a better picture of the near-term price trajectory.

Weekly Chart – Mild Weather Continues Pointing Natural Gas Lower

Daily Chart – A Hammer Emerges

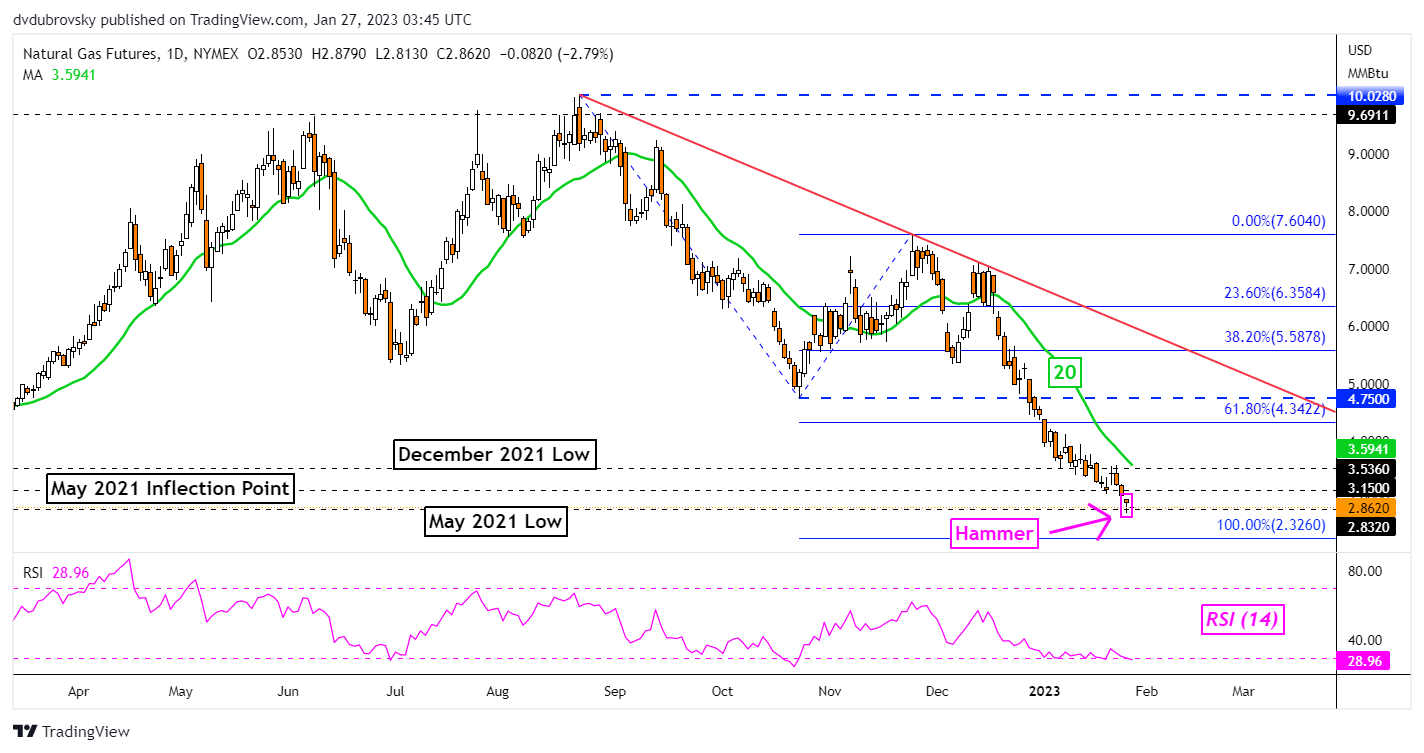
On Thursday, natural gas closed just above the May 2021 low. In fact, prices were unable to hold a close under 2.832, reinforcing it as immediate support. The commodity also left behind a Hammer candlestick pattern. A Hammer is often seen as a sign of indecision within downtrends. While its emergence does not necessarily mean that a reversal is coming, it will be important to watch what happens after.

Upside follow-through after the Hammer could open the door to a push higher. That would place the focus on the 20-day Simple Moving Average (SMA). The latter may hold as key resistance, maintaining the dominant downside focus. Even if prices manage to pull further ahead, the broader decline is being maintained by a falling line from August.

A confirmatory downside close under the May 2021 low at 2.832 exposes the 100% Fibonacci extension level at 2.326. Moving toward the latter opens the door to shooting for 2020 lows, which make for a range between 1.44 – 1.612. Reaching this range could be the implied trajectory of the Head & Shoulders seen on the weekly chart.

Daily Chart – A Hammer Emerges


Gold Looks Like Neither Inflation Hedge Nor Safe Haven

Gold Looks Like Neither Inflation Hedge Nor Safe Haven

For an asset often touted as some ultimate “safe haven” or “inflation hedge”, gold is having a difficult year.

If the metal really is what so many of its adherents believe it to be, then these should be some of the best days it has seen for years. After all, inflation has re-awakened across the globe. And that after decades of such obliging docility that a whole trading generation won’t have encountered price rises of current magnitude in their lives. Inured to a world in which even 2% inflation targets often proved elusive, 2022 has provided hard lessons.

And yet gold’s downtrend remains very much in place.

You don’t have to look very far to see need for a haven asset either. Russia’s invasion of Ukraine has crippled a European economy still utterly reliant on Putin’s regime for its energy needs. Tensions between China and the US threaten the last thirty years of largely peaceful globalization, to the point where many commentators are prepared to call it over. Covid has of course played its baleful part too, stunting global growth and, again, forcing a rethink of supply chains. Resilience is now prioritized where once price held sway. China’s neighbours increasingly eye its ambitions toward Taiwan with concern. Military budgets are rising across the region.

And still gold continues to weaken.

In truth the metal has spent much of the time since March behaving rather more like a classic ‘risk asset’ than any sort of haven.

image1.png

Gold price chart – prepared using TradingView

Stock markets and gold have been falling more or less together since March, which looks counterintuitive if the latter really is any sort of effective haven or inflation hedge.

Clearly, as can be seen on the chart above, prices do rise when disaster strikes or inflation rises. But it’s also clear that such gains have been short lived, and that neither has come close to breaking the prevailing downtrend.

Gold is Inflation-Sensitive, But Interest Rates Dominate

In truth gold is responsive to inflation, but really via the transmission channel of interest rate expectations.

The metal famously offers nothing beyond the prospect of price rises or, perhaps, capital preservation. There’s no yield on offer to the gold holder, no dividend. No perks of any kind, really. So, the years of historically low interest rates seen across the world and especially in the US since 2009 have flattered the asset. When yields are generally low, or even negative, the opportunity cost of holding onto a non-yielding asset shrinks too.

Now matters have gone into reverse. With interest rates rising sharply around the world, the appeal of non-yielding gold is fading.

In truth, the most powerful influence on the price of gold is the expected path of interest rates, especially in real terms. The lower the expected real rate goes, the greater is the appeal of an asset that yields nothing. Once they start to rise, gold looks short of good points.

There is possibly a caveat or two to add here. Gold’s fortunes may yet revive if the considerable firepower currently deployed by central banks in the inflation fight starts to look ineffective. The US Federal Reserve seems to be having some success in bringing prices to heel, but it’s certainly far too early for much optimism. Other monetary authorities are yet to ramp up their efforts, and it’s far from clear how successful they will be. Don’t forget that we’ve not seen inflation targeting tested in quite this manner before. In the recent past interest rate rises have been modest and quite pain-free for central banks. They’re not anymore. Increases in borrowing costs will mean real pain for businesses and consumers.

How to Trade Gold

How to Trade Gold
Recommended by David Cottle
How to Trade Gold
Get My Guide

Gold Likely to Remain a Diversification Play

Moreover, in the increasingly uncertain economic and political environment we’re all getting used to, it’s hard to see precious metals being entirely evicted from portfolio recommendations. In hard times diversification is usually the watchword. The global environment might well become more supportive too. India may not have the world’s largest official holdings, but it has long been the country with the most gold within its national territory. In short, 1.4 billion people who have a long tradition of holding physical gold are getting richer. That may not see gold prices surge, but it’s bound to add some long-term support. Indeed, physical gold ownership is offered by retail banks across Asia in a way that would seem quite unfamiliar for most in the West.

But to participate in the gold market, it’s important to distinguish between investing in the metal and trading its shorter-term price moves.

If gold is viewed as some sort of defense against what we might call ultimate macro shocks, threats to the entire monetary system and fiat currency itself, then it seems illogical to hold it in any sense other than the physical. Gold products, exchange-traded funds and so on, make very little sense on this score, offering returns in the very fiat currencies which would supposedly be on the ropes should those macro shocks appear.

Trading price moves can of course be done via any method, but those keen to participate would be well-served to remember that what will matter over time are those interest-rate expectations even if the ‘haven’ or ‘inflation hedge’ impulses will clearly be seen to move the market from time to time.

As we’ve seen this year on a few occasions, those impulses fade before the interest-rate fundamentals, which seem to always reassert themselves.


3 Triangle Patterns Every Forex Trader Should Know

3 Triangle Patterns Every Forex Trader Should Know

Triangle patterns have three main variations and appear frequently in the forex market. These patterns provide traders with greater insight into future price movement and the possible resumption of the current trend. However, not all triangle formations can be interpreted in the same way, which is why it is essential to understand each triangle pattern individually.

Forex triangle patterns main talking points:

  • Definition of a triangle pattern
  • Symmetrical triangles explained
  • Ascending and descending triangle patterns
  • Key points to remember when trading triangle patterns

Test your knowledge of forex patterns with our interactive Forex Trading Patterns quiz

What is a triangle pattern?

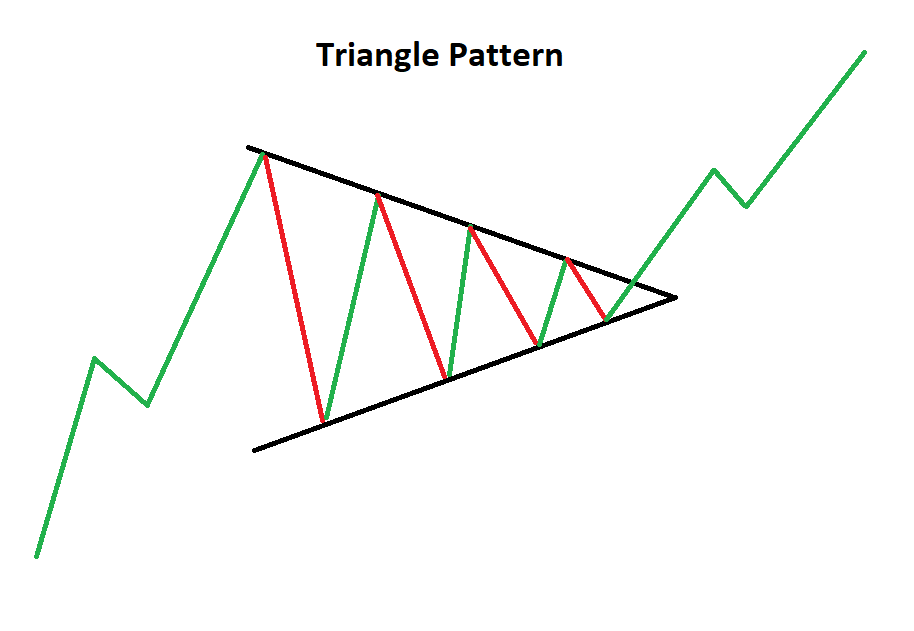
A forex triangle pattern is a consolidation pattern that occurs mid-trend and usually signals a continuation of the existing trend. The triangle chart pattern is formed by drawing two converging trendlines as price temporarily moves in a sideways direction. Traders often look for a subsequent breakout, in the direction of the preceding trend, as a signal to enter a trade.

Triangle chart pattern

This article makes use of line chart illustrations to present the three triangle chart patterns. Traders ought to familiarize themselves with the three technical analysis charts and figure out which one suits them best, although, most prefer using forex candlestick charts.

Symmetrical Triangles

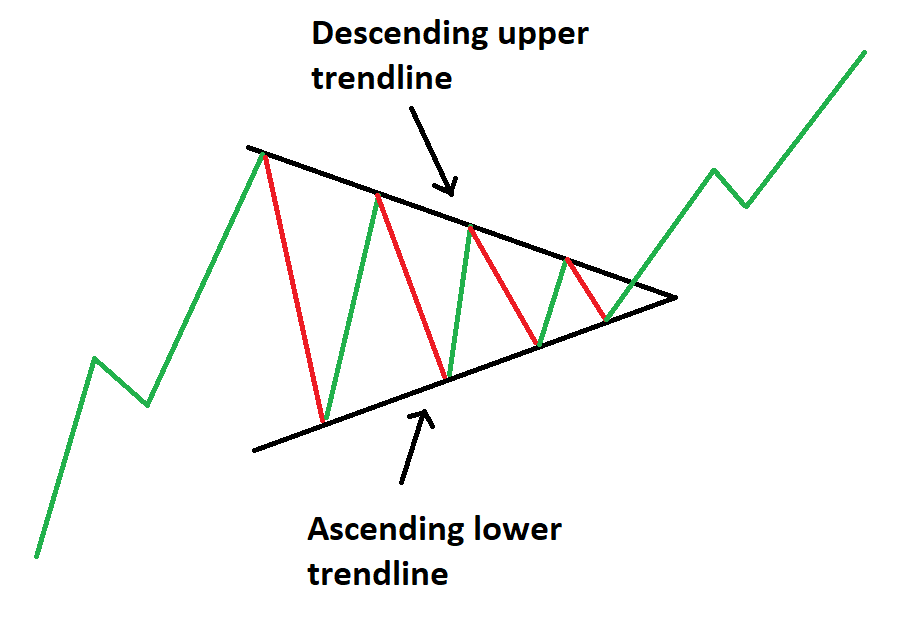
The symmetrical triangle can be viewed as the starting point for all variations of the triangle pattern. As the name suggests, a triangle can be seen after drawing two converging trendlines on a chart.

The difference between the symmetrical and the other triangle patterns is that the symmetrical triangle is a neutral pattern and does not lean in any direction. While the triangle itself is neutral, it still favors the direction of the existing trend and traders look for breakouts in the direction of the trend.

Symmetrical triangle chart pattern

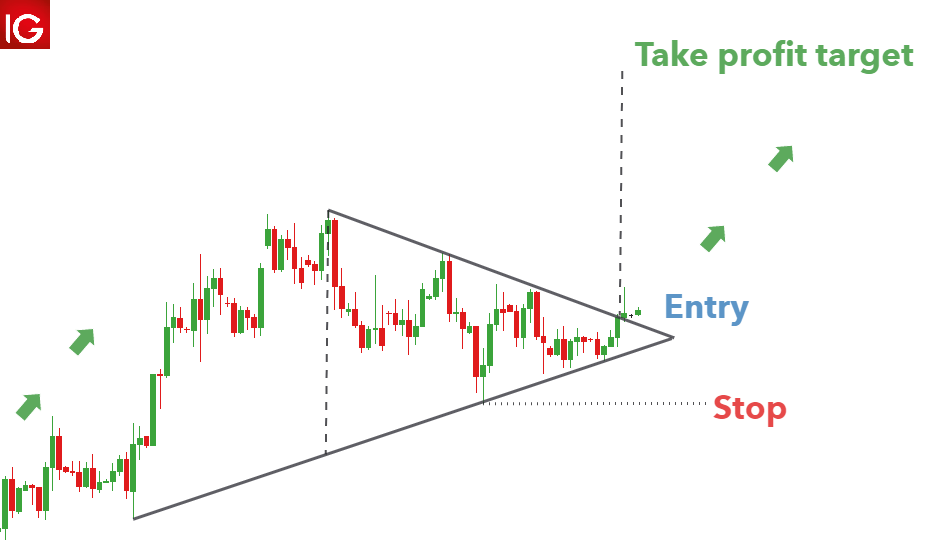
Symmetrical triangle trading strategy

Triangles provide an effective measuring technique for trading the breakout, and this technique can be adapted and applied to the other variations as well.

The AUD/USD chart below shows the symmetrical triangle. The vertical distance between the upper and lower trendline can be measured and used to forecast the appropriate target once price has broken out of the symmetrical triangle.

Its important to note that finding the perfect symmetrical triangle is extremely rare and that traders should not be too hasty to invalidate imperfect patterns. Traders ought to understand that triangle analysis is less about finding the perfect pattern and more about understanding what the market is communicating, through price action.

Symmentrical triangle pattern on forex pair AUD/USD

Ascending Triangle Pattern

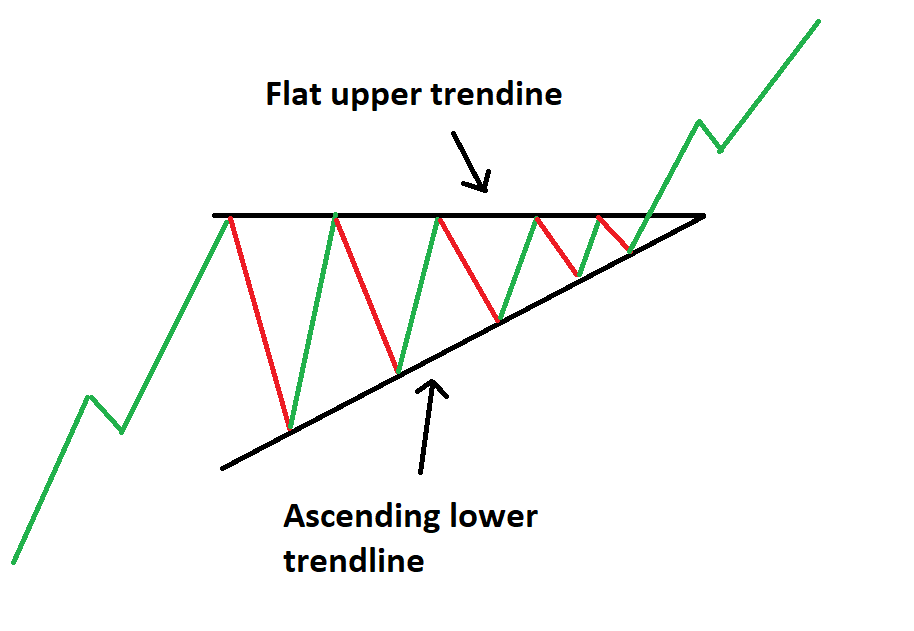
The ascending triangle pattern is similar to the symmetrical triangle except that the upper trendline is flat and the lower trendline is rising. This pattern indicates that buyers are more aggressive than sellers as price continues to make higher lows. Price approaches the flat upper trendline and with more instances of this, the more likely it is to eventually break through to the upside.

Ascending triangle chart pattern

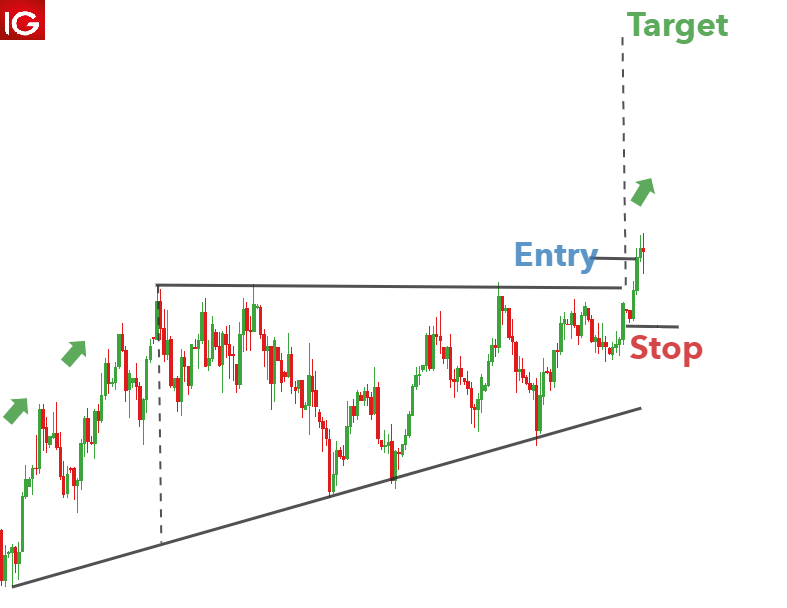
Ascending triangle trading strategy

An ascending triangle can be seen in the US Dollar Index below. Leading on from the existing uptrend, there is a period of consolidation that forms the ascending triangle. Traders can once again measure the vertical distance at the beginning of the triangle formation and use it at the breakout to forecast the take profit level. In this example, a rather tight stop can be placed at the recent swing low to mitigate downside risk.

Ascending triangle US dollar basket

Descending Triangle Pattern

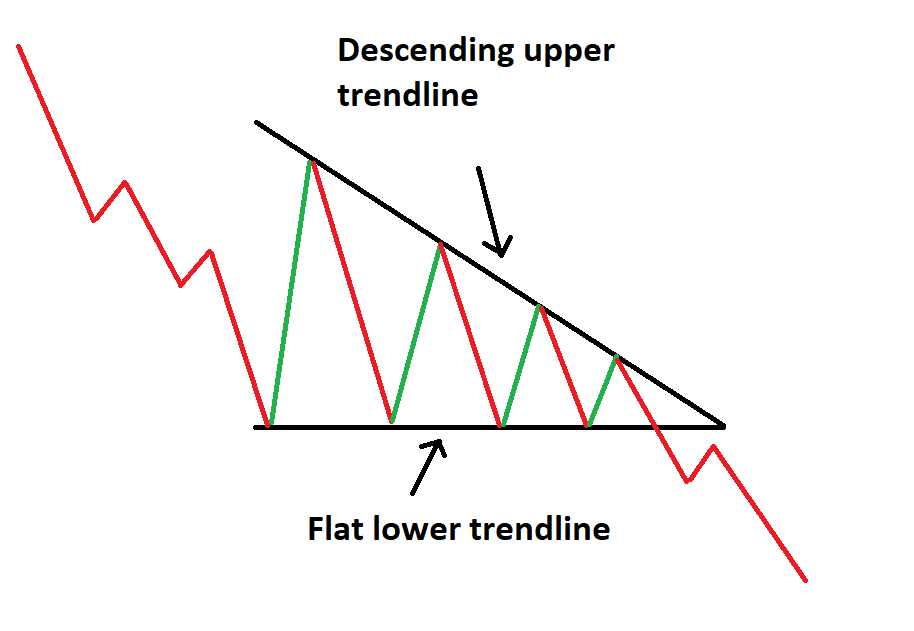
The descending triangle pattern on the other hand, is characterized by a descending upper trendline and a flat lower trendline. This pattern indicates that sellers are more aggressive than buyers as price continues to make lower highs.

Decending triangle chart pattern

Descending triangle trading strategy

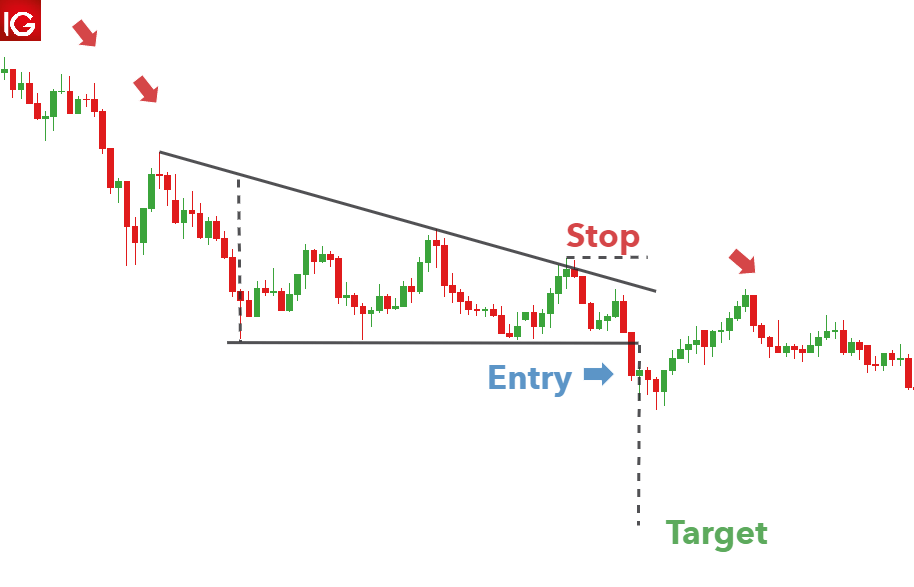
Below is a good example of the descending triangle pattern appearing on GBP/USD. A downtrend leads into the consolidation period where sellers outweigh buyers and slowly push price lower. A strong break of the lower trendline presents traders with an opportunity to go short. In this example, it doesn’t take long for the position to move in the opposite direction, highlighting the importance of setting an appropriate stop level.

The take profit level is set using the vertical distance measured at the beginning of the descending triangle formation.

Descending triangle pattern on GBP/USD

Trading with Triangle Patterns: Key things to remember

  • Always be cognisant of the direction of the trend prior to the consolidation period.
  • Make use of upper and lower trendlines to help identify which triangle pattern is being formed.
  • Use the measuring technique discussed above to forecast appropriate target levels
  • Adhere to sound risk management practises to mitigate the risk of a false breakout and ensure a positive risk to reward ratio is maintained on all trades.
Japanese Yen (USD/JPY) Trapped in a Narrow Range Ahead of US Core PCE

Japanese Yen (USD/JPY) Trapped in a Narrow Range Ahead of US Core PCE

Annual inflation in Japan’s largest city, Tokyo, continues to push higher, with the core rate touching 4.3% in January, the highest level in over four decades. The Bank of Japan will have noted this sharp move higher, and commentary yesterday from the IMF, as it looks to push inflation back to its 2% target. The IMF yesterday said that inflation in Japan was accelerating and that further upside risks remain. The IMF suggested that the Bank of Japan (BoJ) must be ready to withdraw economic stimulus quickly if inflation continues to rise and provide the market with clear guidance on any future policy changes.

International Monetary Fund – Japan 2023 Article IV Mission

How to Trade USD/JPY

How to Trade USD/JPY
Recommended by Nick Cawley
How to Trade USD/JPY
Get My Guide

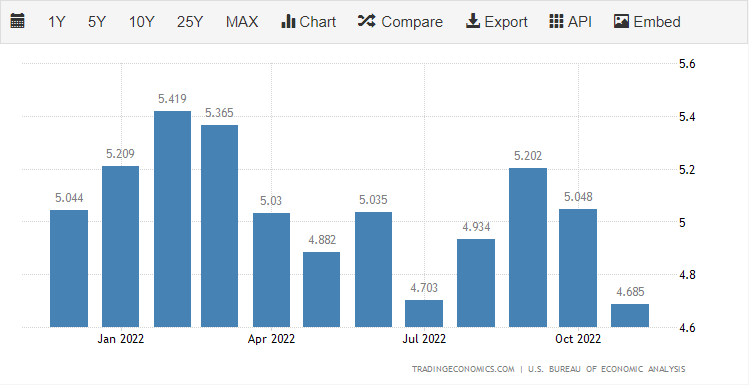
Later in today’s session, the December US core PCE data will be released to an expectant audience. This is the Fed’s preferred measure of inflation and is expected to show price pressures easing further. Market expectations are for an annual reading of 4.4% compared to 4.7% in November.

Core PCE Lower for the Fourth Straight Month?


image1.png

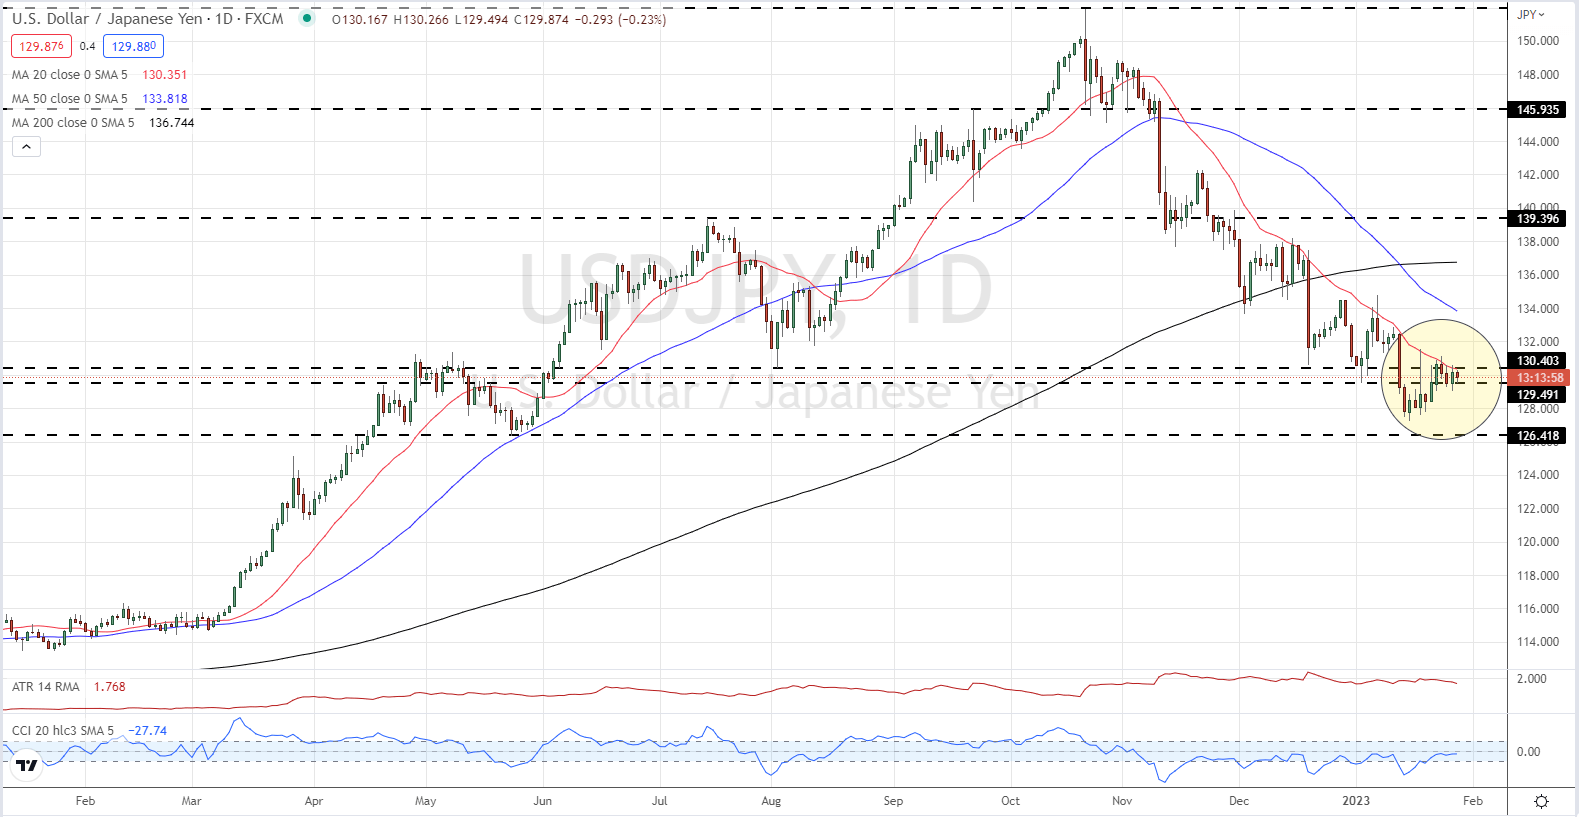
The technical outlook for USD/JPY is mixed with a medium-term trend of lower highs meeting a short-term trend of higher lows. The pair currently trades in a very narrow range and is primed to make a break. USD/JPY has tracked the 20-day moving average (red line) lower since early November, while a negative 50-day/200-day crossover printed on January 12. In the short-term, the US dollar will be the driver of the next move with today’s inflation data followed by the Fed’s monetary policy decision and the latest look at the US jobs market (NFPs) next week.

USD/JPY Daily Price Chart – January 27, 2023


image2.png

Chart via TradingView

Dollar Tight Range to Be Tested by GDP and Fed’s Preferred Inflation Read

Dollar Tight Range to Be Tested by GDP and Fed’s Preferred Inflation Read

The markets are doing everything they can to indicate that proximate technical barriers that chart traders would otherwise hold dear will not be dictating the next trend. A clear fundamental bead has been absent these past weeks, and it shows in the lack of traction that we’ve established in benchmark risk assets, currencies and other principal measures of the financial system. There is no better indication of the indecision for me than the S&P 500. There was a high profile but ultimately unproductive attempt to reverse the 2022 bear trend back in December, which many technicians played down (myself included) due to the market conditions. In thinner markets, technical barriers can be more acute in less volatility; but a swell in activity can also render them permeable. What we have witnessed this past week all but erodes faith in the clearly delineated technical levels and we can’t say it is due to holiday conditions. The SPX has broken above the 200-day moving average (SMA) and trendline stretching back to the beginning of 2022, only to stall out and crash back into range. This week, we made another go at those same levels and subsequent move back into established range. This time though, the ‘path of least resistance’ move (the slide back into range) was pressured back to the ramparts of the technical pattern within a single trading session. Perhaps this acceleration is a sign of speculative build up and anticipation for imminent resolution?

Chart of S&P 500 with 200-day SMA, Volume and 1-Day Historical Range (Daily)

Looking back over the calendar this past session, there simply wasn’t anything with the fundamental girth necessary to snap the market from its complacent drift. The aftermath of the Microsoft earnings were completely overwhelmed by the general trend of the market itself. The rally following the tech company’s uneven earnings after hours Tuesday did not hold into the open. MSFT shares gapped lower just as the S&P 500 and Dow would. And, like those indices, it would also recover much of its losses. Another honorable mention for fundamental awareness was the Bank of Canada rate decision. The event itself was remarkable, not in the group’s decision to lift its benchmark rate 25bps to 4.50 percent. That was the consensus forecast. Rather, the surprise was in the clarity with which the policy officials signaled their decision to shift from a tightening regime to one that was essentially a plateau. For the Canadian Dollar itself, this is a dose of reality; but it wasn’t really a surprise. Looking to swaps-derived rate forecasts for the BOC, the rate for mid-year was approximately 4.50 percent (and there are still cuts priced into the second half). The greater speculative impact here is that the BOC’s actions will likely be interpreted as a landing pad for other major central banks…like the FOMC.

Chart of USDCAD with 100 and 200-Day SMAs, Overlaid with US-Canada 2-Year Yield (Daily)

Setting aside the aimless volatility of the S&P 500 and the pockets of isolated volatility around concentrated event risk, there has been a remarkable consistency to the indecision of the US Dollar. Mirrored in the majors like EURUSD and USDJPY, the DXY Dollar Index has shown an incredible reservation in price action over the past 9 trading days. In fact, the historical range carved out over that period (1.3 percent of spot) represents activity comparable to the holiday trading conditions through the end of December. Liquidity is back to normal levels, so this is indecision likely born of a uncertainty around principal fundamental movers. Could the upcoming US 4Q GDP release definitively push us below the midpoint of the 2021-2022 range or perhaps truly reverse the slide from these past four months? I have my doubts.

Chart of DXY Dollar Index with 100 and 200-Day SMAs, 9-Day Historical Range (Daily)

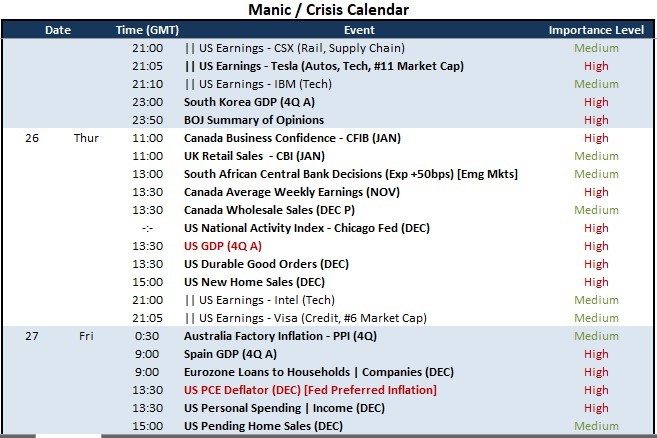
Looking to the Global Macro docket for the final 48 hours of the trading week, there is a range of meaningful event risk, but there are two particular readings that stand as particularly capable of generating systemic response beyond the local markets and currency: the US 4Q GDP release (Thursday 13:30 GMT) and US PCE deflator (Friday 13:30 GMT). The former will naturally update us on the health of the world’s largest economy. That could carry significant weight when evaluating the health of the global economy. The economist consensus is for a slowdown to a 2.6 percent annualized pace, but that is hardly shocking for bulls or bears. If there is a significant drop, mind the ‘recession’ fears that could arise – which would more likely hurt equities and charge the safe haven aspect of the Dollar. Alternatively, the economic enthusiasm of a strong reading is likely to be more than offset by the implications for the Federal Reserve to fulfill its commitment for a targeted terminal rate of 5.1 percent (a premium to the market’s view). If we move through Thursday without resolution, the Friday inflation indicator is the Fed’s favorite. A surprise here would be more distinctly interpreted in the Fed’s potential spectrum.

Top Global Macro Economic Event Risk for the Next 48 Hours

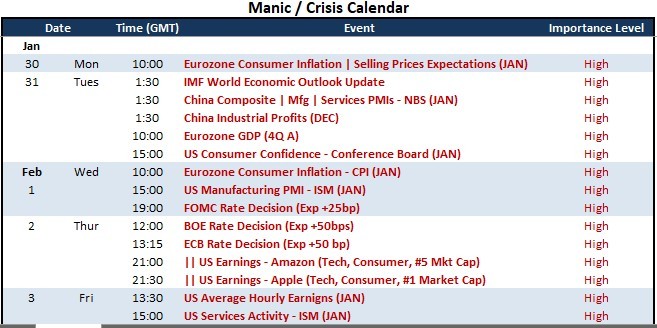
Where the US GDP and PCE deflator are high profile events in the macro fundamental sense, their history for generating market movement is not particularly strong. The GDP reading is a lagging indicator and the market seems to prefer the earlier released CPI reading. That said, there is still the potential for volatility as much due to the very narrow trading ranges of the Dollar and indices; but follow through has even more trouble than the weekend liquidity drain. Next week, we are overloaded for exceptional event risk. For the US perspective alone, we have the Conference Board consumer confidence report, ISM manufacturing indicator, FOMC rate decision and Friday NFPs. Few will want to make a decision on an upstream and second order indicator when the definitive market movers are dead ahead.

Top Global Macro Economic Event Risk for the Next 48 Hours


Japanese Yen Gains After Strong Demand at 2-Year Treasury Auction, Where to?

Japanese Yen Gains After Strong Demand at 2-Year Treasury Auction, Where to?

Asia-Pacific Market Briefing – Japanese Yen Gains as Treasury Yields Fall

The Japanese Yen gained against the US Dollar on Wednesday, capitalizing on broad weakness in the Greenback. Notwithstanding small recent changes from the Bank of Japan towards policy normalization, the BoJ remains the most dovish developed central bank. As such, the Yen often finds itself being sensitive to external developments, particularly from the United States.

USD/JPY’s drop coincided with the 2-year Treasury yield falling about 2 percent on Wednesday. The latest 2-year Treasury auction revealed that the bid-to-cover ratio jumped to 2.94 from 2.71. This is a gauge of demand. It was the highest since April 2020. It seems participants might be eager to lock in a high rate in anticipation of a future decline in yields. Such an outcome could be caused by a recession.

The auction also occurred before key US economic data comes out later today. At 13:30 GMT, the first estimate of fourth-quarter GDP will cross the wires. The US economy is seen growing 2.6% q/q, slower from 3.2% in Q3. A softer outcome could further boost beds of Federal Reserve rate cuts later this year. A subsequent drop in US bond yields would thus likely push USD/JPY lower.

Focusing on Thursday’s Asia-Pacific trading session, the economic docket is fairly quiet. As such, the focus for traders will likely be on risk appetite. Wednesday’s Wall Street trading session saw the Dow Jones, S&P 500 and Nasdaq 100 finish mostly flat. As such, this may leave markets consolidating until key US GDP data comes out later.

Japanese Yen Technical Analysis

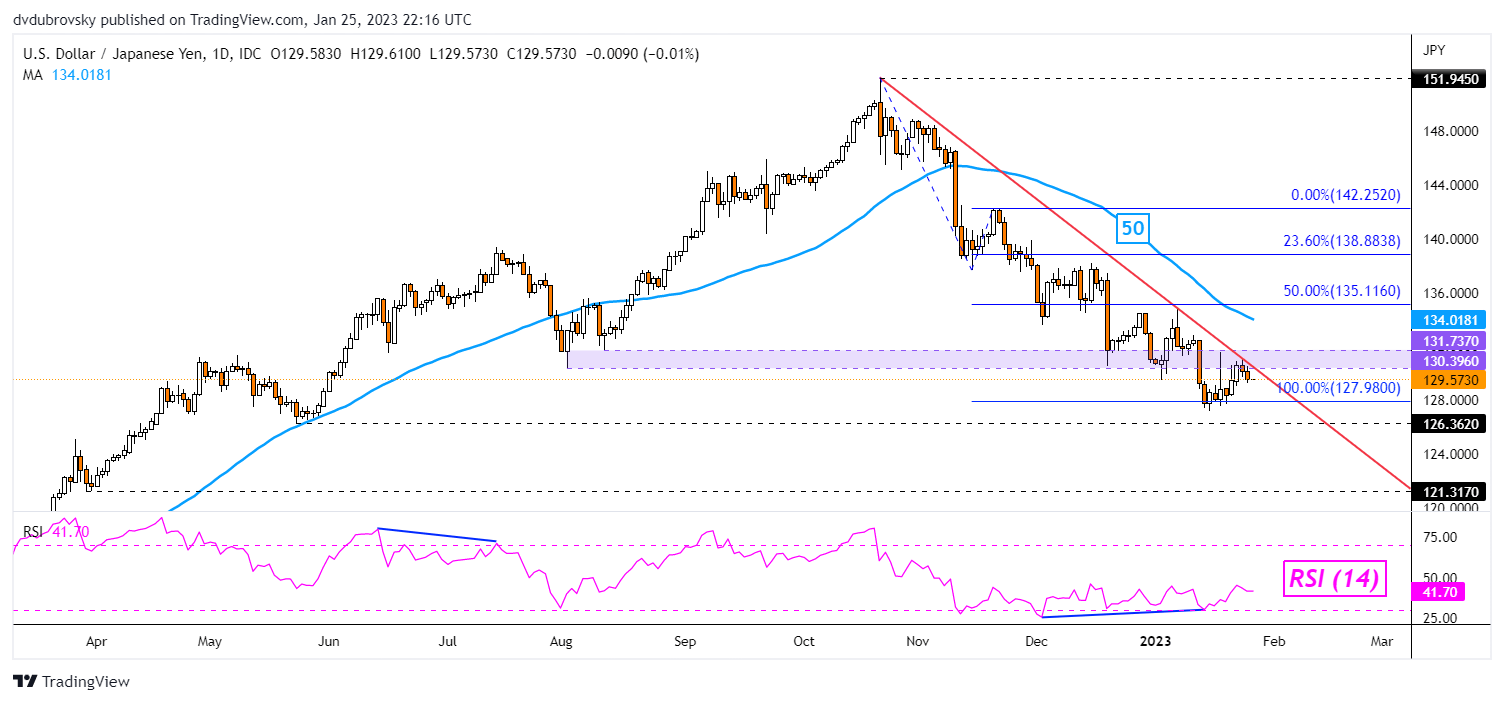
On the daily chart, USD/JPY appears to be turning lower after prices once again tested the key falling trendline from October. Further losses would place the focus on the 100% Fibonacci extension level at 127.98. Keep a close eye on RSI. Positive divergence may emerge, continuing to show that downside momentum is fading. The latter can at times carry bearish underpinnings.

USD/JPY Daily Chart

USD/JPY Daily Chart