bank

Central Banks and Monetary Policy: How Central Bankers Set Policy

How Central Banks Set Policy

Central bank policy is an important driver of movements in financial markets. Central bank officials gather, project, and analyze economic data to determine the future path of the economy and its relation to the bank’s policy goals. Challenges or deviations from the ideal path of the economy will often drive a central bank to policy action. However, the setting of a central bank policy is not as simple as issuing a press statement declaring a change in interest rates, an adjustment to asset purchases, or further supportive measures. Central bank policies must also be implemented through transactions in financial markets.

Central bank policies have a direct and oftentimes immediate impact on the FX markets. As central banks loosen or tighten policy, their respective currencies become more or less attractive to hold. Understanding the process by which central banks make such decisions is a valuable skill to any trader, as being able to predict what a central bank might do will give a greater depth of understanding to each key economic data release.

Mandates and Price Stability

While the US Federal Reserve is the most watched and most important of the central banks, it’s mandate exceeds that of the average central bank. The Federal Reserve is dually focused on maximum employment and price stability, while most central banks are focused exclusively on the price stability mandate. Price stability is best defined as low, stable, and predictable inflation. Most central bank’s target an inflation level of around 2%, which is viewed as a good indicator of strong and stable economic growth. When making monetary policy decisions, central banks must weight a variety of economic indicators, expectations, and conditions.

Economic Data

Central banks parse the same economic data that FX traders and other market participants watch closely. Unemployment, housing, and inflation are some of the key data points central bankers track as they meet to discuss and set policy. These indicators are important to GDP and to identifying expanding or slowing trends in a large economy. The DailyFX Economic Calendar is a great tool to help traders monitor the same data releases that central bankers are keeping a close eye on.

Projections, Economists

Beyond following the same economic data that market participants have access to, central banks employ hundreds of economists. These economists are specialized in a certain area of expertise and are often considered leaders in their field, making them the best choice to hold the responsibility of creating the projections that central banks will use to set policy. Economists create and model economic projections of the future path of the economy based on current data, expectations for the future, their knowledge of the subject area, and potential policy choices.

Central bankers use these models to anticipate where the economy is headed next and help evaluate the potential impact of their policy choices. Many central banks publish summaries of their economic and policy projections on a consistent basis, and these summaries are a valuable resource for traders looking to understand how an important driver of markets is viewing overall economic conditions.

Framework

Once central banks have gathered the necessary amount of economic data and projections, they apply it to a framework in order to determine whether policy changes are needed. A central bank’s policy framework outlines its understanding of the relationship between key economic metrics and the central bank’s mandate, oftentimes how a variety of economic data points will weigh on inflation.

The ever-evolving world economy has led to continual evolution of central bank policy frameworks. Monetary policy setting was once based on simple rules and equations that dictated a proper level of interest rates given the relationship between inflation and employment. The world has since become much more complex, and central banks have moved away this simplistic, rules-based approach to policy.

The most important development, and the one with the largest implications for central bank policy, is the secular trend of low interest rates and low inflation in developed economies. Continued low interest rates have weakened the central bank’s ability to fight economic downturns through simple cuts in interest rates. Meanwhile, low inflation despite tight labor markets and low rates has meant that central banks have had to rethink and update their understanding of the relationship between employment and inflation.

With these shifting tides in mind, the Federal Reserve and the ECB have both conducted reviews of their monetary policy frameworks. While the ECB’s review and conclusions are still underway, the Federal Reserve announced its findings and its new policy framework in the late summer of 2020. In this announcement, Fed central bankers recognized that the relationship between inflation and employment had changed such that the economy can tolerate higher employment levels without inflation becoming a threat. The Fed also changed its inflation policy from a symmetric 2% target to an average 2% target, meaning that Federal Reserve policy makers will now tolerate inflation higher than 2% so long as that higher inflation helps raise the average to 2%. In essence, this new framework communicates to the markets that the Fed will no longer be looking to tighten policy at the first signs of overheating but rather will allow policy to remain loose and the economy to heat up further.

For traders and market participants, understanding that higher inflation readouts and other strong economic data will not drive the Fed to preemptively tighten policy is an important departure from the framework that held true following the financial crisis. For central bank watchers and traders in general, the importance of understanding the central bank’s framework cannot be overstated. An understanding of the framework will make for more informed trades as you will be able to better predict the market’s expectation of the central bank following data releases.

Once the central bank reconciles new economic data and projections with its framework, it makes a decision. While such a decision was once as simple as raising or lowering rates, central bank toolkits have expanded dramatically since the financial crisis as central banks have played a larger role in supporting the financial system and the overall economy.

Conventional v/s Unconventional Policy Tools

Before the financial crisis, the toolkit of most central banks was relatively standard. These central banks would set a short-term interest rate and control bank lending through reserve requirements and other similar metrics. The major exception to these simple operating tools was the Bank of Japan, which began to embark on “unconventional” policy tools beginning in the late 1990s, as Japan struggled to escape a major recession and deflation.

In the aftermath of the financial crisis, economies around the world remained stuck in a state of shock. Global central banks, led by the Federal Reserve, began to adopt the same unconventional policies introduced by the Bank of Japan. They purchased large amounts of government bonds to flood the financial system with liquidity and dropped and held their policy rates at zero or even in negative territory. During the crisis, central banks also used their lending powers to create new, targeted tools that could provide support to key areas of the financial system, like money market funds and large broker-dealers, that fell outside of the purview of traditional central bank support tools.

These unconventional tools have become a major part of the central bank’s toolkit and have been put to use to great effect during the Covid crisis. Beyond slashing policy rates back to the zero-lower bound, central banks expanded the scope of their support measures beyond anything seen during the financial crisis, pledging support to corporate bond markets, backstopping key areas of the financial system, and purchasing trillions in government bonds.

Quantitative Easing

Following the financial crisis, central banks set out on a journey to manipulate longer-term rates and flood the financial system with liquidity in order to better support economic spending, growth, and inflation. Through large-scale asset purchase programs, better known as quantitative easing (QE), central banks have bought large quantities of government debt from the open market. Technically, these operations are similar to the traditional open market operations undertaken by central banks pre-crisis, just on a much larger scale. While the exact mechanism of action surrounding QE remains a point of debate, such programs drive down longer-term interest rates, help to support inflation, and oftentimes provide a tailwind to other financial markets.

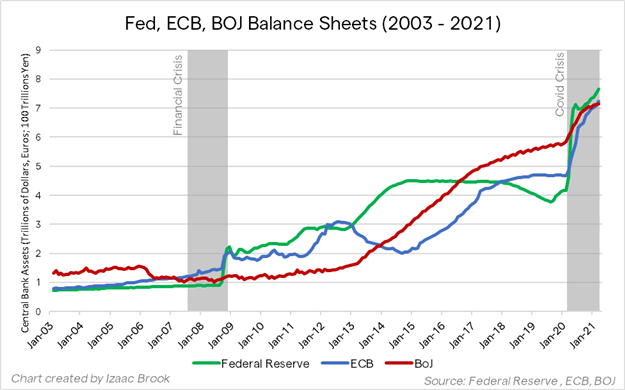
QE has also risen in importance given the prolonged period of low rates that advanced economies have been faced with. Since central banks can no longer simply cut rates to the necessary level needed to jumpstart the economy during a recession, they have instead turned to further QE programs. Research suggests that an asset purchase program equivalent to around 1.5% of GDP has a similar impact as 25 basis point interest rate cut. With US interest rates at only 1.50% before the Covid crisis, and rates elsewhere even lower, continued QE programs should supplement the deficiency in traditional rate cuts. As such, asset purchase programs have ballooned since the Covid crisis began, sending central bank balance sheets to record levels.
Implementation

These unconventional support measures are carried out by the central bank’s monetary policy implementation division. The implementation division is where central bank policy is actually put into effect through trading and technical adjustments made in financial markets. Policy decisions from head central bankers are passed to central bank traders, who then trade with specific counterparties to move rates or otherwise carry out policy decisions.

Rates Setting: Pre-Crisis

For the Federal Reserve, monetary policy is implemented through the Federal Reserve Bank of New York. Before the financial crisis, a decision on the Federal Funds Rate would be passed to markets desk traders. These traders would conduct open market operations with primary dealers. Primary dealers are large banks approved as trading counterparties of the NY Fed, and are required to make markets and support the issuance of US Government debt (Treasuries). The NY Fed markets desk would buy or sell a certain amount of Treasuries from these banks, adjusting the supply of liquidity in the financial system and pushing short-term rates into the FOMC’s desired range. This fine-tuning of liquidity was the process used by central banks around the world before the unconventional tools of the financial crisis were put to use. Once global financial systems were flooded with liquidity, policy setting had to evolve beyond this rudimentary method.

Rates Setting: Post-Crisis

Following the QE operations undertaken by central banks during the financial crisis, traditional open market operations would not have enough of an impact on liquidity and credit conditions to materially tighten or loosen interest rates. The Fed’s main policy lever became interest on reserves, the rate at which banks earn for storing “freshly-printed” QE money directly at the Fed.

Keep track of interest rate decisions by visiting our Central Bank Calendar

Activity in the Federal Funds Market shrunk drastically as banks no longer needed to seek out funds to maintain regulatory requirements and also no longer desired to lend to other banks on an unsecured basis. Instead, interbank lending migrated to the repo market, where lending is secured against collateral. The NY Fed’s repo and reverse repo facilities have become important tools for managing the excess liquidity in the system and the rates on these facilities are often adjusted alongside the Fed’s main policy rate. The repo (RP) facility allows the Fed to lend to cash-seeking market participants against Treasury collateral, setting an upper-bound on interest rates. The reverse repo facility (RRP) is the opposite, where the Fed lends Treasury collateral to market participants with excess cash. The RRP facility serves as a temporary drain of reserves from the system and sets a lower-bound on interest rates.
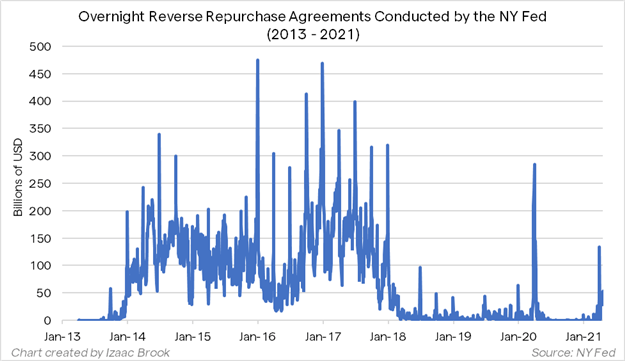
During 2014 to 2018, the pre-Covid peak of the Federal Reserve’s balance sheet, the RRP facility saw huge uptake at quarter-end periods as excess cash was drained from elsewhere in the financial system, preventing rates from below the FOMC’s lower-end target. With bank reserves at new record highs in the post-Covid environment, one should expect to see similarly-large usage of the RRP facility at future quarter-ends. The NY Fed raised the counterparty limit for the facility at the March 2021 FOMC meeting in preparation of future usage.

Unconventional Policy Implementation

QE programs are implemented in the same way that open market operations are. Traders in the central bank’s policy implementation division publish announcements and schedules detailing their purchase plans. Their counterparties submit a list of bonds they are willing to sell to the central bank and the central bank’s traders select and transact with the most competitive bids. While the internet is awash with central bank-focused money printing memes, the actual money created by the central bank in exchange for these bonds is electronic only. The accounts of transacting counterparties are credited with fresh digital money from the central bank.

Communication is Key

Given the evolution of monetary policy implementation since the financial crisis, another important development in the central bank toolkit has been forward guidance. Forward guidance is the communication of the future path of interest rates. The premise of forward guidance is simple: businesses, investors, and markets are constantly trying to predict the central bank’s next moves. By clearly communicating their plans, central bankers can adjust expectations to their desired points and provide better clarity to markets. Forward guidance is linked to policy framework, applying the central bank’s view on key metrics to its communication about future policy.

Communication, transparency, and the setting of expectations has been a continually-evolving piece of central bank policy. Transparency on policy helps the central bank remain both predictable and credible, valuable standards to maintain for an institution with such power over the financial system. The FOMC began to use forward guidance in the aftermath of the financial crisis, communicating that rates would be held at zero “for some time.” As the recovery continued, forward guidance language evolved to a dates-based approach and then an outcomes-based approach. Both approaches help to set expectations for policy over the longer-term and have proved useful for central banks around the world.

Central banks have turned to forward guidance again in the Covid crisis, providing markets with clear communications of rate outlooks, tapering expectations, and asset purchase program paths. For its part, the Federal Reserve has continued to stick to guidance consistent with their new framework despite strong economic data and market worries of inflation. FOMC members have affirmed that tapering and rate hikes will not come until substantial progress is seen towards the Fed’s goals.

Setting Policy, Summation

Central bank policy has evolved a great deal over the past two decades. While the data that central banks track in order to formulate policy has not changed much, the way that policy is implemented has evolved a great deal. The development of secular trends following the financial crisis has also created the need for new innovations in policy. Central banks now control rates and monetary policy more generally through the management of liquidity, through large-scale asset purchases, through technical tweaks to money markets, and through enhanced communication. Understanding how these components interlock and weigh on each other and their impact for overall financial markets is valuable knowledge for any trader.


Austrian Dollar Update: CPI Beat Reveals Worrying Trend for the RBA

Austrian Dollar Update: CPI Beat Reveals Worrying Trend for the RBA

Australian Inflation Posts Massive Beat to the Upside

  • CPI inflation rate (year on year): 7.8% vs 7.5% exp (7.3%prior)
  • Trimmed-mean CPI (year on year): 6.9% vs 6.5% exp (6.1% previously)

image1.png

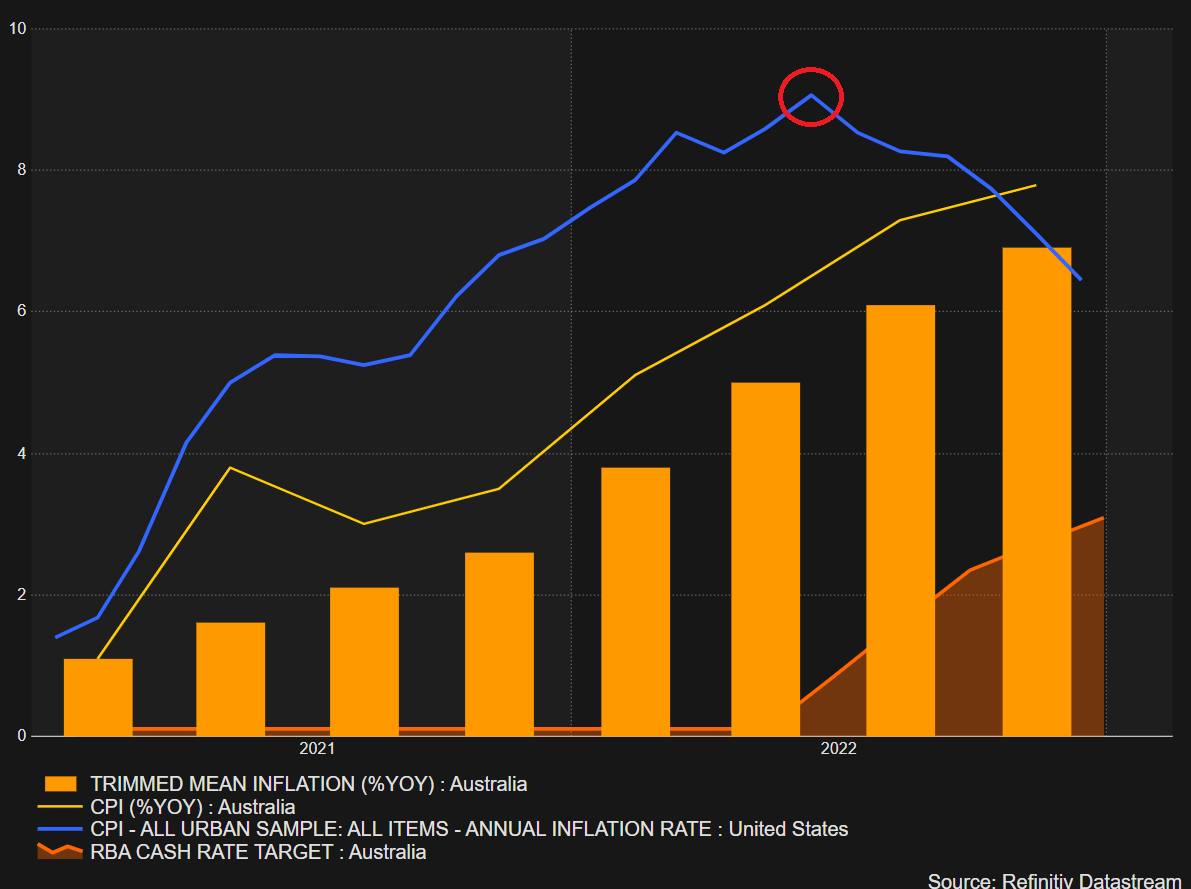
Australian headline inflation (CPI) continues to pick up, as does the preferred trimmed CPI, on both a month-on-month and year-on-year basis. The Reserve Bank of Australia (RBA) continues to hike interest rates and has decided to do so at a slower pace (increments of 25 basis points) since October of last year. However, it appears as if inflation is not following the trend seen in other prominent markets, mainly the United States.

The chart below reveals the stark difference in between Aussie and US inflation. US inflation (blue line) shows encouraging signs that headline inflation peaked last year while Australian CPI (yellow line) continues on its upward trajectory. The RBA will need to address these concerns in the upcoming meeting on February the 7th.

Australia is set to benefit from the Chinese reopening now that the Chinese government has stated that the nation has already reached a peak in infections and hospitalization rates. The reopening has resulted in increased purchases of Australia’s top export, iron ore, as prices have trended higher. While this is good news for the economy, the knock on effects this may have in regard to keeping inflation elevated will have to be monitored going forward.

Australian CPI Trends Compared to the United States

image2.png

Australian Dollar Technical Analysis

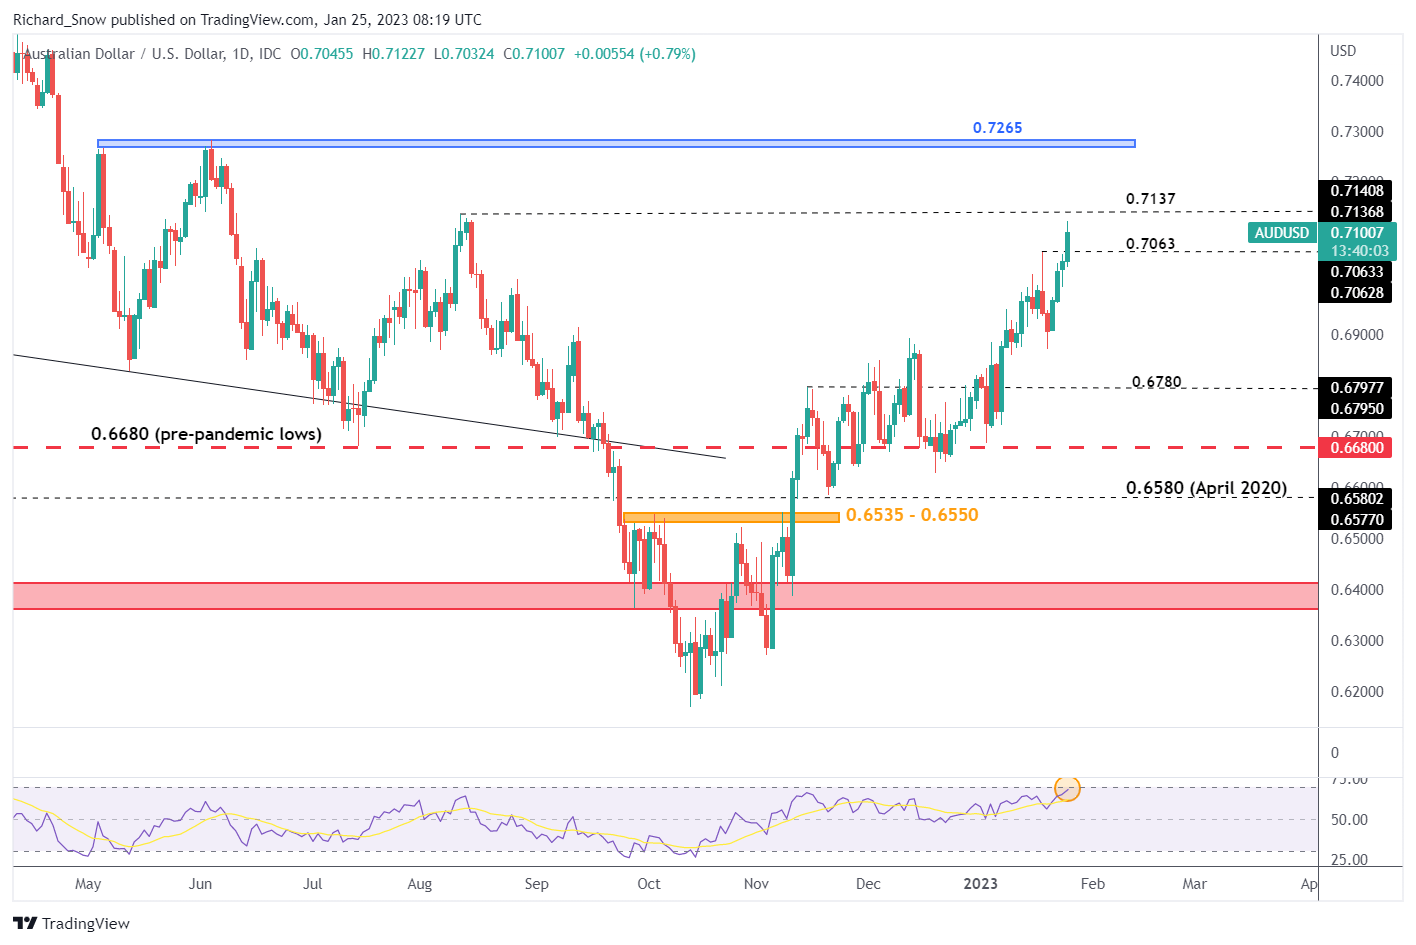
The AUD/USD pair has performed well during the early stages of 2023, helped in large part by the steady dollar downtrend and could possibly receive even further support if US GDP and US PCE data surprise to the upside on Thursday and Friday, respectively.

The pair trades to a 5-month high with the August 2022 swing high of 0.7137 very much in sight now, although, the RSI is nearing overbought territory which is something to monitor for a potential pullback. Support resides at 0.7063

AUD/USD Daily Chart

image3.png

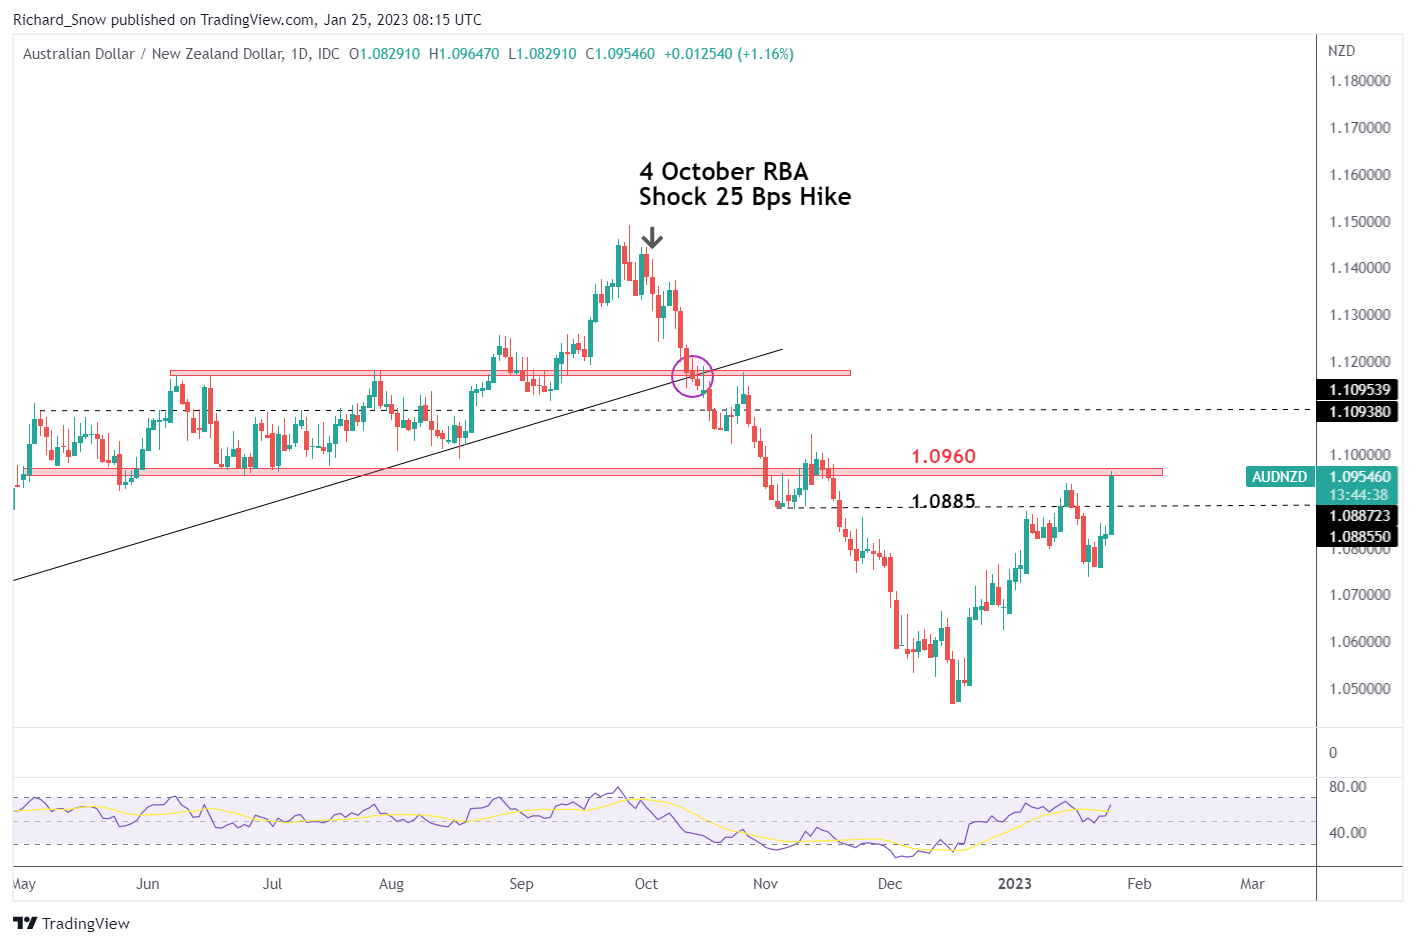
New Zealand also witnessed an inflation beat, although not of the same magnitude as Australia, which draws the focus to AUD/NZD which has advanced above 1% at the time of writing. The advance rose above the November low of 1.0885 with relative ease and now tests the zone of resistance around 1.0960. The early signs of a rejection of higher prices (evidenced by the upper wick) suggest a pause before contemplating a bullish continuation. Support comes in at 1.0885 (prior resistance).

AUD/NZD Daily Chart

image4.png


NZ: Two major bank economists have lowered their milk price forecasts as dairy prices hover near two-year lows

NZ: Two major bank economists have lowered their milk price forecasts as dairy prices hover near two-year lows

Fonterra may soon be forced to revise down again its forecast milk price for the current season if dairy prices don’t start to revive.

Prices again dipped slightly in the most recent GlobalDairyTrade auction and are now sitting at around two year-lows in US dollar prices.

Fonterra last updated its forecast price for the 2022-23 season in early December and currently has a (wide) range of $8.50-$9.50, giving and ‘implied’, mid-point, price of $9 per kilogram of milk solids.

But major bank economists are now seeing downside in the face of continued declines in global prices. It’s all a far cry from not so long ago when there were thoughts entertained of a bonanza $10 milk price – which would have been another record, beating the record of $9.30 in the 2021-22 season.

ASB economist Nat Keall said he had revised his Fonterra farmgate milk price for this season “to a still-strong $8.65 per kgMS”.

“The combination of a stronger NZD over the past couple of months and a more prolonged absence by Chinese buyers has meant a fairly hefty 85c revision to our prior forecast. Note that $8.65 per kgMS would still represent the second highest milk prices on record in nominal terms (after last season), and a price well above average in inflation adjusted terms.”

BNZ senior economist Doug Steel said the BNZ economists had have been relatively cautious on dairy prices for the past year.

“But the further weakening in prices since early December sees us nudge down our 2022-23 milk price forecast to $8.60. This is from the $8.90 that we had stuck to since first putting it on the board back in February last year despite significant volatility in the marketplace (market expectations had pushed up toward $10.70 at one point over that period).

“This is not a particularly big adjustment in the scheme of things, but it is nonetheless a downward shift. We will have no hesitation in revising back up if international prices dictate, but we feel that forecast error risks are currently better balanced around a somewhat lower point forecast.”

Steel says he currently sees more chance that the 2022-23 milk price finishes in the bottom half of Fonterra’s current $8.50 to $9.50 range than in the top half.

“But there is much changing overseas that could quickly change this assessment. There is still a fair amount of the season to run yet. A $8.60 milk price would still be high compared to history. But not quite as strong as it looks once higher costs are considered, although strong retro payments from the previous season will be supportive for many.

“And, at least for shared up Fonterra farmers, the co-op recently lifted earnings guidance and suggested it may do so again if positive earnings conditions extend. That would help offset some of the forecast decline from last season’s $9.30 milk price.”

Steel said on milk supply, the first half of NZ’s milking season has been poor with production down 2.8% on the corresponding period a year earlier.

“This will most likely see full season production lower than last season. But widespread New Year rain especially in the North Island – while too much in some areas – increases the chances that the second half of the season is better than the first half when compared to year earlier outcomes.

“Meanwhile, EU milk production picked up in the second half of last year. With most of the bloc’s country data submitted, November production looks to be up around 2.6% on a year ago. More milk accords with downward pressure on dairy product prices.”

Eurozone edges back into growth at start of 2023, selling price inflation ticks higher

Eurozone edges back into growth at start of 2023, selling price inflation ticks higher

The seasonally adjusted S&P Global ‘flash’ Eurozone PMI® Composite Output Index rose for a third consecutive month in January, up from 49.3 in December to 50.2 in January, breaking above the 50.0 no-change level to thereby indicate the first expansion of business activity – albeit only marginal – since last June. The preliminary flash reading is based on approximately 85% of usual survey responses, covering both manufacturing and services. January saw service sector activity rise for the first time since last July (the services business activity index rose from 49.8 to 50.7) while manufacturing output

Downward pressure on German business activity eases in January as inflation continues to slow and optimism returns

Downward pressure on German business activity eases in January as inflation continues to slow and optimism returns

The German services economy returned to growth in January, leaving the country’s overall private sector on a more stable footing at the start of the year, latest ‘flash’ PMI® data from S&P Global showed. Although still historically elevated, rates of inflation meanwhile continued to lose momentum, led by a notable cooling of manufacturing cost pressures as strain on supply chains eased. At the same time, there was renewed optimism among businesses towards the year-ahead outlook and signs of continued resilience in the labour market.

Introduction to Basic Trendline Analysis

Introduction to Basic Trendline Analysis

In this series we will piece together the anatomy of a swing trade and discuss the tools along with the methodology used to construct a basic trade setup. While no one single strategy is perfect, these best practices can be utilized in conjunction with your own trading strategy to identify more favorable entry / exit points in trending market environments.

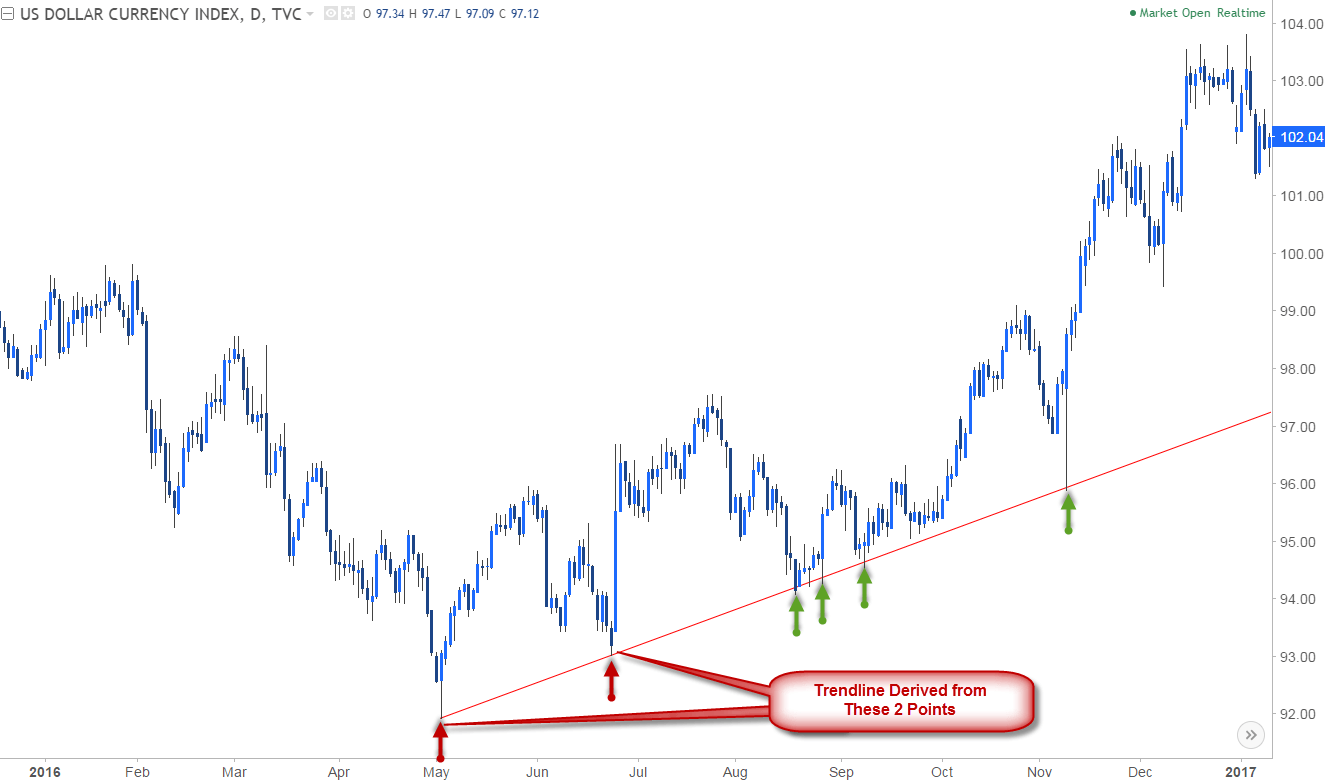
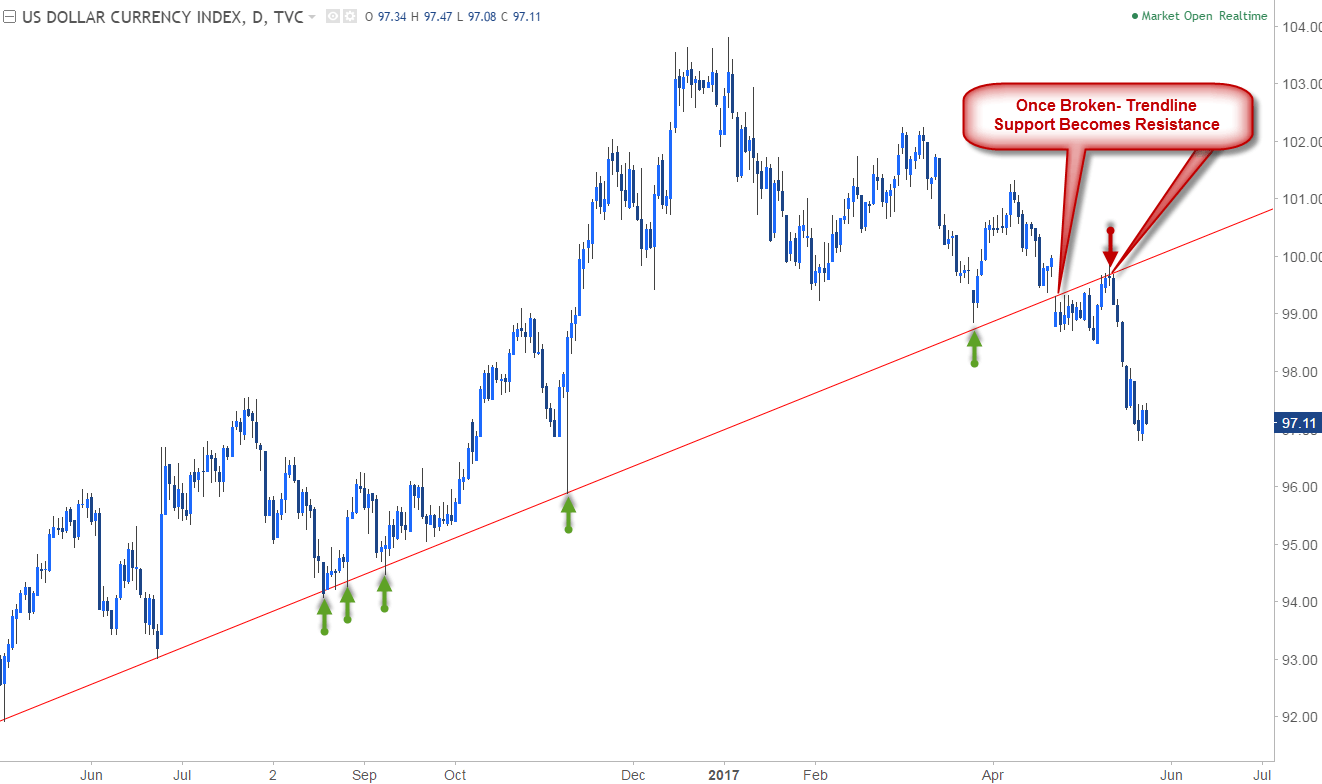
Trendlines are the simplest and single most important (and largely underutilized) tool in your trading arsenal. Extending a line off key highs & lows in price is an objective way of assessing the gradient or slope of a trending market. This key step can help identify where the price is likely to find support (floor) or resistance (ceiling).

DXY Daily Price Chart

Trendline Analysis on DXY Daily Chart

Note that trendline analysis can be viewed as more of an art form than a science as it requires some form of subjectivity. That said, when drawing trendlines, the more touch points the market has, the stronger conviction the slope offers. This means that the reaction off the trendline (slope) becomes increasingly effective.

In the example of the U.S. Dollar Index, the positive slope casts a bullish outlook, with the broad game plan to buy as price trends higher. So where should our entry point be? A pullback into trendline support would be the most favorable entry

Trendline Analysis on DXY Daily Chart

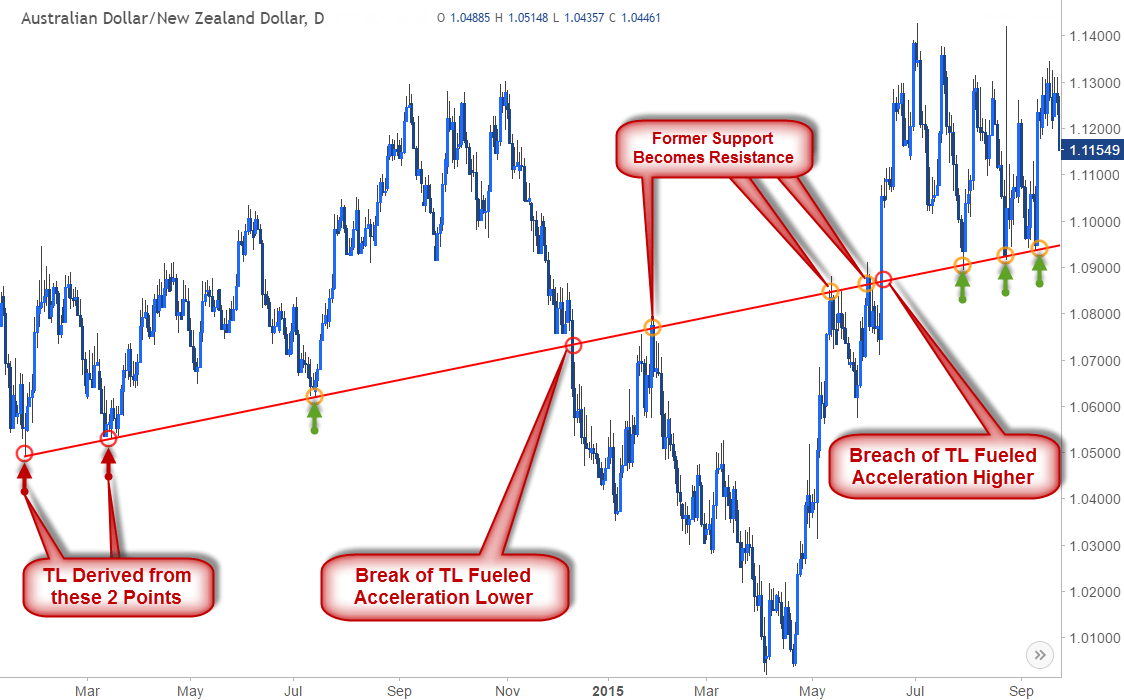
With the same respect, a break often offers sharper and more significant reversals. Once a trendline support is broken, the slope now becomes resistance for prices, and often foreshadows a change in market behavior. This slope can now be seen as a reference of invalidation for the current move lower.

AUD/NZD Daily Price Chart

Trendline Analysis on AUD/NZD Daily Chart.

Likewise, a breach above a trendline resistance sees that line as support for the subsequent move higher. The AUD/NZD example above shows how a single trendline can offer plays on both sides of the spectrum as support & resistance. Once the slope broke in December, if offered clear resistance on the subsequent rally in early 2015 before moving lower. Likewise, the breach above in June fueled a rally higher, which inevitably found support back at that same trendline.

Key Takeaways on Trendline Analysis

Some important aspects to keep in mind when drawing trendlines:

  • Two points is speculative, three points confirms– It’s important to note that any two reference points can offer a trendline- however it’s the third touch point that confirms the validity of the slope. Therefore before relying too heavily on a given gradient, look for that third touchpoint for conviction.
  • Assessing the break– You should always be trading under the assumption the trendline will hold- but when trying to ascertain whether price is actually breaking, one of the most important things to consider is timeframe. As a rule of thumb, I’ll typically look for a daily close to confirm or invalidate the break of a given trendline. However, when utilizing shorter time-frames price action will be the biggest tell- look for a reaction / change in behavior at the break with a pullback & retest of the slope as support/resistance to validate the break. We will discuss multi-timeframe analysis in more detail in part 3 of this series.
  • A break of a trendline should fuel acceleration- When a slope is broken as resistance or support, the subsequent move should see prices follow through in the direction of the break. If prices break and fail to accelerate in that direction, often times this will be a sign of a ‘false break’ scenario (also known as a ‘throw-over’). These exhaustion trades are typical in mature trends and can often precede key reversals in price.
  • Don’t chase the break– The way you will want to trade the breach of a trendline is to wait for a pullback in price to test the slope as support – your stop will be below this low. Likewise, on a break of support, wait for the market to retest the trendline as resistance- That pivot high will be your stop on the short.

This fundamental use of trendlines is constant across slope analysis and is the basis of the methodology. In part two we’ll introduce Pitchfork and medina-line analysis to help identify favorable targets (areas of support / resistance) within the context of a given trend.

Japanese Yen Steadies on PMI Data and Markets Assess Risks. Where to for USD/JPY?

Japanese Yen Steadies on PMI Data and Markets Assess Risks. Where to for USD/JPY?

The Japanese Yen gained slightly against the US Dollar today after the Jibun Bank composite PMI came in at 50.8 for January against 49.7 previously.

The manufacturing component was the same as last month’s 48.9 but the services piece was 52.4, above the prior read of 51.1. These are diffusion indices and a measure above 50 is seen as positive for the economy.

The Nikkei 225 index has had a decent rally, trading comfortably above 27,000 today and Australia’s ASX 200 saw modest gains. Most of the rest of the APAC region remains closed for Lunar New Year.

The moves followed a positive session on Wall Street that was led higher by the Nasdaq, which added 2.01%

Overnight, the ECB’s Christine Lagarde reiterated the bank’s mission to get inflation back down to its goal of 2%. Euro-zone year-on-year headline CPI to the end of December is 9.2%. EUR/USD is little changed so far today.

The US State Dept Special Envoy Robert Malley called out China’s continuing support of Iran oil purchases. Crude oil has also had a quiet Asian session in thin trading conditions.

The WTI futures contract is above US$ 81.50 bbl while the Brent contract is a touch over US$ 88.00 bbl. Gold is slightly firmer above US$ 1,930.

Looking ahead, today will PMI data across Europe, the UK and North America.

The full economic calendar can be viewed here.

USD/JPY TECHNICAL ANALYSIS

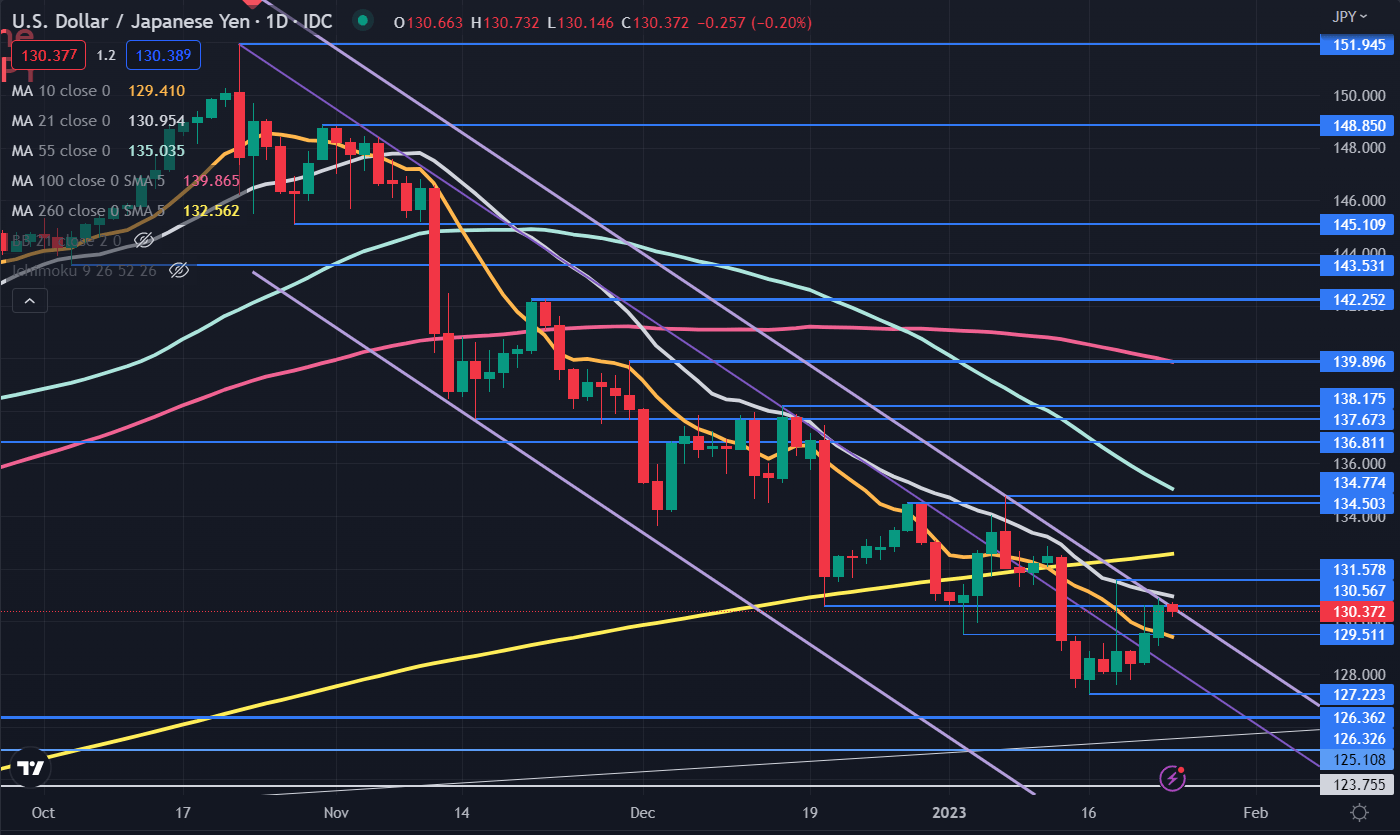
USD/JPY is pausing at resistance today after starting the week adding to gains seen on Friday.


The price remains in a descending trend channel, but it is currently bumping up against the upper bound of that channel.

The 21-day simple moving average (SMA) is just above that trendline and may also offer resistance ahead of last week’s high of 131.58.

Further up, resistance might be offered in the 134.50 – 134.75 zone where there are two prior peaks. The 55-day SMA is currently just above this area.

On the downside, support might lie at the April and May lows from last year at 125.11, 126.33 and 126.36. Last Monday’s low of 127.22 could provide close-by support.

image1.png


Learn to Take Losses Like a Winner

Learn to Take Losses Like a Winner

Nobody likes to be a loser, but taking losses well is required in order to be a winner. Just ask some of the most prolific hedge fund managers of all time. George Soros once said (I’m paraphrasing), it isn’t about being right, it’s about how much you make when you are right versus how much you lose when you are wrong.

Soros’ extremely successful disciple, Stanley Druckenmiller, once said in an interview that he estimates he is right about 60% of the time. This means he is wrong 40% of the time. Paul Tudor Jones, another billionaire macro legend, once said he is wrong about as often as he is right, but he also echoed Soros by saying that what matters the most is how much he makes on his winners when right versus how big the losses are when wrong.

That means that some of the most successful hedge fund managers in the world are wrong, a lot. And they don’t care because it is part of the game and not what really matters most. What they care about is managing the risk on their ideas and seeking asymmetry between their winning and losing ideas.

Accepting losing is of course easier said than done given it is human nature to dislike losing, so for many taking losses frequently can be a jagged pill to swallow. But you should embrace it, actually, because it is just part of the game and what will keep you in the game in the long run. Furthermore, the faster an idea hits its stop the faster you can move onto the next potential winner.

Not all losses are created equally. What should raise red flags is when you are constantly taking losses, or taking outsized losses relative to your wins. A loss could be a function of market conditions not conducive to your trading style/strategy, or it could be something deeper that implies you are not consistently following your trading rules.

When suffering a losing period (drawdown) take a close look at what you are doing. Examine your trade log, go through your journal, see if you are following your trading plan or deviating. If deviating, then you need to figure out what you need to do to get back on track. This is when losing isn’t acceptable, because it is self-inflicted.

However, if you are following your plan it could be a function of a market not conducive to your strategy, and while you should be flexible to adapting to market conditions, a solid time-proven strategy over multiple cycles should still come out ahead. The key here is to be consistent and seeing the strategy through the ups and downs.


litefinance-blog-audusd-05-04-22-768x419

Australian Dollar Eyes New Heights Ahead of Crucial CPI Data. Where to for AUD/USD?

The Australian Dollar is pushing toward the five-month high seen last week at 0.7063 as the US Dollar continues to come under pressure more broadly.

Several speakers from the Federal Reserve have recently stated that they now see hikes of 25 basis points (bp) as the appropriate pace of tightening in the upcoming Federal Open Market Committee (FOMC) meetings.

The futures and swaps interest rate markets are pencilling in such lifts at the February and March meetings but are then less enthusiastic about higher rates beyond there.

This perception around an end to further restrictive policy appears to have boosted equity markets and undermined the US Dollar.

On the domestic front, tomorrow’s climacteric quarterly CPI data will be closely scrutinised for clues on the Reserve Bank of Australia’s rate decision on the 7th of February. The futures market is undecided with a 14 bp increase in the cash rate priced in. Neither 25 bp nor ‘no change’ is clear cut.

A Bloomberg survey of economists is anticipating the headline Q/Q CPI to go from 1.8% to 1.6%, while for the Y/Y read, they are forecasting it to go from 7.6% to 7.8%. The discrepancy is explained by a lower quarterly number dropping out from the fourth quarter of 2021.

While CPI is the focus for the RBA’s mandate of targeting 2 – 3% over the business cycle, the Producer Price Index (PPI) could also play a role.

PPI is going to be released this Friday and if it has accelerated over the fourth quarter, it could present a problem for CPI through this quarter. Businesses that are facing higher costs at the farm and factory gate have two choices.

They can absorb the increases in costs and take a hit to earnings, or they can try and pass on the price rises to consumers. With the unemployment rate languishing near multi-generational lows at 3.5%, profit-motivated enterprises might be keen to pass on their cost increases and maintain their margins.

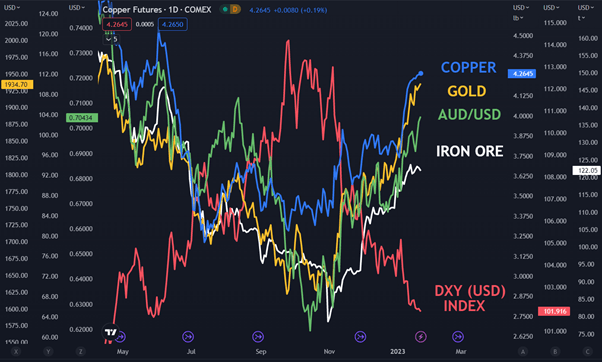
While China is on holiday this week for Lunar New Year celebrations, the re-opening story there continues to underpin commodity markets.

Many of Australia’s exports have seen notable price gains since the world’s second-largest economy pivoted on its Covid-19 policy. If this continues, it may augment AUD/USD.

AUD/USD, COPPER, GOLD, IRON ORE AND DXY (USD) INDEX


US Economic Update: 2022 Q4 GDP looks solid but weakness emerging

US Economic Update: 2022 Q4 GDP looks solid but weakness emerging

In our December update we noted that early data for Q4 was looking positive but that net trade was looming (again) as a large swing factor, this time in a negative direction. However, a plunge in goods imports in November (-7.4% m/m), even after allowing for another large fall in exports (-2.6%m/m), suggests that the net trade detraction will be much smaller than previously expected. As a result, we have substantially revised up our estimate for Q4 GDP to 2.7% q/q annualised (1.1% q/q previously). The BEA also revised up its estimate of growth in Q3 from 2.9% q/q to 3.2% q/q annualised.