HERE WE GO (again)
Rishi Sunak preparing ground to announce new Brexit deal on Monday
Potential Cabinet call on Sunday
Three-line whip for Tory MPs on Monday
BUT all hinges on DUP – further talks expected over weekendhttps://t.co/0YToh75vIZ
— Steven Swinford (@Steven_Swinford) February 24, 2023
US dollar steady on higher-for-longer rates outlook; yen volatile
LONDON : The dollar index rose to seven-week highs on Friday, as investors prepared for U.S. interest rates to stay higher for longer after a set of strong U.S. economic data.
The yen fell after a volatile Asian trading session, with incoming Bank of Japan Governor Kazuo Ueda saying it was appropriate to keep ultra-loose monetary policy.
Strong U.S. jobs data and rhetoric from Federal Reserve officials this month about openness to higher rates if needed in the fight against inflation have resulted in the dollar erasing its year-to-date losses.
The dollar index – which measures the U.S. currency against six others – was 0.2 per cent higher at 104.80, its highest since Jan. 6. It was set for a fourth-straight weekly gain, having risen 2.5 per cent this month.
“The dollar notching its fourth-consecutive week of gains highlights just how far the U-turn in the market narrative has gone as data this week continues to highlight strength in the U.S. economy and its underlying inflation drivers,” Simon Harvey, head of FX Analysis at Monex, said.
This will likely be displayed yet again with January’s personal consumption expenditures price index – the Fed’s preferred inflation measure – due at 1330 GMT. But markets will likely wait for more Fed comments and February data for further rate hikes repricing, Harvey added.
Investors expect U.S. rates to peak in July at 5.35 per cent and remain above 5 per cent until the end of the year, having walked back expectations of a deep rate cut this year.
“We’re in a bit of a wait-and-see pattern in markets, with the dollar holding up firm and momentum largely driving minor moves in major currency pairs,” Harvey said.
The euro edged 0.1 per cent lower against the greenback at $1.0583, and sterling slipped 0.27 per cent against the dollar to $1.1985.
UEDA, JAPAN INFLATION
Incoming BOJ chief Ueda, who was nominated earlier this month in a surprise move, warned uncertainties regarding Japan’s economic recovery remained “very high”, which would warrant the BOJ maintaining its ultra-loose monetary policy.
The yen was volatile, weakening 0.45 per cent to 135.29 per dollar, after touching its highest since Monday in Asian trading hours.
“His neutral comments, coming against market’s hawkish expectations and together with the rising global yields, suggest the yen could embark on a weakening trend again once we are past this volatility,” said Charu Chanana, market strategist at Saxo Markets in Singapore.
Japan’s core consumer inflation hit a fresh 41-year high in January, putting renewed pressure on the central bank to phase out its massive stimulus programme.
BoJ Gov Nominee Ueda: Inflation Rate is Peaking Out; Price Rises Will Continue but Rate of Inflation Will Slow Substantially From Next CPI Data
BoJ Gov Nominee Ueda: Inflation Rate is Peaking Out
– Price Rises Will Continue but Rate of Inflation Will Slow Substantially From Next CPI Data— *seven (@sevenloI) February 24, 2023
Euro Price Forecast: German GDP Dampens Strong EZ Data This Week, US Core PCE in Focus
EURO FUNDAMENTAL BACKDROP
The euro began the European trading session on the backfoot after worse than expected German GDP data (see economic calendar below) and GfK consumer confidence for March. The GDP numbers showed that the German economy contracted (-0.4%) in Q4 2022 and has brought back to the table “recessionary” talks.
EUR/USD ECONOMIC CALENDAR
This week we have seen mixed data from the eurozone including strong PMI flash and economic sentiment statistics while core inflation for January proved sticker than anticipated driving hawkish bets for the upcoming European Central Bank (ECB) interest rate decisions. The probability for two consecutive 50bps rate hikes in March and May are slowly growing – see table below and could lead to upcoming support for the euro. Unfortunately for the euro, these strong fundamentals have not really translated through to the euro itself primarily due to heightening geopolitical tension around Russia/Ukraine and US/China playing into the safe haven component of the greenback.
From a USD perspective, the Fed’s preferred measure of inflation via the PCE price index will be in focus later today and is projected to come in marginally lower than the prior print. Anything in line or higher could result in some added support for the dollar which may be added to through subsequent Fed officials and Michigan consumer sentiment data.
TECHNICAL ANALYSIS
EUR/USD DAILY CHART
Chart prepared by Warren Venketas, IG
Daily EUR/USD price action shows the recent deceleration in USD strength which is now represented by a falling wedge pattern (black). Naturally, I will be looking for an upside breakout above wedge resistance considering this is associated with a bullish turnaround which would therefore exposed the 1.0700 handle and beyond.
From a bearish standpoint, a candle close below wedge support would likely invalidate the falling wedge and expose the 1.0500 psychological support level which could coincide with an oversold Relative Strength Index (RSI). Bulls will likely defend this zone should the euro fall to this level. Fundamentally, the eurozone seems to be far more resilient than initially thought leaving more room for euro strength than USD strength particularly if geopolitics play its part.
EUR/USD Subdued as US Dollar Retains Upper Hand, Gold Can’t Shake Off the Blues
The US dollar, as measured by the DXY index, rose moderately on Thursday, touching seven-week highs near 104.70, as market sentiment remained fragile, depressing appetite for riskier currencies.
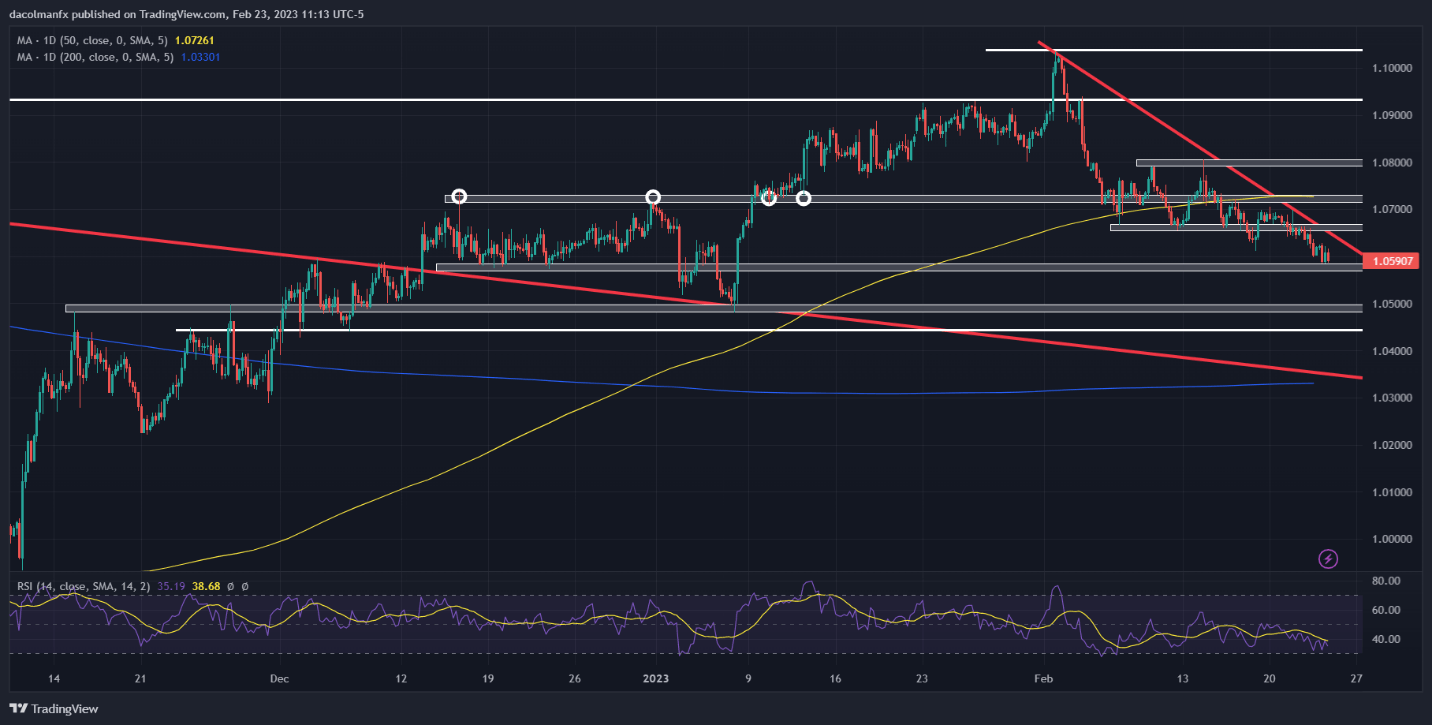
Against this backdrop, EUR/USD continued its descent, falling around 0.10% and breaking below the 1.0600 handle for the first time since early January. Gold prices also retreated, extending losses for the third consecutive session, and rapidly approaching the lowest level since December 30.
Looking ahead, there is reason to believe that the U.S. dollar could maintain leadership in the FX space, at least for some time, creating headwinds for both the euro and precious metals. This move is likely to be catalyzed by the continued rise in U.S. Treasury yields in response to the Federal Reserve’s assertive actions in its fight to restore price stability.
Sticky CPI, coupled with strong labor market data, have triggered a hawkish repricing of the FOMC‘s monetary policy outlook, leading Wall Street to discount a terminal rate of 5.37%, up from 4.90% at the beginning of the month. This essentially implies three additional 25 basis point hikes in the coming quarters.
The minutes of the central bank’s last gathering have reinforced current expectations. Based on the readout from Jan 31/Feb 1 meeting, policymakers remain committed to defeating chronically high inflation and anticipate further increases in borrowing costs, even if some officials are beginning to see greater risks of a recession.
All things being equal, the Fed’s hawkish stance should support the U.S. dollar in the short term by keeping nominal and real rates biased to the upside. This means that the euro and gold are standing on weak footing and could therefore extend their recent slump heading into March.
EUR/USD TECHNICAL ANALYSIS
After validating a double top pattern, EUR/USD has deepened its pullback, falling towards a key support slightly above 1.0575. If this area is breached on the downside in the coming days, sellers could launch an attack on the psychological 1.0500 level, followed by 1.0445. On the flip side, if price action reverses higher, trendline resistance appears near 1.0650. On further strength, the focus shifts to 1.0725.
EUR/USD TECHNICAL CHART
Bitcoin Falls as Nasdaq 100 Scores Wild Swings amid Fed Jitters, US PCE Data Ahead
The Nasdaq 100 rallied at the cash open as solid corporate earnings from chipmaker Nvidia bolstered positive sentiment, but optimism was short-lived as sellers quickly returned to fade the strength in the equity space amid Fed jitters. In late afternoon-trading, the tech index, however, resumed its advance, but wild intraday fluctuations suggest traders are reluctant to maintain heavy exposure ahead of Friday’s U.S. PCE data.
Elevated volatility and unpredictable market swings undermined cryptocurrencies, causing Bitcoin (BTC/USD) to erase its morning advance and to slide into negative territory for the third session in a row, a move that reinforces the argument that stocks and digital assets are becoming increasingly more correlated, providing little diversification benefit.
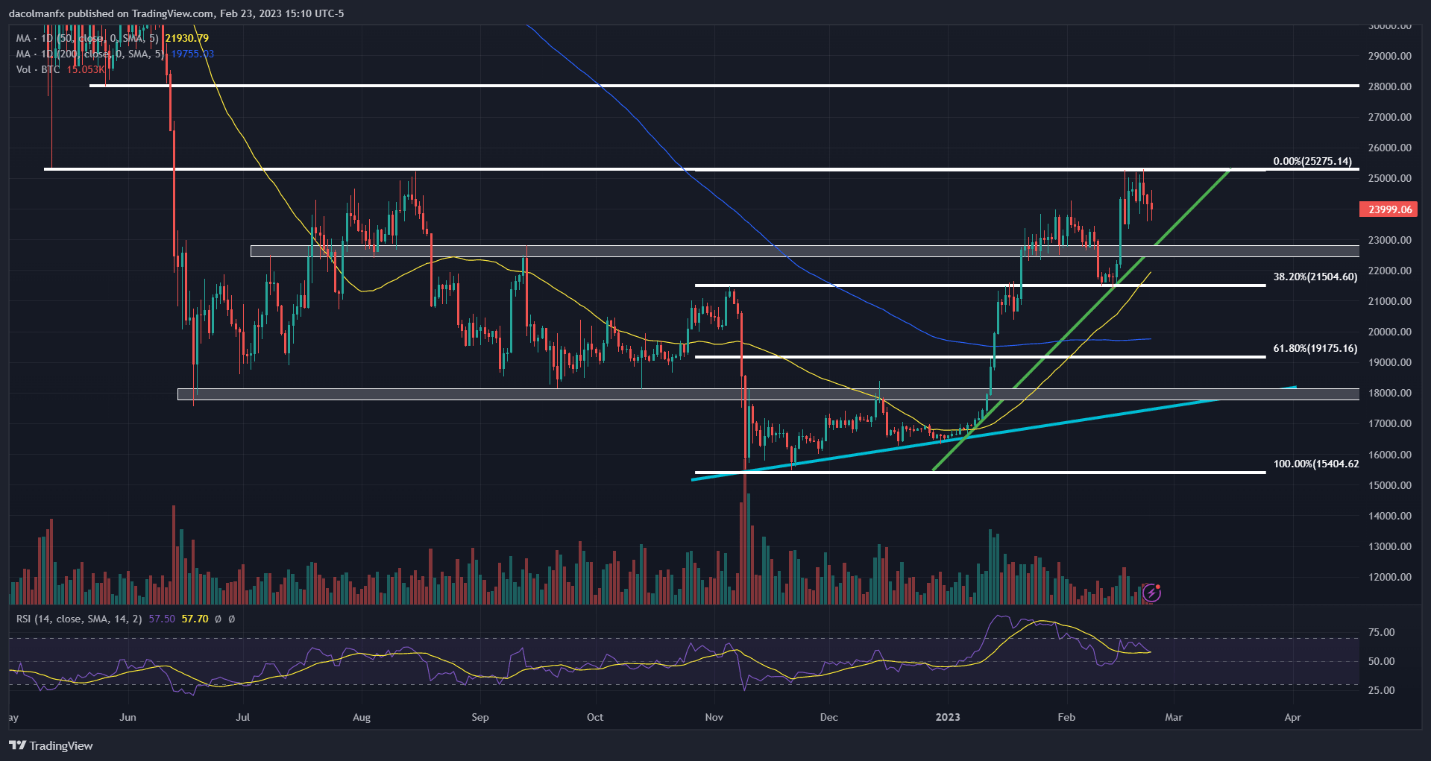
In any case, focusing on Bitcoin, the token has clearly run out of upside momentum following its solid performance in the early stages of 2023. In fact, prices have started to pull back after failing to break above $25,200, an area that has acted as a strong resistance in August last year.
While the recent pullback could be a temporary pause before the next leg higher, more technical evidence is needed to confirm that the worst in the crypto space is over and that Bitcoin could extend its near-term recovery.
BITCOIN TECHNICAL CHART
One signal that could point to a bullish continuation would be a clean and decisive topside breach of the $25,200 ceiling, especially if the move is accompanied by above-average volume. Such a breakout could attract new buyers to the market, at least in theory, setting the stage for a run towards the psychological $28,000 level.
On the other hand, if BTC/USD deepens its descent, traders should keep a close eye on trendline support crossing $23,000. If this floor is taken out, selling pressure could accelerate, creating the right conditions for a bearish slump towards $21,500, a pivotal support established by the 38.2% Fibonacci retracement of the November 2022/February 2023 rally.
With January Price Consumption Expenditure data on tap on Friday morning, volatility could spike heading into the weekend, causing sharp swings across assets. In terms of expectations, core PCE, the Fed’s favorite inflation indicator, is seen easing to 4.3% y-o-y from 4.4% y-o-y in December, a small but welcome directional improvement.
Recent economic data have shown that inflationary pressures remain sticky amid tight labor markets and resilient demand, so it is likely core PCE could surprise to the upside. This scenario may spark a risk-off move on Wall Street, weighing on stocks as well as cryptocurrencies.
Natural Gas Prices Rally the Most Over 2 Days Since November, Eyes on Resistance
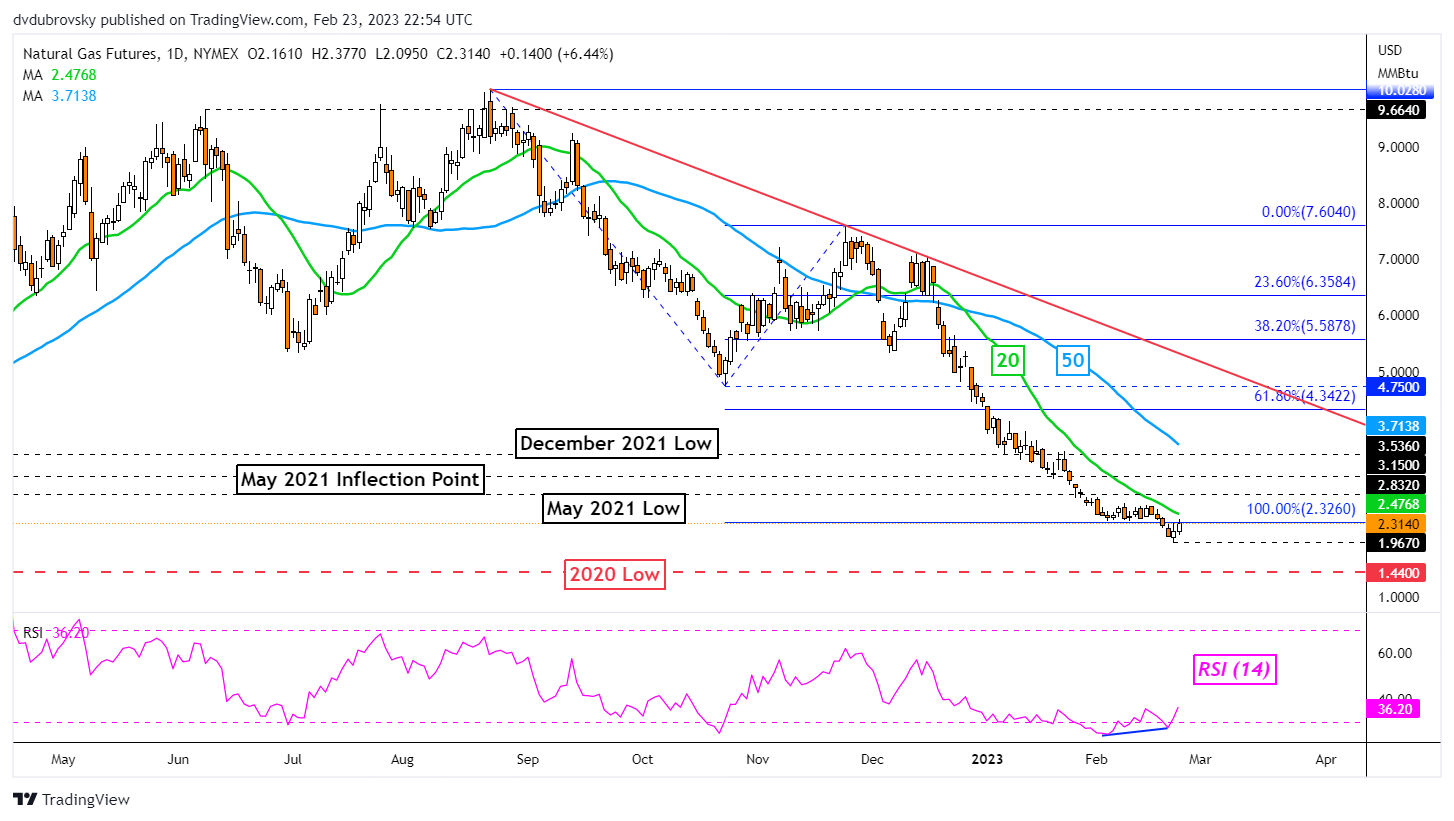
Daily Chart – Best 2-Day Rally Since November
Over the past 2 days, natural gas prices rallied over 11.5 percent, marking the best 48-hour period since early November. This followed the presence of positive RSI divergence, showing that downside momentum was fading. Is the heating commodity reading for a reversal? Or will the broader downtrend prevail?
On the daily chart below, natural gas finds itself revisiting the 100% Fibonacci extension level at 2.326. This was after prices established a new low at 1.967 before turning higher. Broadly speaking, a bearish Head & Shoulders chart formation remains in play, offering a downward technical bias towards the 2020 low at 1.44.
Immediate resistance is at 2.326. Breaking higher exposes the 20-day Simple Moving Average (SMA). The latter is helping maintain the downward focus and could play out as key resistance. Extending higher exposes the May 2021 low at 2.832.
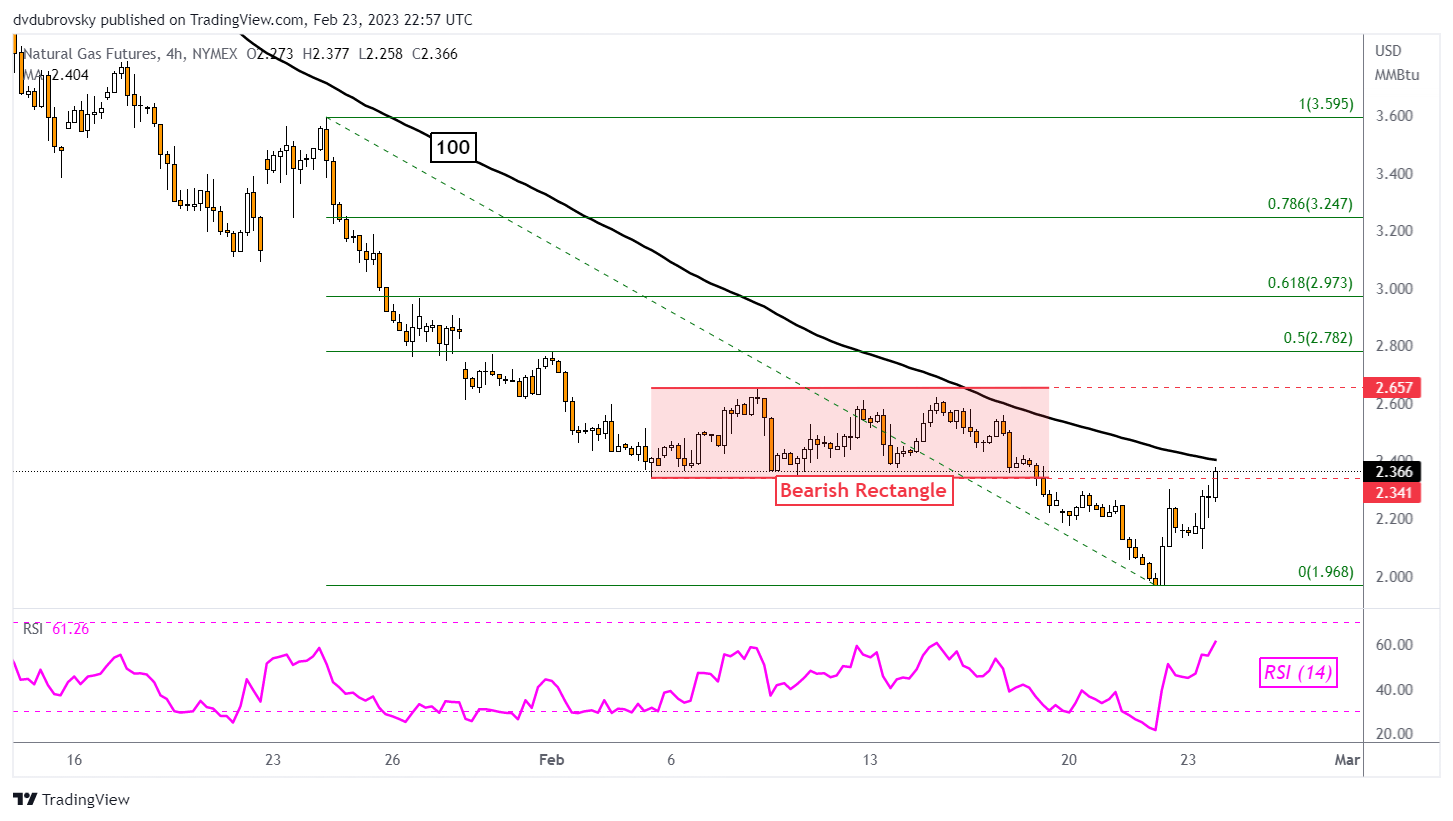
4-Hour Chart – Back in the Rectangle
Zooming in on the 4-hour chart will give us a better idea of how the near-term bounce is shaping up. Natural gas closed back into the former bearish Rectangle from early February. The floor was at 2.341. Still, confirmation is lacking at the time of publishing. Meanwhile, prices are about to face the 100-period SMA, which could maintain the downside bias.
A turn lower back under 2.341 places the focus on the current February low at 1.968. Otherwise, clearing the SMA places the focus on the ceiling of the rectangle around 2.657. Confirming a push above the latter could offer an increasingly bullish perspective.
US Dollar Price Action Setups: AUD/USD, EUR/USD, USD/JPY, GBP/USD
AUD/USD Daily Chart – Head & Shoulders Breakout in Play
The US Dollar may be setting the stage to extend gains against the Australian Dollar. AUD/USD has confirmed a breakout under a bearish Head & Shoulders chart formation after taking out the neckline around 0.6893. Immediate support is the 38.2% Fibonacci retracement level at 0.6781. Breaking under this price could open the door to extending losses toward the 61.8% level at 0.6547. Meanwhile, a bearish Death Cross between the 20- and 50-day Simple Moving Averages (SMAs) is likely on the horizon.
EUR/USD Daily Chart – Death Cross on the Horizon
The US Dollar may also be reading to continue its rise against the Euro. Looking at EUR/USD, a bearish Death Cross has formed between the 20- and 50-day SMAs. This followed a breakout under a bearish Rising Wedge chart formation that occurred back in January. Key support below appears to be the 38.2% Fibonacci retracement level at 1.0461. Beyond that is the midpoint at 1.0284. In the event of a turn higher, the SMAs could hold as resistance, maintaining the downside focus.
USD/JPY Daily Chart – Golden Cross in Play
The US Dollar has been pushing higher against the Japanese Yen in recent weeks. Eyeing USD/JPY, a bullish Golden Cross is in play between the 20- and 50-day SMAs. This follows a breakout above a key falling trendline from October, opening the door to a bullish reversal. Key resistance is the 38.2% Fibonacci retracement level at 136.66, followed by the midpoint at 139.58. Meanwhile, immediate support is at the 23.6% level at 133.05 as the 20-day SMA creeps higher. The latter could maintain a near-term upside focus.
GBP/USD Daily Chart – Eyes on 100-day SMA
The US Dollar remains in a neutral setting against the British Pound. GBP/USD has been consolidating since the end of November as a key zone of resistance was established between 1.2293 and 1.2444. Meanwhile, prices have been consistently bouncing off support around 1.1951, which is the 23.6% Fibonacci retracement level. The 100-day SMA is fast approaching, which could reinstate an upside focus. Otherwise, extending lower would offer a bearish outlook for the pair, placing the focus on the 1.1639 – 1.1738 inflection zone.
British Pound Price Setup: GBP/USD Looks Fragile Ahead of US PCE Data
The British pound is looking vulnerable as it tests crucial support against the US dollar ahead of the key US personal consumption expenditure price index data later today.
GBP/USD is near a vital converged floor of around 1.1840, including the early-January low, the 200-day moving average, and the lower edge of the Ichimoku cloud support. On the daily charts, the Plus Directional Movement Index (DMI) and Minus DMI remain below 25, pointing to range continued range conditions.
Price Facts, Sentiment, Narrative
However, the uptick in downward momentum on intraday charts raises the odds of a break below 1.1840 – see the 240-minute color-coded candlestick chart based on trending/momentum indicators.As highlighted in the previous update, any break below would trigger a minor double top (the December and January highs), potentially opening the way toward 1.1250. More importantly, such a break would disrupt the higher-top-higher-bottom pattern formed since September.
GBP/USD Daily Chart
The UK economy narrowly avoided a recession in the fourth quarter of last year, but recent upbeat UK manufacturing, services, and retail sales data indicate the economy could be more resilient than the actual numbers suggest. Money markets are starting to price in a third BOE rate hike to 4.75% by this summer (from the current Bank Rate of 4.00%), compared with two rate hikes before the turnaround higher in UK data from last week.
GBP/USD 240-minute Chart
Meanwhile, recent strong US data have prompted markets to price in three more Fed rate hikes, with the terminal rate now seen slightly above 5.30% by July. So far, the BOE hinted rates are near peak, while the Fed stopped short of indicating a pause at the last FOMC meeting (minutes of the meeting published this week also seemed to carry a hawkish tilt).
GBP/USD 240-minute Chart
Given that markets are fully pricing in 3 Fed rate hikes compared with 2 BOE rate hikes, the balance appears to be tilting in favour of USD. In this regard, US personal consumption expenditure price index data, Fed’s preferred inflation measure, due later today could provide some cues. US core PCE Index likely dropped to 4.3% on-year in January from 4.4% previously, but likely rose 0.4% on-month from 0.3% previously. A stronger-than-expected print could weigh on GBP/USD.
How to Read a Candlestick Chart
Reading candlestick charts – Talking points:
- Candlestick charts differ greatly from the traditional bar chart
- Traders generally prefer using candlestick charts for day-trading because they offer an enjoyable visual perception of price
- It’s important to understand the key components of a candle, and what they indicate, to apply candlestick chart analysis to a trading strategy
What is a candlestick chart?
A candlestick chart is simply a chart composed of individual candles, which traders use to understand price action. Candlestick price action involves pinpointing where the price opened for a period, where the price closed for a period, as well as the price highs and lows for a specific period.
Price action can give traders of all financial markets clues to trend and reversals. For example, groups of candlesticks can form patterns which occur throughout forex charts that could indicate reversals or continuation of trends. Candlesticks can also form individual formations which could indicate buy or sell entries in the market.
The period that each candle depicts depends on the time-frame chosen by the trader. A popular time-frame is the daily time-frame, so the candle will depict the open, close, and high and low for the day. The different components of a candle can help you forecast where the price might go, for instance if a candle closes far below its open it may indicate further price declines.
Boost your chart patterns expertise with our interactive quiz!
Our Forex Trading Patterns Quiz will test your knowledge of some of the most important trading patterns. Take the test today by clicking on the link and raise your technical analysis game!
Interpreting a candle on a candlestick chart
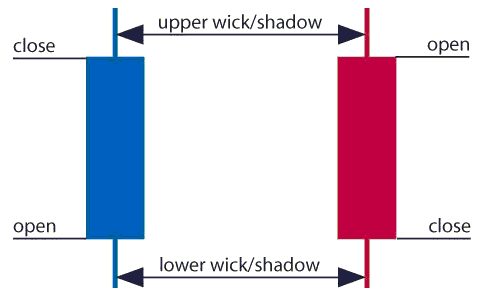
The image below represents the design of a typical candlestick. There are three specific points (open, close, wicks) used in the creation of a price candle. The first points to consider are the candles’ open and close prices. These points identify where the price of an asset begins and concludes for a selected period and will construct the body of a candle. Each candle depicts the price movement for a certain period that you choose when you look at the chart. If you are looking at a daily chart each individual candle will display the open, close, upper and lower wick of that day.
Open price:
The open price depicts the first price traded during the formation of the new candle. If the price starts to trend upwards the candle will turn green/blue (colors vary depending on chart settings). If the price declines the candle will turn red.
High Price:
The top of the upper wick/shadow indicates the highest price traded during the period. If there is no upper wick/shadow it means that the open price or the close price was the highest price traded.
Low Price:
The lowest price traded is the either the price at the bottom of the lower wick/shadow and if there is no lower wick/shadow then the lowest price traded is the same as the close price or open price in a bullish candle.
Close Price:
The close price is the last price traded during the period of the candle formation. If the close price is below the open price the candle will turn red as a default in most charting packages. If the close price is above the open price the candle will be green/blue (also depends on the chart settings).
The Wick:
The next important element of a candlestick is the wick, which is also referred to as a ‘shadow’. These points are vital as they show the extremes in price for a specific charting period. The wicks are quickly identifiable as they are visually thinner than the body of the candlestick. This is where the strength of candlesticks becomes apparent. Candlesticks can help traders keep our eye on market momentum and away from the static of price extremes.
Direction:
The direction of the price is indicated by the color of the candlestick. If the price of the candle is closing above the opening price of the candle, then the price is moving upwards and the candle would be green (the color of the candle depends on the chart settings). If the candle is red, then the price closed below the open.
Range:
The difference between the highest and lowest price of a candle is its range. You can calculate this by taking the price at the top of the upper wick and subtracting it from the price at the bottom of the lower wick. (Range = highest point – lowest point).
Having this knowledge of a candle, and what the points indicate, means traders using a candlestick chart have a clear advantage when it comes to distinguishing trendlines, price patterns and Elliot waves.
Bar Chart vs Candlestick Chart
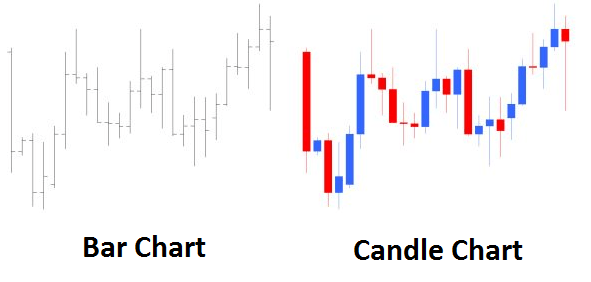
As you can see from the image below, candlestick charts offer a distinct advantage over bar charts. Bar charts are not as visual as candle charts and nor are the candle formations or price patterns. Also, the bars on the bar chart make it difficult to visualize which direction the price moved.
How to read a candlestick chart
There are various ways to use and read a candlestick chart. Candlestick chart analysis depends on your preferred trading strategy and time-frame. Some strategies attempt to take advantage of candle formations while others attempt to recognize price patterns.
Interpreting single candle formations
Individual candlesticks can offer a lot of insight into current market sentiment. Candlesticks like the Hammer, shooting star, and hanging man, offer clues as to changing momentum and potentially where the market prices maytrend.
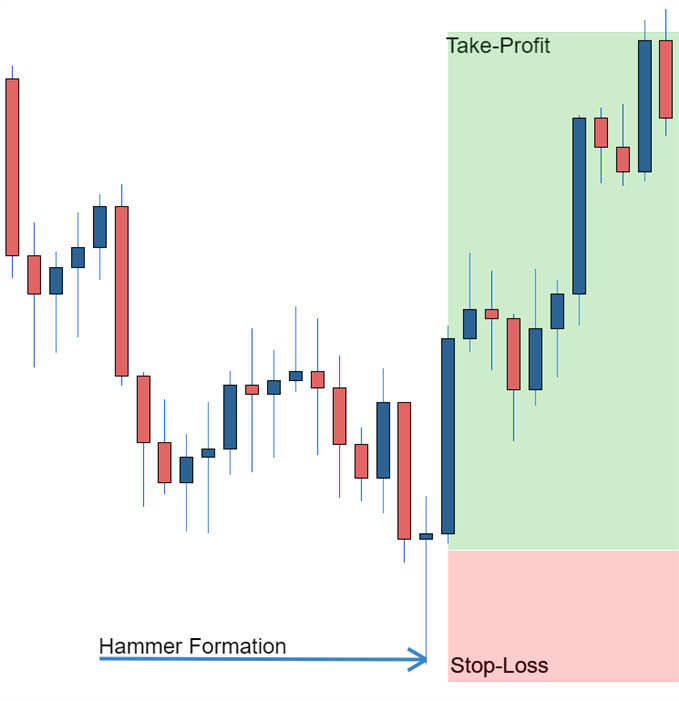
As you can see from the image below the Hammer candlestick formation sometimes indicates a reversal in trend. The hammer candle formation has a long lower wick with a small body. Its closing pricing is above its opening price. The intuition behind the hammer formation is simple, price tried to decline but buyers entered the market pushing the price up. It is a bullish signal to enter the market, tighten stop-losses or close out a short position.
Traders can take advantage of hammer formations by executing a long trade once the hammer candle has closed. Hammer candles are advantageous because traders can implement ‘tight’ stop-losses (stop-losses that risk a small amount of pips). Take-profits should be placed in such a way as to ensure a positive risk-reward ratio. So, the take-profit is larger than the stop-loss.
Recognizing price patterns in multiple candles
Candlestick charts help traders recognize price patterns that occur in the charts. By recognizing these price patterns, like the bullish engulfing pattern or triangle patterns you can take advantage of them by using them as entries into or exit signals out the market.
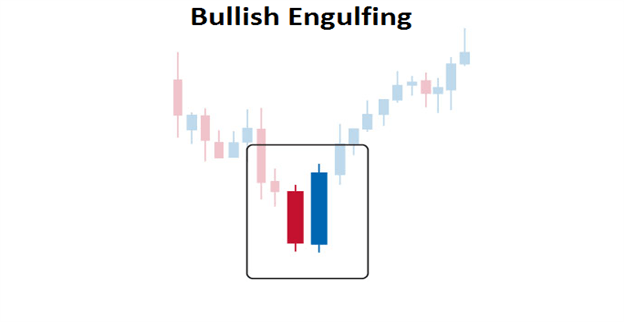
For example, in the image below we have the bullish engulfing price pattern. The bullish engulfing is a combination of a red candle and a blue candle that ‘engulfs’ the entire red candle. It is an indication that it could be the end of a currency pairs established weakness. A trader would take advantage of this by entering a long position after the blue candle closes. Remember, the price pattern only forms once the second candle closes.
As with the hammer formation, a trader would place a stop loss below the bullish engulfing pattern, ensuring a tight stop loss. The trader would then set a take-profit. For more forex candlestick charts check our forex candlesticks guide where we go in depth into the advantages of candlestick charts as well as the strategies that can be implemented using them.
Further tips for reading candlestick charts