GBP/USD sticks to the consolidative range near term – UOB

GBP/USD sticks to the consolidative range near term – UOB

Further range bound trade is still expected in GBP/USD, likely within 1.1950 and 1.2190, suggest Markets Strategist at UOB Group Quek Ser Leang and Senior FX Strategist Peter Chia.

Key Quotes

24-hour view: “We did not expect the sharp drop in GBP to 1.2012 yesterday (we were expecting GBP to trade sideways). Despite the decline, there is no significant increase in downward momentum. Today, GBP could drop further but any decline is likely part of a lower trading range of 1.2000/1.2150. In other words, a clear break of 1.2000 is unlikely.”

Next 1-3 weeks: “On Tuesday (14 Mar, spot at 1.2185), we highlighted that upward momentum is beginning to build but GBP has to break clearly above 1.2240 before a sustained advance is likely. We added, ‘the chance of a clear break above 1.2240 will remain intact as long as GBP stays above 1.2040’. GBP did not break 1.2240 but instead, dropped to a low of 1.2012 yesterday. Despite the relatively sharp drop, downward momentum has not improved much. For the time being, GBP is likely to trade in a broad range, expected to be between 1.1950 and 1.2190.”

USD Index retreats from weekly highs, back to the 104.50 zone

USD Index retreats from weekly highs, back to the 104.50 zone

The USD Index (DXY), which gauges the greenback vs. a bundle of its main competitors, gives away part of the recent advance and returns to the mid-104.00s on Thursday.

USD Index looks to data, ECB meeting

The index trades on the defensive and retreats below the 105.00 mark after two consecutive daily gains amidst mitigated risk aversion and a small recovery in US yields across the curve.

In the meantime, investors’ concerns around the banking system looks somewhat alleviated after Credit Suisse announced it will borrow CHF 50B from the Swiss National Bank (SNB), although the cautious stance still prevails ahead of the key interest rate decision by the European Central Bank (ECB) due later in the afternoon in the old continent.

In the US data space, usual weekly Initial Claims are due seconded by the Philly Fed Manufacturing Index, Building Permits and Housing Starts.

What to look for around USD

The index comes under pressure after hitting fresh tops past the 105.00 mark on Wednesday.

The risk aversion derived from banking jitters appears somewhat diminished and supports some selling pressure in the dollar amidst firmer conviction among investors of a 25 bps rate hike by the Federal Reserve at the March 22 meeting.

So far, the index remains under pressure against the backdrop of reinvigorated bets of a Fed’s pivot in the short-term horizon. However, the still elevated inflation and the resilience of the US economy continue to play against that view.

Key events in the US this week: Initial Jobless Claims, Housing Starts, Building Permits, Philly Fed Manufacturing Index (Thursday) – Industrial Production, Flash Michigan Consumer Sentiment, CB Leading Index (Friday).

Eminent issues on the back boiler: Rising conviction of a soft landing of the US economy. Persistent narrative for a Fed’s tighter-for-longer stance. Terminal rates near 5.5%? Fed’s pivot. Geopolitical effervescence vs. Russia and China. US-China trade conflict.

USD Index relevant levels

Now, the index is retreating 0.24% at 104.48 and the breakdown of 103.48 (monthly low March 13) would open the door to 102.58 (weekly low February 14) and finally 100.82 (2023 low February 2). On the other hand, the next hurdle emerges at 105.88 (2023 high March 8) seconded by 106.64 (200-day SMA) and then 107.19 (weekly high November 30 2022).

Gold Price Forecast: XAU/USD’s struggle with $1,919 extends amid banking crisis, ahead of ECB decision

Gold Price Forecast: XAU/USD’s struggle with $1,919 extends amid banking crisis, ahead of ECB decision

Gold price is back in the red zone early Thursday, having witnessed good two-way price action a day before. Gold price is retreating even though the United States Dollar (USD) is fading its recovery, as market nerves seem to be calming after the Credit Suisse crisis that erupted on Wednesday.

Credit Suisse crisis boosts demand for safe havens

On Wednesday, the market attention suddenly shifted back toward the banking crisis, this time in Europe, as investors fretted whether the US Silicon Valley Bank (SVB) fallout has reached European shores. Saudi National Bank, The largest shareholder of Credit Suisse Group AG, ruled out another call for additional liquidity. Credit Suisse slid as much as 24% to a new record low, as the credit default swaps tied to bonds issued by Credit Suisse soared to record levels.

In light of these developments, a flight to safety took over markets and intensified in no time, bolstering the demand for safe havens such as Gold price, US bonds and the United States Dollar. Meanwhile, US Treasury bond yields were sold off heavily alongside global stocks, as the renewed banking turmoil killed risk appetite. Gold price shot up from daily lows of $1,886 to reach as high as $1,937, its best levels since February 2. The benchmark 10-year US Treasury bond yields to six-week lows of 3.388% while the US Dollar Index jumped nearly 0.90% to briefly regain 105.00 at a point during the day.

Early Thursday, Swiss regulators stepped in to reassure global financial markets and soothed fears, allowing a brief relief rally in the US S&P 500 futures while the Asian indices continued to reel from the Wall Street pain. The US Dollar is consolidating the previous gains while the US Treasury bond yields attempt a tepid rebound. As a result, Gold price is feeling the pull of gravity but the downside appears cushioned amid looming banking sector risks worldwide.

European Central Bank decision next of note

Gold traders now look forward to the European Central Bank (ECB) monetary policy announcements for fresh trading impetus. Markets are now pricing a 20% probability of a 50 basis points (bps) ECB rate hike on Thursday, compared with a roughly 90% chance of the same a day earlier. If the ECB surprises with a 50 bps hike, then Gold price could see a fresh leg higher, as it would deepen fears over a potential banking rout.

However, a 25 bps rate hike from the ECB could signal that the central bank remains concerned about the tightening financial market conditions, hinting at a likely 25 bps Fed rate hike next week. In either case, Gold price is set to benefit but the extent of gains will be dependent on the US Dollar valuations and the dynamics of the yields.

Gold price technical analysis: Daily chart

Gold price stormed through the February 3 high of $1,919, the critical barrier, but failed to yield a daily closing above the latter.

The 14-day Relative Strength Index (RSI), however, continues to stay bullish above the midline, suggesting that there is more room to the upside.

Daily closing above the $1,919 barrier will initiate a fresh uptrend toward the year-to-date highs of $1,960. The previous day’s high of $1,937 could challenge the bearish commitments, at first.

Alternatively, the immediate downside could be tested at the $1,900 threshold, below which Tuesday’s low at $1,895 could come into the picture. Further south, the previous day’s low at $1,886 will lend some support to Gold buyers.

The last line of defense for them is seen at the mildly bullish 50-Daily Moving Average (DMA) at $1,877.

All in all, Gold price remains a ‘buy the dips’ trade amid looming banking sector risks across the globe.

EUR/JPY Price Analysis: Outsized pullback shifts the attention to the downside

EUR/JPY Price Analysis: Outsized pullback shifts the attention to the downside

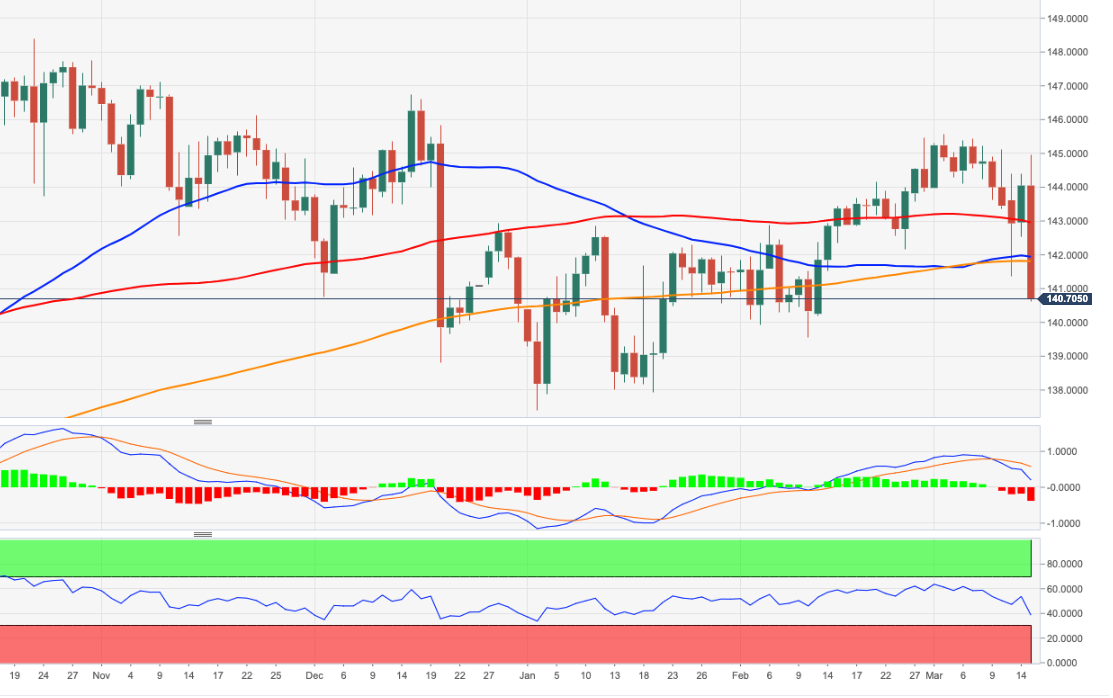
The abrupt sell-off forces EUR/JPY to break below the 141.00 mark and leave behind the key 200-day SMA at 141.77 at the same time.

The sharp retracement could now motivate the cross to challenge the February low at 139.54 (February 10), while the breach of the latter could put a potential drop to the 2023 low at 137.38 (January 3) back on the radar.

Below the 200-day SMA the outlook for the cross is expected to shift to negative.

EUR/JPY daily chart

EUR/JPY

USD/JPY: Close below 55-DMA at 132.50 to trigger a fall toward the 127.53/23 lows – Credit Suisse

USD/JPY: Close below 55-DMA at 132.50 to trigger a fall toward the 127.53/23 lows – Credit Suisse

USD/JPY looks to be staging a more decisive rejection from the 137.10/40 recovery target as looked for. Economists at Credit Suisse expect the broader downtrend to reassert itself.

Weekly close above 137.51 to open up next resistance at 139.54/59

“USD/JPY looks to have finally seen a more decisive rejection of our recovery target of the 200-DMA and 38.2% retracement of the 2022/2023 fall at 136.67/137.40 and we continue to look for the broader downtrend to reassert itself.”

“A close below the 55-DMA at 132.50 is needed to add weight to our view for a fall to support next at 129.80 and eventually the 127.53/23 lows again.”

“Above 137.51 on a weekly closing basis would suggest a more important low was established in January and strength can extend further with resistance next at the 50% retracement of the fall from October at 139.54/59.”

AUD/USD Price Forecast: Aussie Dollar Being Carried by Chinese Data

AUD/USD Price Forecast: Aussie Dollar Being Carried by Chinese Data

AUSTRALIAN DOLLAR FUNDAMENTAL BACKDROP

The Australian dollar looked to Chinese activity data (see economic calendar below) earlier this morning which came in rather mixed but overall positive for the Chinese economy. In particular, fixed asset investment jumped to 5.5%, highlighting a marked improvement in construction project investments. The slight optimistic slant to the data gave support to the Aussie dollar by way of a hopefulness in commodity exports. Being a pro-growth currency, the AUD responds well to encouraging growth data in from China being their largest importer of Australian commodities.

Later today, the economic calendar is focused solely on US data with the PPI and retail sales reports for February in focus. Both are expected to come in lower than prior releases which could see the U.S. dollar weaken further should actual numbers come in line with estimates. That being said, markets are still unsure of the Fed path forward considering yesterday’s US CPI provided little guidance. In addition, the Silicon Valley Bank (SIVB) and Signature Bank collapses are still being mulled over with regard to its systemic impact on the global economy.

ECONOMIC CALENDAR

image1.png

TECHNICAL ANALYSIS

AUD/USD DAILY CHART

image2.png

Daily AUD/USD price action now has the AUD marginally weaker against the USD year-to-date, wiping out all of it’s 2023 gains since early February. Sandwiched between the 0.6585 swing support low area and 0.6700 psychological handle, the pair looks towards some form of fundamental catalyst to give market participants a directional bias.

Looking at the Relative Strength Index (RSI) reading, the pair remains in bearish territory for now but a break above 0.6700 could push the level above the midpoint 50 level favoring upside momentum.

EUR/USD eases toward 1.0700 ahead of EU/US data

EUR/USD eases toward 1.0700 ahead of EU/US data

EUR/USD is retreating toward 1.0700 in early Europe. The US Dollar is finding its feet amid increased odds of a 25 bps March Fed rate hike. Meanwhile, fears calm over the SVB fallout but EUR/USD fails to capitalize ahead of Eurozone and US data.

The EUR/USD matched Monday’s high slightly below 1.0750 and pulled back to as low as 1.0677. The pair rose again toward recent highs during the American session, reflecting that the bullish momentum is still in place, but not strong enough for a break above 1.0750. The daily chart shows the price firm above the 20-day Simple Moving Average, which stands at 1.0630. Even a correction to the mentioned SMA would not change the positive outlook for the Euro. On the upside, the pair needs to surpass a series of important resistances between 1.0750 and 1.0780 in order to attract new buyers.

The 4-hour chart shows risks tilted to the upside, but EUR/USD needs to climb above 1.0750 over the subsequent sessions in order to avoid a deeper correction. The immediate target of a bearish move is the 1.0670 zone. Below, attention would turn to 1.0630/40, a critical uptrend line and the confluence of the 55- and 100-period Simple Moving Averages.

The EUR/USD continued its positive streak on Tuesday but failed again to break above 1.0750. The key driver in the short term continues to be a weaker US Dollar, which managed to stabilize, absorbing critical US economic data.

Data released on Tuesday showed US consumer inflation cooled marginally in February, in line with expectations. The Consumer Price Index slowed from 6.4% to 6%, and the core rate from 5.6% to 5.5%. US yields rose further afterwards, helping the US Dollar and then stabilized. On Wednesday, Retail Sales and the Producer Price Index will be released in the US. Those numbers and ongoing development regarding the banking crisis will be watched closely.

Markets have not heard from FOMC members as the blackout period started on Saturday ahead of the next meeting. Fed’s officials are likely taking into consideration the impact of the Silicon Valley Bank (SVB), although they are still thinking of continuing the tightening cycle, probably ending a little sooner than what they were forecasting last week. The Dollar could gain momentum if Fed tightening expectations recover to previous levels.

The European Central Bank (ECB) will have its policy meeting on Thursday. It is expected to align with its previously announced plans to hike interest rates by 50 basis points. However, recent market turmoil and a clouded outlook could lead to more opposition a the Governing Council to the hawkish guidance. On Wednesday, Eurostat will release Industrial Production data for January, and Germany will report on wholesale inflation.

National Economy Showed a Steady Recovery in the First Two Months

National Economy Showed a Steady Recovery in the First Two Months

  1. Recovery of Industrial Production Accelerated and Business Expectations Improved.

In the first two months, the total value added of the industrial enterprises above the designated size grew by 2.4 percent year on year, or 1.1 percentage points faster than that of December 2022; the average two-year growth was 4.9 percent. In terms of sectors, the value added of mining went up by 4.7 percent year on year, manufacturing up by 2.1 percent and the production and supply of electricity, thermal power, gas and water up by 2.4 percent. An analysis by types of ownership showed that the value added of state holding enterprises was up by 2.7 percent; that of share-holding enterprises was up by 4.3 percent; that of enterprises funded by foreign investors or investors from Hong Kong, Macao and Taiwan was down by 5.2 percent; and that of private enterprises was up by 2.0 percent. In term of products, the production of solar cells and new-energy vehicles grew by 40.8 percent and 16.3 percent respectively. In February, the total value added of the industrial enterprises above the designated size went up by 0.12 percent month on month. In February, the Manufacturing Purchasing Managers’ Index stood at 52.6 percent, 2.5 percentage points higher than that of the previous month; the Production and Operation Expectation Index was 57.5 percent, up by 1.9 percentage points.

  1. Service Sector Rebounded Markedly and Contact-and-Gathering-Based Services Improved.

In first two months, the Index of Services Production grew by 5.5 percent year on year, while that of December 2022 was down by 0.8 percent; the average two-year growth was 4.8 percent. Specifically, that of information transmission, software and information technology services and that of financial intermediation grew by 9.3 percent and 7.6 percent year on year respectively; that of accommodation and catering, transportation, storage and post, and retails and wholesales grew by 11.6 percent, 4.2 percent and 3.0 percent respectively. In February, the Business Activity Index for Services was 55.6 percent, 1.6 percentage points higher than the previous months. Specifically, the Business Activity Index for road transportation, air transportation, post, accommodation, leasing and business services stayed within the high expansion range of 60.0 percent and above. From the perspective of market expectation, the Business Activity Expectation Index for Services was 64.8 percent, 0.5 percentage points higher than the previous month.

  1. Market Sales Switched from Decline to Increase and Consumption on Goods for Basic Living and Upgraded Goods Grew Fast.

In the first two months, the total retail sales of consumer goods reached 7,706.7 billion yuan, up by 3.5 percent year on year, while that of December 2022 was down by 1.8 percent; the average two-year growth was 5.1 percent. Analyzed by different areas, the retail sales of consumer goods in urban areas reached 6,679.6 billion yuan, up by 3.4 percent year on year; and that in rural areas reached 1,027.1 billion yuan, up by 4.5 percent. Grouped by consumption patterns, the retail sales of goods were 6,863.8 billion yuan, up by 2.9 percent; the income of catering was 842.9 billion yuan, up by 9.2 percent. The sales of basic living goods grew fast. The retail sales of grain, oil and food and that of clothes, shoes, hats and textiles by enterprises above the designated size went up by 9.0 percent and 5.4 percent respectively. The sale of certain upgraded goods accelerated. The retail sales of gold, silver and jewelry, and cosmetics by enterprises above the designated size went up by 5.9 percent and 3.8 percent respectively. The online retail sales of consumer goods was 2,054.4 billion yuan, up by 6.2 percent. Specifically, the online retail sales of physical goods were 1,747.6 billion yuan, up by 5.3 percent, accounting for 22.7 percent of the total retail sales of consumer good. In February, the total retail sales of consumer good dropped by 0.02 percent compared with that of the previous month.

  1. Investment in Fixed Assets Grew Steadily and Investment in High-Tech Industries Went up Rapidly.

In the first two months, the investment in fixed assets (excluding rural households) reached 5,357.7 billion yuan, up by 5.5 percent year on year, 0.4 percentage points higher than that of the year 2022; the average two-year growth was 8.8 percent. Specifically, the investment in infrastructure grew by 9.0 percent year on year, that in manufacturing grew by 8.1 percent, and that in real estate development declined by 5.7 percent. The floor space of commercial buildings sold was 151.33 million square meters, down by 3.6 percent; the total sales of commercial buildings were 1,544.9 billion yuan, down by 0.1 percent. By industry, the investment in the primary industry went up by 1.5 percent, that in the secondary industry up by 10.1 percent, and that in the tertiary industry up by 3.8 percent. The private investment went up by 0.8 percent. The investment in high-tech industries grew by 15.1 percent, of which the investment in high-tech manufacturing and high-tech services grew by 16.2 percent and 12.3 percent respectively. In terms of high-tech manufacturing, the investment in manufacturing of medical equipment, measuring instrument and meter and in manufacturing of electronic and communication equipment grew by 21.3 percent and 20.5 percent respectively. In terms of high-tech services, the investment in services for transformation of scientific and technological achievements and in research, development and design services went up by 65.1 percent and 16.9 percent respectively. The investment in social sectors grew by 8.1 percent. Specifically, the investment in health sector and education sector grew by 18.8 percent and 4.8 percent respectively. In February, the investment in fixed assets (excluding rural households) increased by 0.72 percent over that of the previous month.

  1. Imports and Exports of Goods Dropped Slightly and Trade Structure Continued to Optimize.

In the first two months, the total value of imports and exports of goods was 6,176.8 billion yuan, down by 0.8 percent year on year. The value of exports was 3,493.6 billion yuan, up by 0.9 percent, and the value of imports was 2,683.3 billion yuan, down by 2.9 percent. The trade balance was 810.3 billion yuan in surplus. The import and export of general trade went up by 1.2 percent, accounting for 64.9 percent of the total value of the imports and exports, 1.3 percentage points higher than that of the same period of the previous year. The imports and exports by private enterprises went up by 5.3 percent, accounting for 51.2 percent of the total value of the imports and exports, 3.0 percentage points higher than the same period of the previous year. The exports of mechanical and electrical products went up by 0.4 percent, accounting for 58.0 percent of the total value of exports.

  1. Employment was Generally Stable and Urban Surveyed Unemployment Rate was Basically Steady.

In the first two months, the urban surveyed unemployment rate averaged 5.6 percent. In February, the urban surveyed unemployment rate was 5.6 percent, 0.1 percentage points higher than that of the previous month. The surveyed unemployment rate of population with local household registration was 5.4 percent and that of population with non-local household registration was 5.9 percent, among which, the rate of the population with non-local agricultural household registration was 6.0 percent. Specifically, the surveyed unemployment rate of the population aged from 16 to 24 was 18.1 percent, and that of the population aged from 25 to 59 was 4.8 percent. Among the population aged from 25 to 59, the surveyed unemployment rates of the population with junior secondary school education or below, with senior secondary school education, with junior college education, with university education or above were 5.7 percent, 5.2 percent, 4.1 percent and 3.0 percent respectively. The urban surveyed unemployment rate in 31 major cities was 5.7 percent. The employees of enterprises worked 47.9 hours per week on average.

 Consumer Price Grew Mildly and Producer Prices for Industrial Products Dropped Year on Year.

In the first two months, the consumer price index (CPI) went up by 1.5 percent year on year. Grouped by commodity categories, prices for food, tobacco and alcohol went up by 3.4 percent year on year; clothing up by 0.6 percent; housing down by 0.1 percent; articles and services for daily use up by 1.5 percent; transportation and communication up by 1.0 percent; education, culture and recreation up by 1.8 percent; medical services and health care up by 0.9 percent; and other articles and services up by 2.9 percent. Among the prices for food, tobacco and alcohol, the price for fresh vegetables went up by 1.3 percent, grain up by 2.7 percent, pork up by 7.9 percent, and fresh fruits up by 10.8 percent. The core CPI excluding the prices of food and energy went up by 0.8 percent year on year. In January, the consumer price index went up by 2.1 percent year on year, or up by 0.8 percent month on month. In February, the consumer price index went up by 1.0 percent year on year, or down by 0.5 percent month on month.

In the first two months, the producer prices for industrial products went down by 1.1 percent year on year. In January, the producer prices for industrial products went down by 0.8 percent year on year or down by 0.4 percent month on month. In February, it went down by 1.4 percent year on year, or maintained the same level as that of the previous month. In the first two months, the purchasing prices for industrial producers dropped by 0.2 percent year on year.

Generally speaking, in the first two months, under the strong leadership of the CPC Central Committee with Comrade Xi Jinping at its core, as the Covid-19 prevention and control switched to the new phase in a rapid and steady way, the unimpeded economic flow was accelerated, production and demand improved notably, and the economy showed a steady recovery. However, the external environment is even more complex, inadequate demand remains prominent and the foundation for economic recovery is not solid yet. At the next stage, we must take Xi Jinping Thought on Socialism with Chinese Characteristics for a New Era as the guideline, fully implement the spirits of the 20th CPC National Congress, the second plenary session of the 20th CPC Central Committee and the Central Economic Work Conference, follow the overall arrangement of the Government Work Report, and make economic stability our top priority and pursue progress while ensuring stability. We must apply the new development philosophy in full, in the right way and in all fields of endeavor, accelerate efforts to create a new pattern of development, strive to promote high-quality development, and expedite the implementation of policies. We must boost the market confidence, advance the overall improvement of the economic performance and endeavor to achieve effective enhancement of quality and reasonable growth of quantity.

 

New Zealand’s balance of payments deficit hits record $33.8 billion for year ended December

New Zealand’s balance of payments deficit hits record $33.8 billion for year ended December

The country’s balance of payments deficit has blown out to its highest level in 34 years on the back of a large trade deficit and closed borders.

The deficit between what the economy earns and what it spends hit $33.8 billion for the year ended December, equating to a record 8.9 percent of the value of the economy, the highest since the current series began in 1988.

Broadly speaking, the country is living well beyond its means, which is filled by borrowing.

Stats NZ senior manager Paul Pascoe said the increased deficit was due largely to an increase in the import of goods and services, notably machinery, fuel and vehicles, and an increase in travel costs.

“Since New Zealand’s borders opened more New Zealanders have been travelling overseas. The spending on both air transport and travel contributed to the rise in services imports for the year.”

Imports grew 25.8 percent while export earnings were up only 16.8 percent, with tourism, a key foreign exchange earner, still hampered by the slow recovery in world travel after Covid-19 restrictions were lifted.

Another factor in the deficit was foreign investors making more out of their investments in Aotearoa than New Zealanders did from their overseas holdings.

The data also showed an inflow of $3.3b into the country in the final three months of the year, which covered part of the deficit, while New Zealand investors scaled back their overseas investments to the tune of $4b compared to a $686m reduction in foreign investments here.

The difference between New Zealand’s financial assets and liabilities with the rest of the world narrowed slightly to a deficit of $193b, about half the value of the economy.

The size of the balance of payments deficit matters to ratings agencies, which could downgrade New Zealand’s rating making borrowing more expensive if there were concerns it was getting out of control.

An overheated economy

Economists said the blowout in the deficit was one of the prices being paid for an overheated economy.

Westpac’s acting chief economist Michael Gordon said the country had not adjusted its spending to match the impact of Covid-19 disruptions to exports, such as the big slump in tourism earnings, while rising interest rates had increased the repayments on borrowings.

“Monetary and fiscal stimulus in response to the Covid shock has left the economy overheated, as demonstrated by the extremely tight labour market and the surge in inflation.

“Essentially, we haven’t adjusted our spending patterns to reflect either the shortfall in our export income or the rise in the cost of living.”

BNZ senior economist Doug Steel agreed, adding: “It looks unsustainable, suggesting something has to give”.

He said the deficit was headed to break 9 percent of GDP or higher, and that would likely attract the attention of credit ratings agencies, sooner or later.

And on cue, S&P Global Ratings raised its eyebrows at the size and persistence of the deficit.

It said the deficit was at an extremely high level and much wider than expected.

“We would need to see the current account deficit narrow over the next 12 to 18 months and if it doesn’t there is going to be increased pressure on the AA+ rating,” S&P director Anthony Walker told the Bloomberg news service.

US Dollar’s Fate in Fed’s Hands After Hot Inflation Data; EUR/USD, GBP/USD Setups

US Dollar’s Fate in Fed’s Hands After Hot Inflation Data; EUR/USD, GBP/USD Setups

The U.S. dollar, as measured by the DXY index, was largely flat on Tuesday, oscillating between small gains and losses around the 103.65 level despite the moderate rebound in U.S. Treasury yields and uncomfortably high inflation data released this morning by the U.S. Bureau of Labor Statistics.

By way of context, February headline CPI clocked in at 0.5% m-o-m and 6.0% y-o-y, in line with estimates. However, the core gauge topped expectations, rising 0.5% m-o-m, the quickest pace in five months. With this result, the annual rate settled a little lower to 5.5% from 5.6%, a slow directional improvement.

Elevated inflationary pressures prompted traders to increase bets that the FOMC will raise rates by 25 basis points to 4.75-5.00% at its March meeting, with the probability of that outcome climbing to 74% versus 65% yesterday when expectations shifted in a more dovish direction following the U.S. banking sector turmoil.

While much higher rates are likely needed to restore price stability, it would not be surprising if the Fed adopted a more cautious approach at its next meeting, even if that contradicts Powell’s hawkish message delivered at his semi-annual appearance before Congress last week. This is because the landscape has changed dramatically in last few days.

Recent bank runs that led to the downfall of SVB and SBNY have exposed cracks in the banking ecosystem caused in part by overly restrictive monetary policy. The situation threatened to propagate rapidly that the Fed had to intervene to protect depositors, launching an emergency liquidity program to shore up struggling lenders.

All in all, systemic risks could throw a wrench in policymakers’ hiking plans, at least temporarily, pushing them to prioritize financial stability over their fight against inflation, which is a much slower-moving problem. The stars appear to be aligning for the FOMC guidance to lean on the dovish side next week.

Prior to events in the last few days, the U.S. dollar had strong bullish momentum, but the tide has turned with bears now in control, that’s the nature of the market. Barring strong episodes of risk aversion/flight to safety, the greenback could continue to retreat in the near term, especially if dovish expectations for the Fed come to fruition.

EUR/USD TECHNICAL ANALYSIS

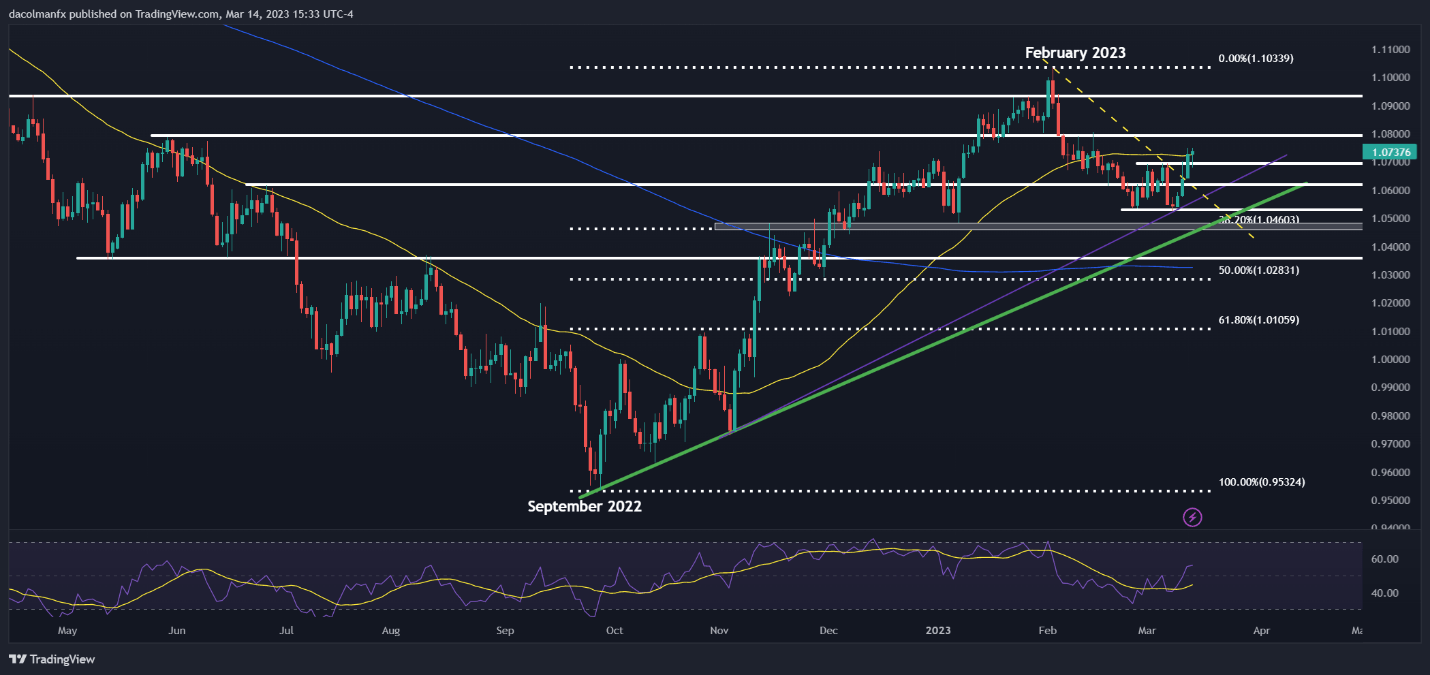
Last week, EUR/USD plunged towards a key support near 1.0535, but bulls defended this floor, paving the way for a strong rally off of those levels, with the exchange rate now above the 50-day moving average. If gains continue in the days ahead, resistance is seen at 1.0790, followed by 1.0935. On the flip side, if sellers return and spark a bearish reversal, support rests at 1.0700, and 1.0620 thereafter.

EUR/USD TECHNICAL CHART

Chart, histogram  Description automatically generated

GBP/USD TECHNICAL ANALYSIS

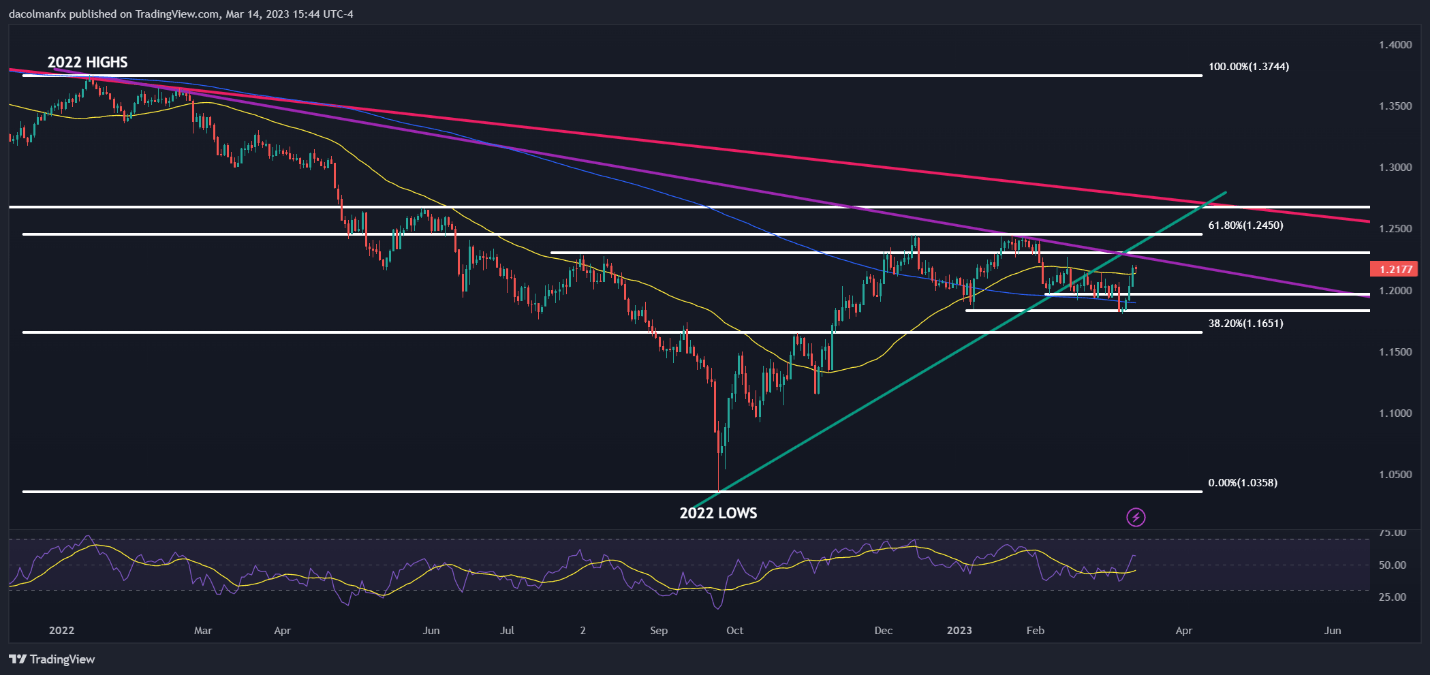
After its recent rebound, GBP/USD is quickly approaching cluster resistance in the 1.2275/1.2300 area, where last year’s August highs align with a medium-term descending trendline in play for more than 14 months. If bulls manage to push prices above this ceiling decisively, we could see a move towards 1.2450, the 61.8% Fib retracement of the 2022 sell-off. Conversely, if bearish pressure reemerges and cable pivots lower, support comes in at 1.1970, followed by 1.1825.

GBP/USD TECHNICAL CHART

Chart, histogram  Description automatically generated