Nasdaq 100 Outlook: Animal Spirits Set Free as Big Banks Unite to Save First Republic

Nasdaq 100 Outlook: Animal Spirits Set Free as Big Banks Unite to Save First Republic

The Nasdaq 100 surged on Thursday as market sentiment took a turn for the better after Credit Suisse tapped a lifeline from Swiss regulators and big U.S. financial firms joined forces to rescue First Republic Bank, a regional depository institution on the brink of failure following the collapse of SVB and SBNY.

In late afternoon operations, the Nasdaq 100 was on track for a daily gain of nearly 3%, trading at its highest level in a month (12,720), with Amazon, Alphabet and Nvidia rallying more than 4% despite the sharp rebound in Treasury yields, which saw the 2-year note rise more than 20 bps to 4.13% in a volatile session.

Investors cheered news that JPMorgan, Citigroup, Bank of America, Wells Fargo, Morgan Stanley and PNC have allegedly teamed up to deposit some $30 billion with First Republic Bank, in a U.S. government-led effort to shore up troubled lending institutions amid growing systemic risks.

Today’s developments, along with the Federal Reserve’s emergency measures put in place on Sunday to offer loans to regional lenders facing liquidity constraints, may temporarily ease Wall Street’s concerns about a banking sector meltdown, but the underlying malady is still unresolved and may flare up again soon.

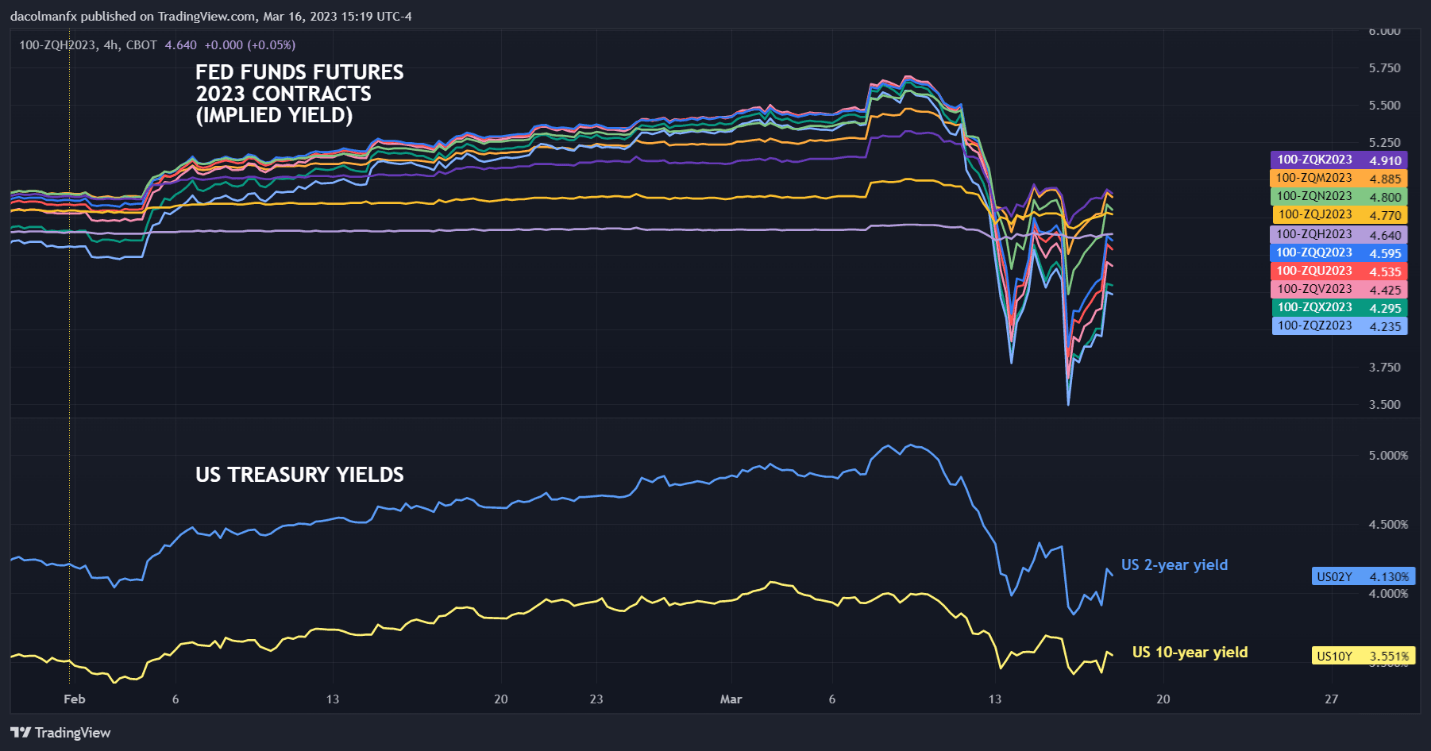
2023 FED FUTURES IMPLIED YIELDS & TREASURY RATES

Chart, histogram  Description automatically generated

Source: TradingView

Looking ahead, the equity market remains in a precarious position. Sentiment may seem to be on the mend following a couple of bullish days on Wall Street, but the broader outlook continues to be challenging in the face of sticky inflation and increasingly restrictive monetary policy.

After recent events, traders have repriced lower the Fed’s tightening path as seen in the chart above, but policymakers could push back against extremely dovish expectations if banking-system-related stress abates further in the coming days. We’ll know more next week when the FOMC announces its March decision, but this is a key risk to keep in mind.

NASDAQ 100 TECHNICAL ANALYSIS

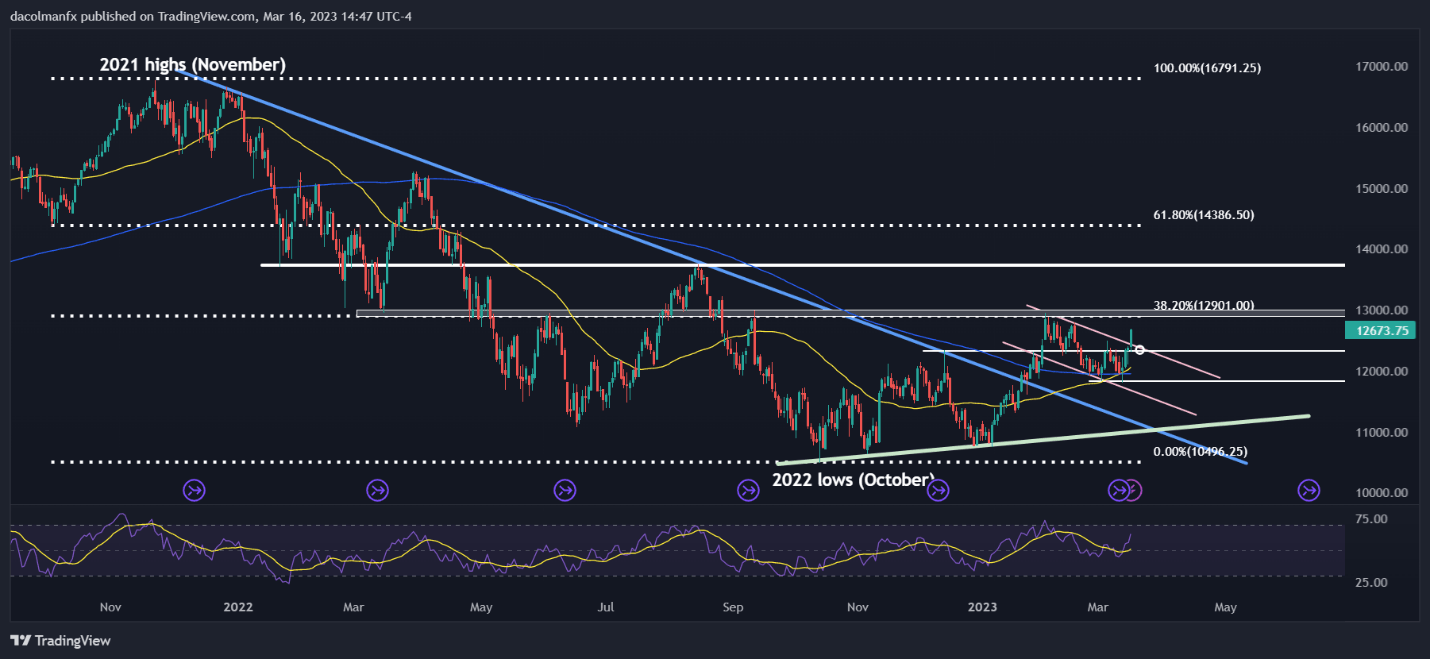
In terms of technical analysis, after breaking above trendline resistance, the Nasdaq 100 managed to hit its best level in four weeks, pointing to unleashed animal spirits. With momentum on its side, the tech index could soon recapture its 2023 highs around 12,900, an area of critical resistance created by the 38.2% Fib retracement of the November 2021/October 2022 sell-off. On further strength, the focus shifts to 13,745. In case of a bearish reversal, initial support rests at 12,350. Below that, the next floor to keep in mind corresponds to the 200-day simple moving average.

NASDAQ 100 TECHNICAL CHART

Graphical user interface, chart, histogram  Description automatically generated


US Dollar Gains as Fed Balance Sheet Swells, but it is Not What You Think

US Dollar Gains as Fed Balance Sheet Swells, but it is Not What You Think

Asia-Pacific Market Briefing – First Republic Bank, Fed Balance Sheet

The US Dollar outperformed its major counterparts on Thursday as financial market volatility continued cooling in the wake of last week’s collapse of Silicone Valley Bank. Reports crossed the wires that First Republic Bank, one of the regional lending institutions caught in the storm, was poised to receive about 30 billion of rescue aid from some of the nation’s largest banks.

Front-end Treasury yields rallied, with the 2-year rate soaring almost 7% over 24 hours. This suggests that perhaps some financial uncertainty was taken off the table, opening the door for the Federal Reserve to perhaps continue with its tightening operation to bring inflation down. The Dow Jones, S&P 500 and Nasdaq Composite rallied.

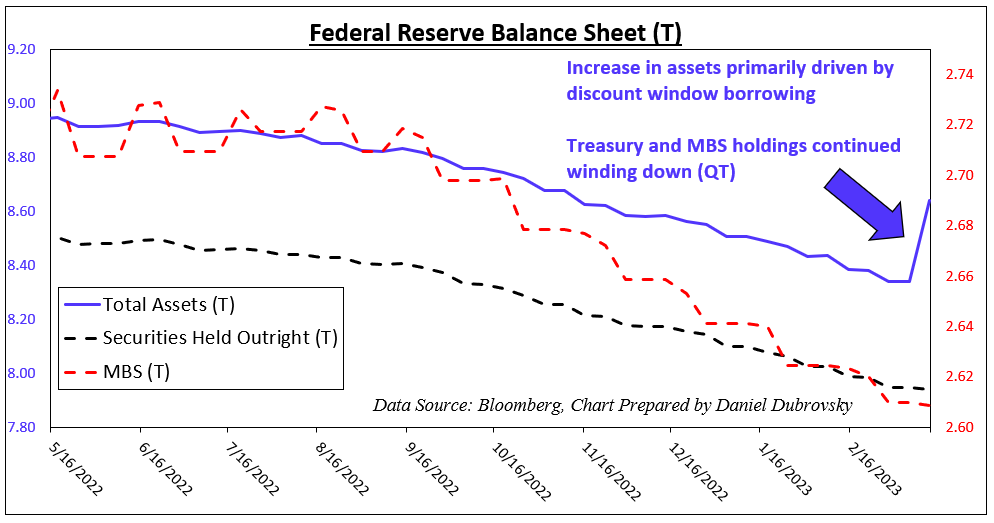
Meanwhile, it was revealed that the Fed’s balance sheet swelled by an impressive 300 billion. Make no mistake, this is not quantitative easing. On the chart below, you can see that while overall holdings rose, securities held outright (mostly Treasuries) and mortgage-backed securities (MBS) continued shrinking as one would expect under quantitative tightening.

Federal Reserve Balance Sheet

Federal Reserve Balance Sheet

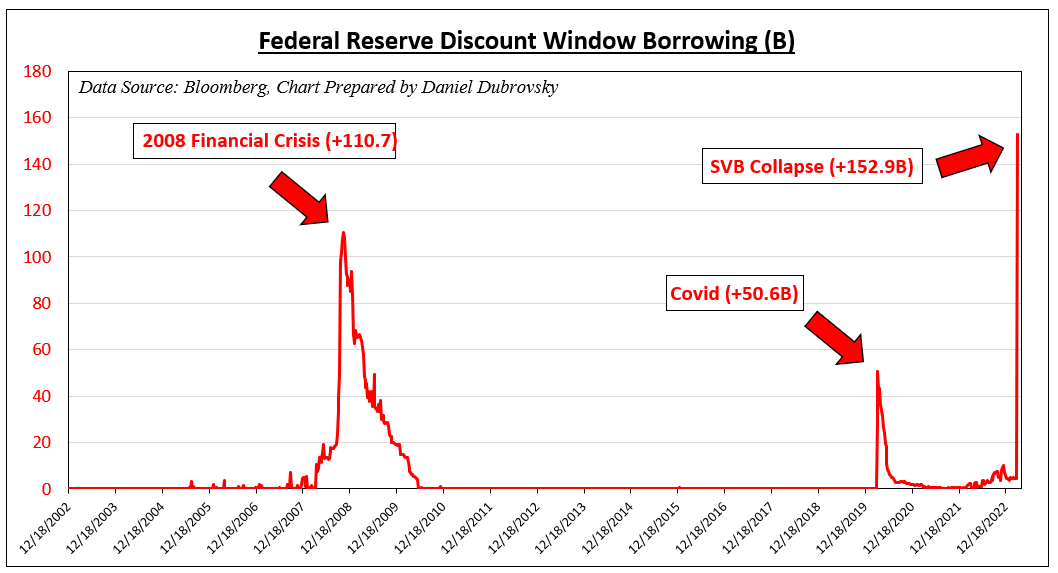
What ballooned was discount window lending, soaring to 152.9 billion last week. That was more than what was witnessed during the 2008 Financial Crisis and the 2020 Covid pandemic. Discount window lending primarily serves as a safety valve and an extension of credit to alleviate liquidity strains. It is a separate short-term mechanism from the current medium-term rate hike/QT regime. You can see how temporary it can be in the chart below.

Discount Window Borrowing

Discount Window Borrowing

US Dollar Technical Analysis

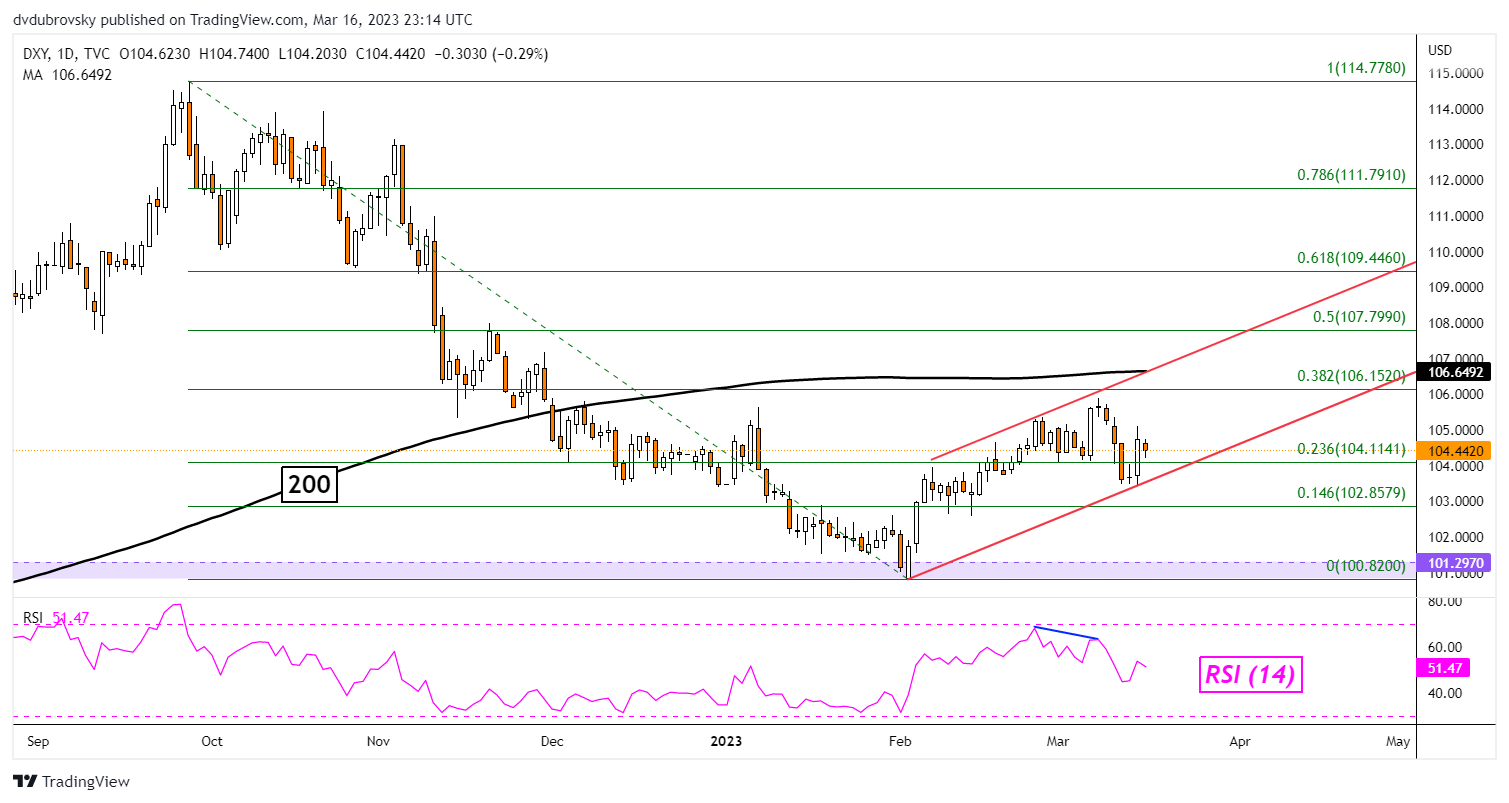
Looking at the daily chart, the DXY Dollar Index bounced off the floor of an Ascending Channel that was established back in February. This could open the door to cautious uptrend resumption. Immediate resistance seems to be the 38.2% Fibonacci retracement level at 106.152 as well as the 200-day Simple Moving Average (SMA).

DXY Daily Chart

DXY Daily Chart

Crude Oil Prices Face Competing Themes: Cooling Bank Volatility & Fed Policy Bets

Crude Oil Prices Face Competing Themes: Cooling Bank Volatility & Fed Policy Bets

WTI crude oil prices traded relatively flat over the past 24 hours in an overall volatile trading session. On the one hand, reports crossed the wires that First Republic Bank was poised to receive emergency aid to the tune of 30 billion from major lenders. But, because of cooling woes in the financial sector, Treasury yields were pushed higher.

The latter speaks to traders pricing out anticipated rate cuts from the Federal Reserve later this year because of last week’s Silicon Valley Bank collapse. Market-implied policy rates have added back about 50 basis points in tightening for the 3-month horizon. That would leave rates around 5% instead of the 4.5% seen earlier in the week.

As such, sentiment-linked crude oil faced opposing fundamental forces. On the one hand, risk appetite improved. On the other hand, a Fed that can continue tightening could bode ill for future oil demand. Looking at the remaining 24 hours, eyes turn to the University of Michigan Sentiment data at 14:00 GMT. A softer outcome speaking to worried consumers may renew selling pressure for WTI.

Crude Oil Technical Analysis – Daily Chart

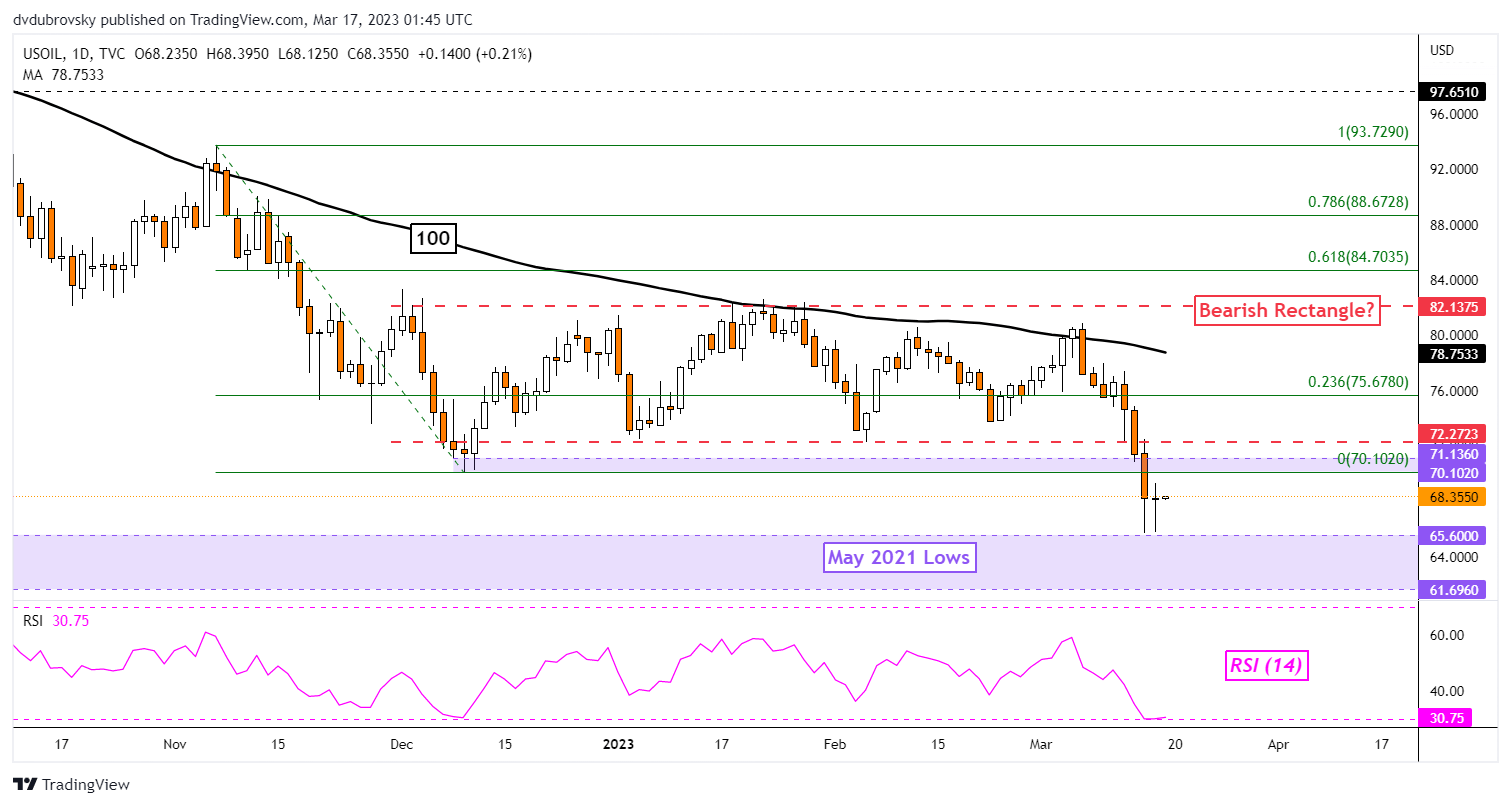
On the daily chart, crude oil confirmed a breakout under a Bearish Rectangle chart formation. That may open the door to downtrend resumption. Key support seems to be a wide range between 61.69 and 65.60. The latter was established in May 2021. On the other hand, turning higher would place the focus on the December low at 70.10, which may hold as resistance.

Crude Oil Technical Analysis – Daily Chart

Chart Created Using TradingView

Crude Oil Sentiment Analysis – Bearish

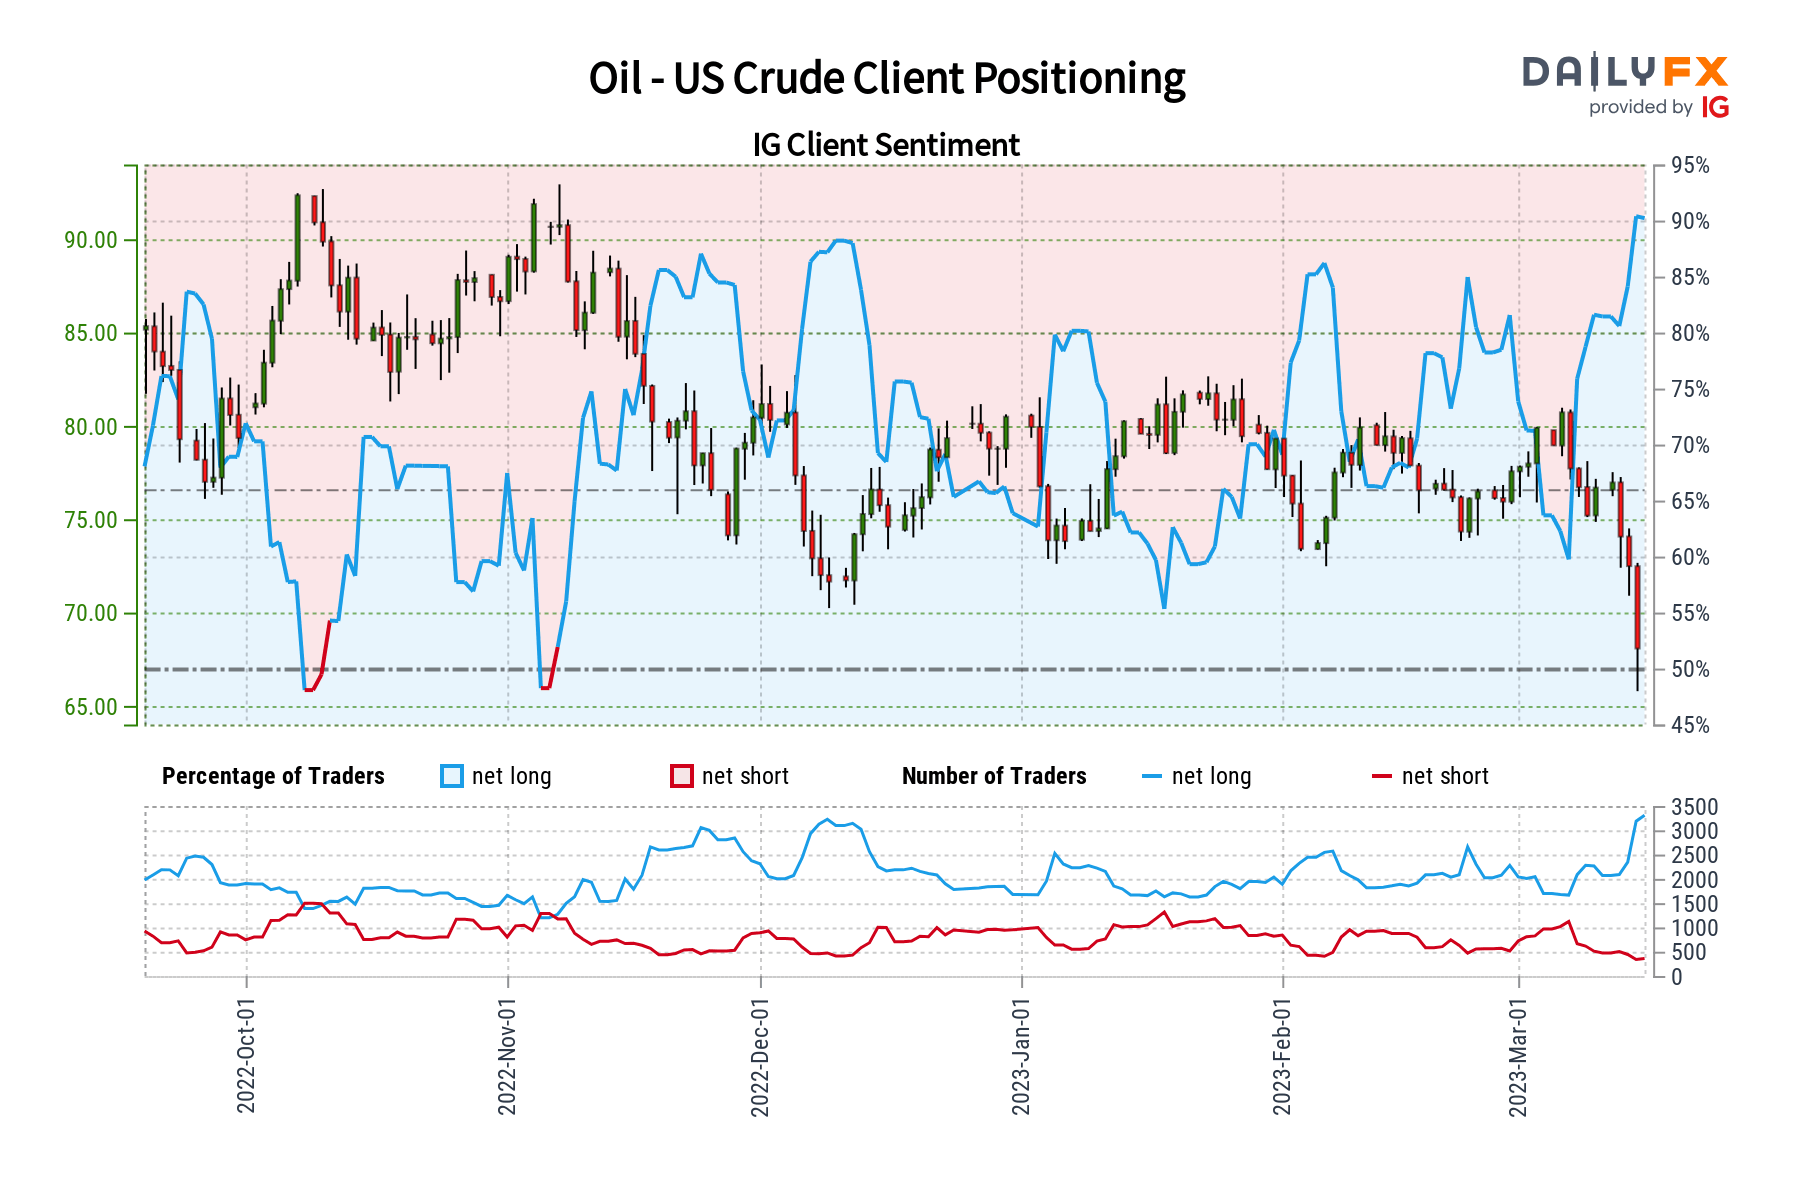
Looking at IG Client Sentiment (IGCS), which tends to function as a contrarian indicator, about 90% of retail traders are net-long crude oil. Since most of them are long, this hints prices may fall. Upside exposure fell by 2.86% compared to yesterday. But, compared to last week, net-long bets soared almost 50%. With that in mind, the combination of overall positioning and recent changes in exposure is offering a bearish contrarian trading bias.

Crude Oil Sentiment Analysis - Bearish

Trading the London Session: Guide for Forex Traders

Trading the London Session: Guide for Forex Traders

The London trading session accounts for around 35% of total average forex turnover*, the largest amount relative to its peers. The London forex session also overlaps with the New York session throughout the year.

What time does the London forex market open?

The London forex market hours are from 3:00 AM ET to 12:00 PM ET. The London forex market session sees the most forex volume of all the forex market sessions.

Time in ET.

Open 3:00 AM
Close 12:00 PM
Overlap with Asia session 3:00 AM – 4:00 AM
Overlap with New York session 8:00 AM – 12:00 PM

Top 3 things to know about the London trading session

1. The London session is fast and active

The slower Tokyo market will lead into the London session, and as prices begin to move from liquidity providers based in the United Kingdom, traders can usually see increases in volatility.

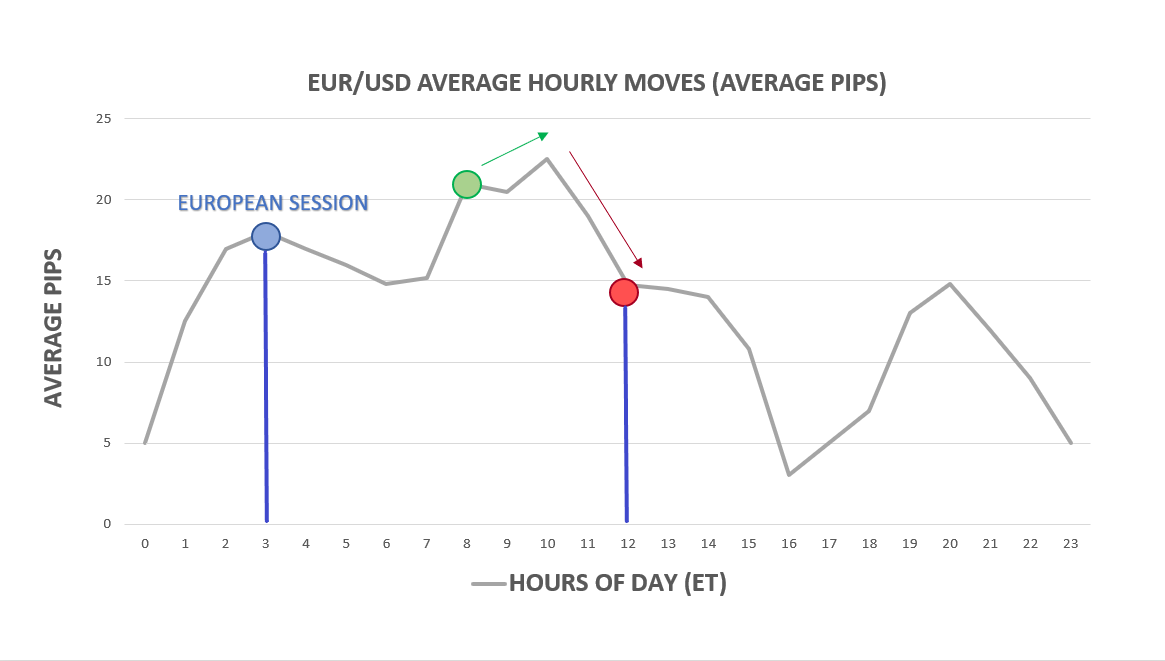
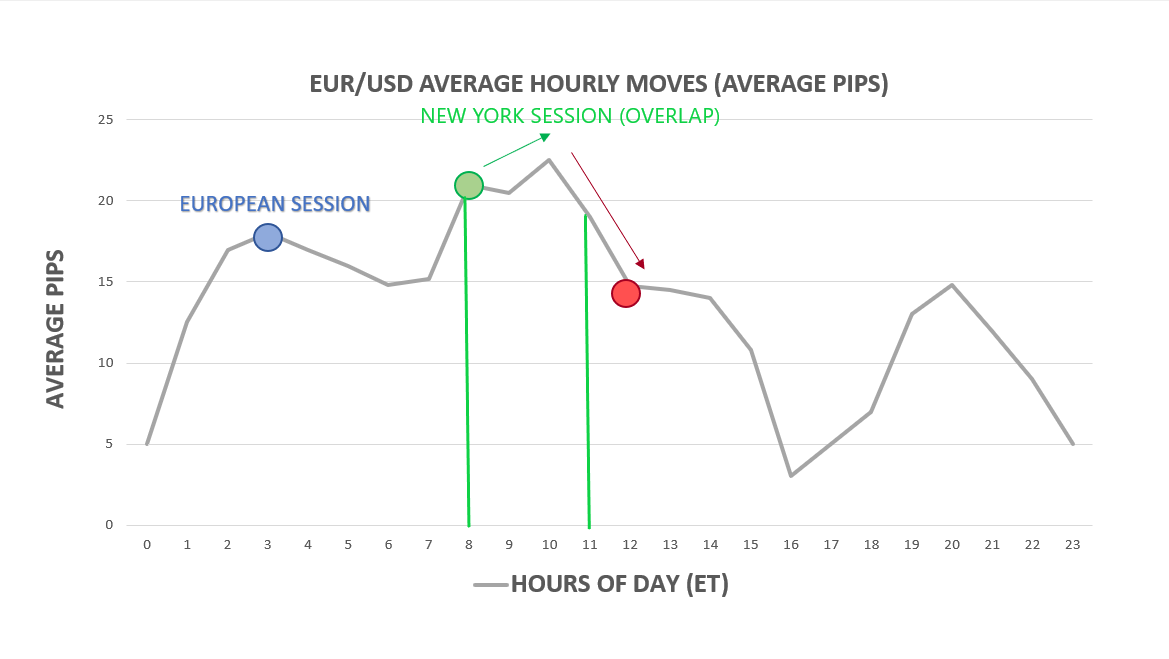
As prices begin to come in from London, the ‘average hourly move’ on many of the major currency pairs will often increase. Below is analysis on EUR/USD based on the time of day. Notice how much greater these moves are, on average, after the Asian session closes (Asia session closes at 3AM ET-blue dot):

Average hourly moves by hour of day in EUR/USD

Support and resistance may be broken much more easily than it would during the Asian session (when volatility is usually lower).

These concepts are central to the trader’s approach when speculating in the London Session, as traders can look to use this volatility to their advantage by trading breakouts. When trading breakouts, traders are looking for volatile moves that may continue for an extended period of time.

2. Look out for the overlap

The ‘overlap’ is when the London and US sessions literally overlap each other (8AM ET to 12PM ET). These are the two largest market centers in the world, and during this four-hour period large and fast moves can be seen during the overlap as a large amount of liquidity enters the market.

When to trade the London-New York forex session overlap

As seen in the image above, the volatility increases to a maximum from 8:00 AM to 12:00 PM ET – when the London forex session overlaps with the New York forex session. To trade the overlap, traders can use a break-out strategy which takes advantage of the increased volatility seen during the overlap.

3. High liquidity

The London forex session is one of the most liquid trading sessions. Due to the high volume of buying and selling, major currency pairs can trade at extremely low spreads. Day traders looking to target short moves may be interested in finding trends and breakouts to trade so as to reduce the cost they pay in spread s.

What currency pairs are the best to trade during the London session?

There are no ‘best’ currency pairs to trade during London forex market hours, but there are currency pairs that will reduce in spread due to the high volume and allow traders cheaper spread costs.

These currencies include the major currency pairs like EUR/USD, USD/JPY, GBP/USD, and USD/CHF. The major currency pairs trade in extremely high volumes during the London forex session.

Currency pairs that are most affected by the overlap include the EUR/USD, USD/JPY, GBP/USD due to the inter-bank activities between the United States and Europe/London. If your trading strategy is better suited for volatility, then these are the trading pairs to watch because they will be flooded with liquidity and will move more on average during the overlap.

How to trade breakouts during the London Session

Trading breakouts during the London session using a London breakout strategy is much the same as trading breakouts during any other time of day, with the addition of the fact that traders may expect an onslaught of liquidity and volatility at the open.

When traders look to trade breakouts, they are often seeking firm support or resistance to plot their trades.

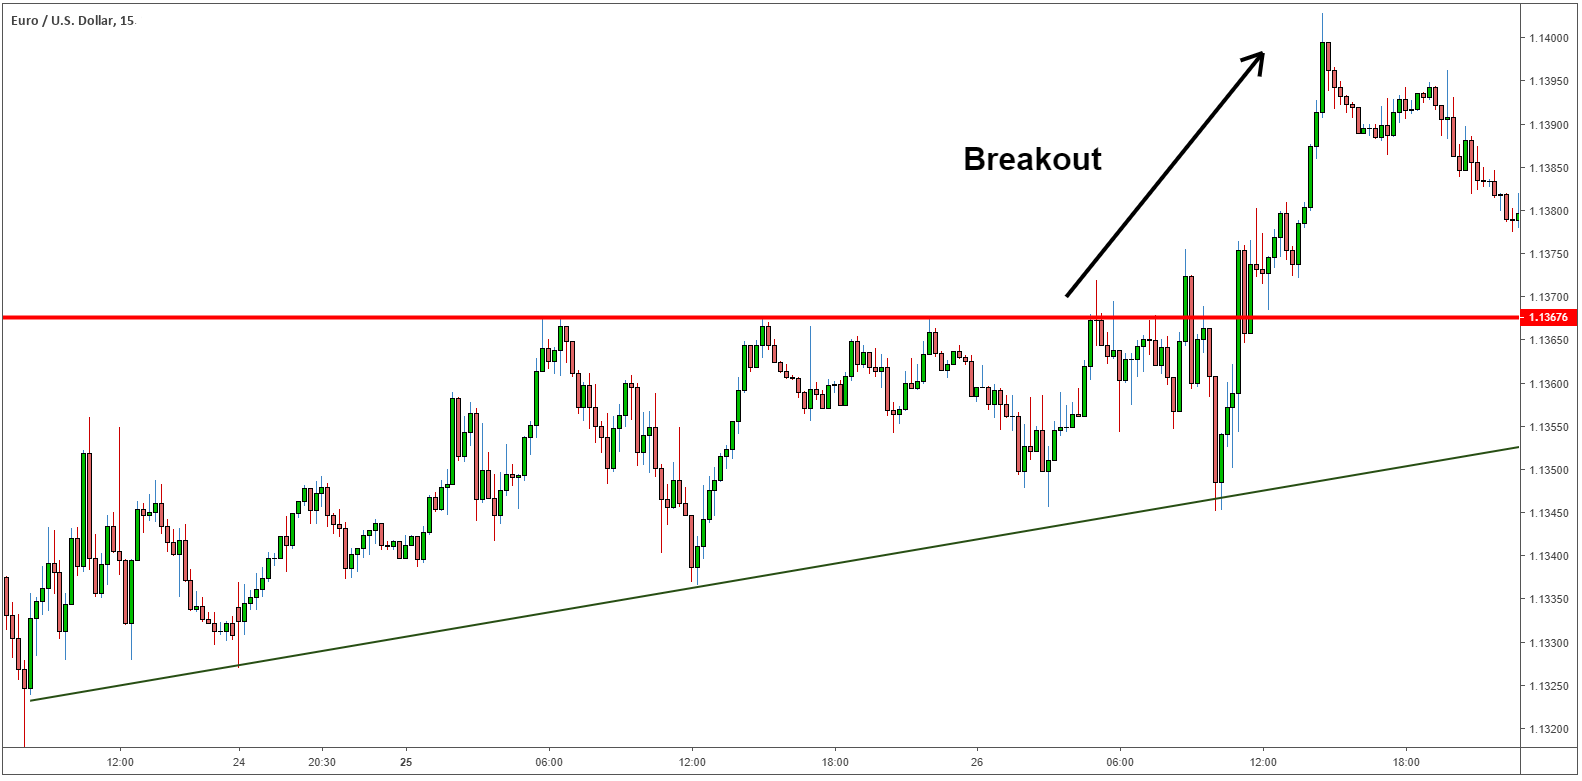
The chart below illustrates a rising wedge pattern, a trend line with a resistance level that is eventually broken- a breakout.

Rising wedge EUR/USD leading into a breakout during London session

The big benefit of this setup is risk management. Traders can keep stops relatively tight, with their stop-losses trailing close to the trend line. If the support/trend line does break, losses are limited, and if the strategy does prevail it could lead to a positive risk-reward ratio.

The increase in liquidity during the London session coupled with the increase in volatility makes potential breakouts much more likely.

London session trading strategies and tips

Remember, when trading the London open volatility and liquidity rises, so be wary and utilize the appropriate leverage when trading. If you’re new to forex trading, download our Forex for beginners trading guide to get to grips with the basics.

Like the London forex trading session, the New York session and Asian forex session also have unique characteristics that forex traders should be aware of.

Using Stop Loss Orders in Forex Trading

Using Stop Loss Orders in Forex Trading

Market movements can be unpredictable, and the stop loss is one of the few mechanisms that traders have to protect against excessive losses in the forex market. Stop losses in forex come in different forms and methods of application. This article will outline these various forms including static stops and trailing stops, as well as highlighting the importance of stop losses in forex trading.

What is a stop loss?

A forex stop loss is a function offered by brokers to limit losses in volatile markets moving in a contrary direction to the initial trade. This function is implemented by setting a stop loss level, a specified amount of pips away from the entry price. A stop loss can be attached to long or short trades making it a useful tool for any forex trading strategy.

Why is a stop loss order important?

Stops are critical for a multitude of reasons, but it can really be boiled down to one thing: we can never see the future. Regardless of how strong the setup might be, or how much information might be pointing in the same direction – future currency prices are unknown to the market, and each trade is a risk.

In the DailyFX Traits of Successful Traders research, this was a key finding – traders actually do win in many currency pairs the majority of the time. The chart below shows some of the more common pairings.

forex winning percentage

As you can see, traders were successfully winning more than half the time in most of the common pairings, but because their money management was often bad they were still losing money on balance.

Traders lost much more when they were wrong (in red) than they made when they were right (blue)

forex profit and loss

In the article Why do Many Traders Lose Money, David Rodriguez explains that traders can look to address this problem simply by looking for a profit target at least as far away as the stop-loss. That is, if a trader opens a position with a 50 pip stop, look for – as a minimum – a 50 pip profit target.

This way, if a trader wins more than half the time, they stand a good chance at being profitable. If the trader is able to win 51% of their trades, they could potentially begin to generate a net profit – a strong step towards most traders’ goals.

Forex stop loss strategies

Below are five strategies to apply in your forex trading when placing stop loss orders:

1. Setting Static Stops

Traders can set forex stops at a static price with the anticipation of allocating the stop-loss, and not moving or changing the stop until the trade either hits the stop or limit price. The ease of this stop mechanism is its simplicity, and the ability for traders to ensure that they are looking for a minimum one-to-one risk-to-reward ratio.

For example, let’s consider a swing-trader in California that is initiating positions during the Asian session; with the anticipation that volatility during the European or US sessions would be affecting their trades the most.

This trader wants to give their trades enough room to work, without giving up too much equity in the event that they are wrong, so they set a static stop of 50 pips on every position that they trigger. They want to set a profit target at least as large as the stop distance, so every limit order is set for a minimum of 50 pips. If the trader wanted to set a one-to-two risk-to-reward ratio on every entry, they can simply set a static stop at 50 pips, and a static limit at 100 pips for every trade that they initiate.

2. Static Stops based on Indicators

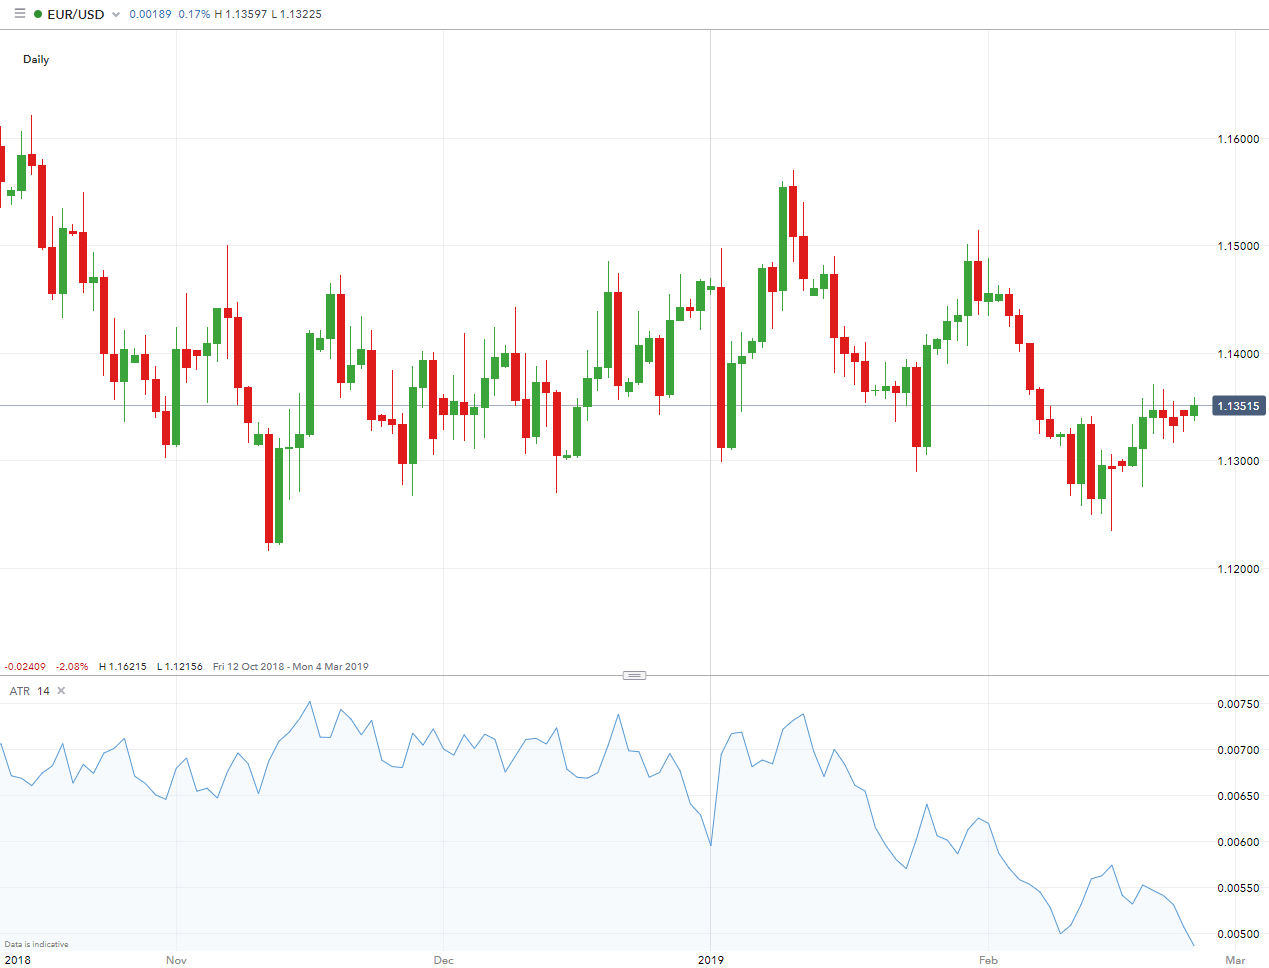
Some traders take static stops a step further, and they base the static stop distance on an indicator such as Average True Range. The primary benefit behind this is that traders are using actual market information to assist in setting that stop.

So, if a trader is setting a static 50 pip stop loss with a static 100 pip limit as in the previous example – what does that 50 pip stop mean in a volatile market, and what does that 50 pip stop mean in a quiet market?

If the market is quiet, 50 pips can be a large move and if the market is volatile, those same 50 pips can be looked at as a small move. Using an indicator like average true range, or pivot points, or price swings can allow traders to use recent market information to more accurately analyze their risk management options.

Average True Range can assist traders in setting stops using recent market information

average true range (ATR) in forex

We walk through such a mechanism in our article on Managing Risk with ATR (Average True Range).

3. Manual Trailing Stops

For traders that want the upmost control, forex stops can be moved manually by the trader as the position moves in their favor.

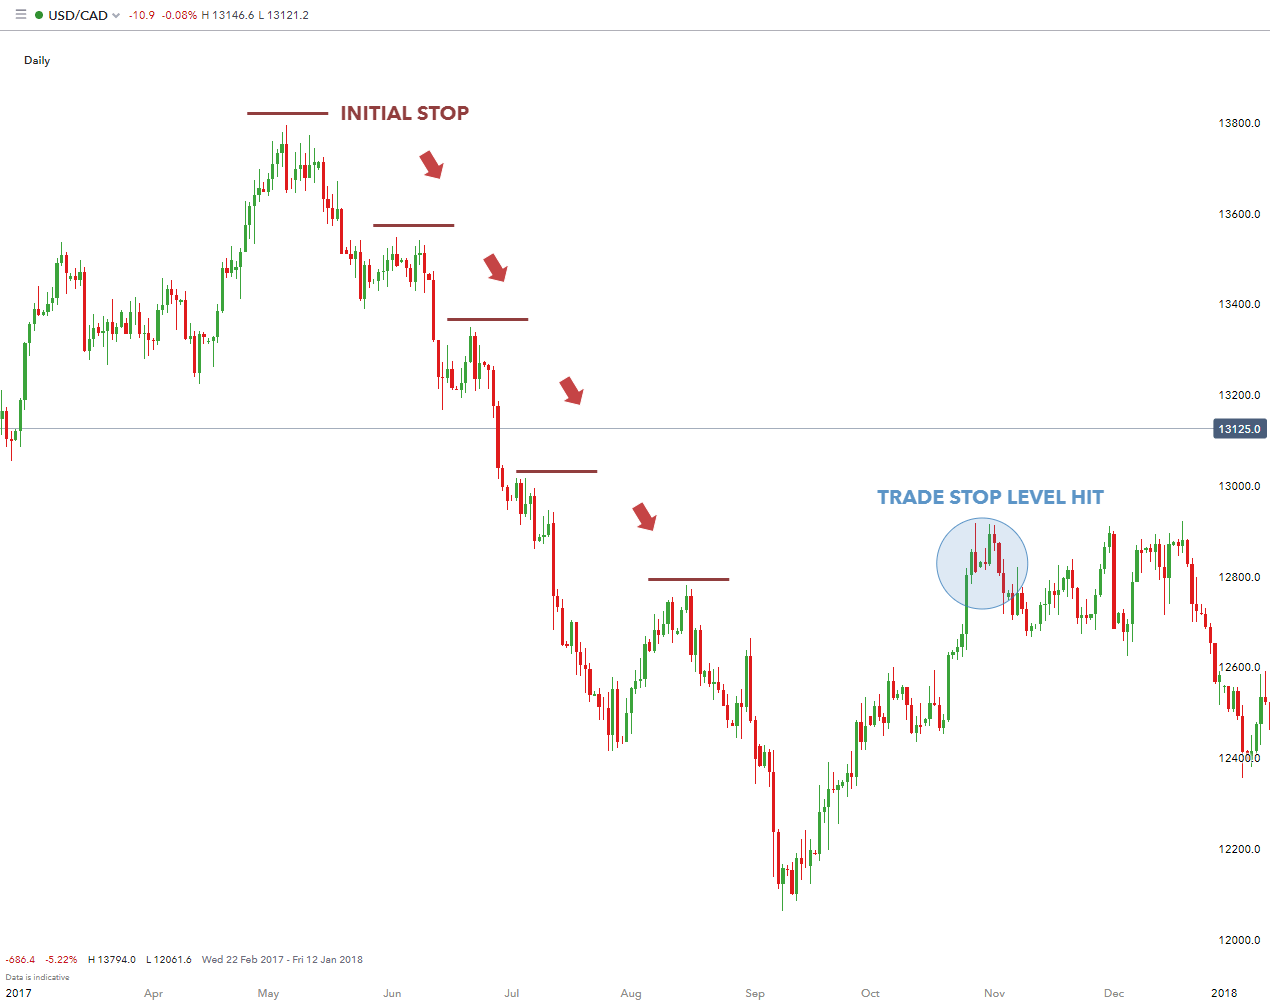
The chart below highlights the movement of stops on a short position. As the position moves further in favor of the trade (lower), the trader subsequently moves the stop level lower. When the trend eventually reverses (and new highs are made), the position is then stopped out.

Trader adjusting stops to lower swing-highs in a strong down-trend

forex stop loss manual stop

Take a look at Trading Trends by Trailing Stops with Price Swings for more information on how to implement the trailing stop.

4. Trailing Stops

It is important to note that some jurisdictions allow brokers to enforce the trailing stop function

Static stop losses can bring vast improvement to a new trader’s approach, but other traders use stops in a different way to further maximize their money management.Trailing stops are stops that will be adjusted as the trade moves in the trader’s favor, in an attempt to further mitigate the downside risk of being incorrect in a trade.

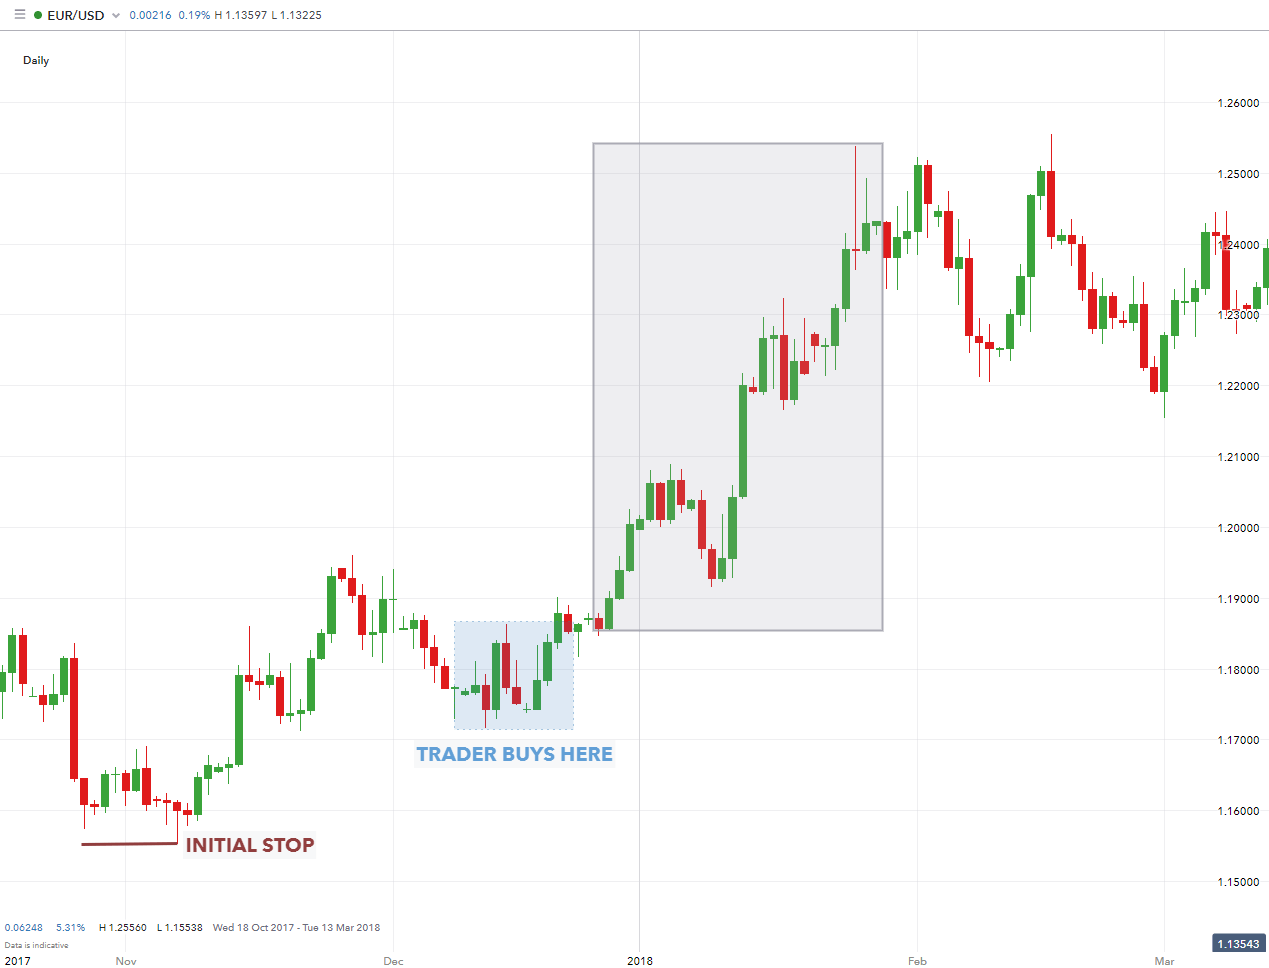
Let’s say, for instance, that a trader took a long position on EUR/USD at 1.1720, with a 167 pip stop at 1.1553. If the trade moves up to 1.1720, the trader may look at adjusting their stop up to 1.1720 from the initial stop value of 1.1553 (see image below).

This does a few things for the trader: It moves the stop to their entry price, also known as ‘break-even’ so that if EUR/USD reverses and moves against the trader, at least they won’t be faced with a loss as the stop is set to their initial entry price.

This break-even stop allows the trader to remove their initial risk in the trade.After which, the trader can look to place that risk in another trade opportunity, or simply keep that risk amount off the table and enjoy a protected position in their long EUR/USD trade.

Break-even stops can assist traders in removing their initial risk from the trade

forex stop loss trailing stop

5. Fixed Trailing Stops

Traders can also set trailing stops so that the stop will adjust incrementally. For example, traders can set stops to adjust for every 10 pip movement in their favor.

Using an example of a trader buying EUR/USD at 1.3100 with an initial stop at 1.3050 – after EUR/USD moves up to 1.3110, the stop adjusts up 10 pips to 1.3060. After another 10 pip movement higher on EUR/USD to 1.3120, the stop will once again adjust another 10 pips to 1.3070. This process will continue until such time as the stop level is hit or the trader manually closes the trade.

Fixed Trailing stops adjust in increments set by the trader

If the trade reverses from that point, the trader is stopped out at 1.3070 as opposed to the initial stop of 1.3050; a savings of 20 pips had the stop not adjusted.

Inflation Fight Night: Fed Chair vs. The Senator

Inflation Fight Night: Fed Chair vs. The Senator

The three-round exhibition fight occurred on Tuesday, March 7, when Federal Reserve Chairman Jerome Powell testified before the Senate Banking Committee. Both opponents arrived well-prepared for the bout, which led to an exciting showdown. Given their influence, this commentary focuses on the main points of the exchange, intending to provide a politically unbiased view of the problems and the possible, appropriate investment solutions.

Here are the issues around which each round was fought.

Round #1: The Fed cannot tame inflation with higher interest rates alone

We agree with Senator Elizabeth Warren that the fight against inflation cannot be fought exclusively by wielding the demand destruction that results from higher interest rates. She specifically mentioned “price gouging,” “supply chain kinks,” and the “war in Ukraine” as inflationary forces that cannot be controlled through monetary policy.

The term “price gouging” is used to vilify companies for passing along increased costs to consumers. The declining profit margins of companies in the S&P 500® Index reveal that corporations are not “gouging” but suffering from high inflation—just as are individuals.

S&P 500 Operating Margin vs. CPI

S and P 500 Operating Margin vs. CPI

Source: Bloomberg, Data as of 3/2023. Past performance is no guarantee of future results.

While “supply chain kinks” were once a significant source of high prices, the evidence suggests this is no longer true. As measured by the Federal Reserve Global Supply Chain Pressure Index, supply chains have corrected mainly and are now back at pre-COVID-19 levels. Supply chains likely are neither now nor will be a major source of inflation going forward.

Global Supply Chain Pressure

Global Supply Chain Pressure

Source: Bloomberg, Data as of 2/2023. Past performance is no guarantee of future results.

We do, though, agree that the war in Ukraine further aggravates inflation and that the economic consequences are likely to last for an extended period. War, in general, is highly inflationary because it diverts away productivity and efficiencies across global economies. The chart below demonstrates how periods of war have historically coincided with higher inflation.

U.S. CPI YoY Change (%)

U.S. CPI YoY Change (%)

Source: Bloomberg, Data as of 12/2022. Past performance is no guarantee of future results.

Since restrictions on the availability of commodities have global inflationary implications, this conflict is particularly inflationary given the significance of both Russia and Ukraine as commodity producers. The chart below demonstrates just why Russia is such a commodities powerhouse.

Top 5 Countries in Global Production (2020 – 2021, Descending Order)

Top 5 Countries in Global Production (2020 - 2021, Descending Order)

Top 5 Countries in Global Production (2020 - 2021, Descending Order)

Source: Bloomberg, Company Data, Goldman Sachs Global Investment Research, Argus, WoodMac, USDA, USGS. Data as of 1/2022. Past performance is no guarantee of future results. Not intended as a recommendation to buy or sell securities of any sector mentioned herein.

However, we believe Senator Warren left out four very key risks that illustrate why monetary policy alone may not be enough to combat inflation:

  1. The use of debt monetization to finance government overspending.
  2. The failure to invest in the production of traditional energy.
  3. The fact that “social spending” increases aggregate demand.
  4. The cost increase resulted from de-globalization (e.g., on-shoring in the U.S.).

In the interest of brevity in this piece, we can expand upon these topics in future commentaries.

Round #2: The Fed will likely cause a severe recession, and many people will lose their jobs

Senator Warren points out that, since the end of WWII, there have been 12 times when the unemployment rate increased by 1% or more within one year, and each time it resulted in a recession. Furthermore, once the economy starts losing jobs, it typically “turns into a runaway train that is very hard to stop.” In 11 out of those 12 times, unemployment rose at least another 1% or more after the initial 1%.

We agree and expect a hard landing. The chart below demonstrates the cause-and-effect relationships between inflation, interest rates, and unemployment. The last inflationary event of a similar magnitude was in the 1970s, resulting in a double-digit unemployment rate. While we do not believe such a severe downturn will emerge, the historical data cast heavy doubt on the expectation of a soft landing.

CPI vs. Fed Funds Rate vs. Unemployment

CPI vs. Fed Funds Rate vs. Unemployment

Source: Bloomberg, Data as of 12/2022. Past performance is no guarantee of future results.

Round #3: Fire Powell

Senator Warren concluded her statement: “Chairman Powell, you are gambling with people’s lives. We need a Fed that will fight for working families. If you are not going to lead that charge then we need someone at the Fed that will.”

While this rhetoric may be politically expedient for Senator Warren, firing Chairman Powell will not solve the problem. Higher interest rates, in coordination with the resolution of supply-side bottlenecks, are necessary weapons in the fight against inflation.

The unkind truth is that millions of jobs will likely be sacrificed to ease the inflation burden on over 330 million Americans. The charts below demonstrate that, in the aggregate, the cost of inflation is much more substantial because it impacts everyone, not just those losing their jobs.

Lost Real Income Per Increase In Unemployment

Lost Real Income Per Increase In Unemployment

Lost Real Income Per Increase In Inflation level

Lost Real Income Per Increase In Inflation level

Source: St. Louis Federal Reserve Bank. Data as of 9/2022. Past performance is no guarantee of future results.

The Fight Result

After three rounds of vigorous action, we go to the scorecards and declare the victory to Senator Elizabeth Warren by a slim margin. The most important takeaway was that high inflation must be addressed from both the demand and supply sides. Destroying the economy to bring the balance between demand and supply in line is only a temporary solution, at best. Eventually, the Fed will be required to relent. And, unless the supply-side issues are resolved, specifically in commodities, our expectation is of a resurgence in inflation.

Investment Solutions

First, you must stop assuming that inflation will just disappear. The chart below demonstrates how wrong the consensus view on inflation has been by comparing the differences between inflation expectations and inflation. Right now, the expectation is that the inflation rate will be 3.9% in 12 months. Will that prove to be right—maybe? Even a broken clock is right twice a day. But don’t bet your nest egg on it.

Inflationary events of the past have occurred frequently (30% of the time, the CPI—the consumer price index—has been above 4%), and globally, on average, these events have lasted well over a decade.

U.S. Inflation & Expectation 2021-2023

U.S. Inflation and Expectation 2021-2023

Source: Bloomberg, Data as of 1/2023. Past performance is no guarantee of future results.

Secondly, consider a 10-20% strategic allocation to diversified real assets. Real assets have the ability to outperform during periods of high inflation because of the scarcity of physical goods during inflationary events. Our preferred solution is the Van Eck Inflation Allocation ETF (“RAAX”). It offers an adaptive allocation across a diversified portfolio of inflation-fighting assets.

The chart below demonstrates the performance of RAAX, relative to both stocks and bonds, since inflation exceeded 2%.

VanEck Inflation Allocation ETF vs. Stocks/Bonds 2021-2023

VanEck Inflation Allocation ETF vs. Stocks/Bonds 2021-2023

Source: Bloomberg, Data as of 1/2023. Past performance is no guarantee of future results. Not intended as a recommendation to buy or sell any securities mentioned herein.

Thank you for taking the time to read our commentary. And cross your fingers if you are not invested in diversified, inflation-fighting real assets.

The European Central Bank: A Forex Trader’s Guide

The European Central Bank: A Forex Trader’s Guide

The European Central Bank (ECB) is situated in Frankfurt, Germany. It was established in 1998 by the Treaty of Amsterdam. The European Central Bank is different to other central banks in that it controls monetary policy for the entire eurozone. Countries that belong to the eurozone include Austria, Belgium, Cyprus, Estonia, Finland, France, Germany, Greece, Ireland, Italy, Latvia, Lithuania, Luxembourg, Malta, The Netherlands, Portugal, Slovakia, Slovenia and Spain.

European Central Bank

What is the ECB

The European Central Bank acts as the central bank for the 19 countries that belong to the eurozone. The European Central Bank is overseen by a governing council that consists of six executive board members, with one serving as the president. The executive board members are appointed by the European Council.

The European Central Bank’s primary objective is to maintain price stability. They use monetary policy to support the economy and job creation.

Key Economic Mandates of the ECB

The European Central Bank’s primary mandate or objective is price stability. Price stability is the control of inflation, Harmonised Index of Consumer Prices (HICP) and the exchange rate of the EUR.

1) Price Stability – which is price stability or inflation

2) Financial stability – Through the control of price stability and sometimes other mechanisms.

Price Stability

To maintain price stability, the European Central Bank influences the short-term interest rate for the eurozone. The European Central Bank has a target interest rate (like most central banks) of below, or close to, 2%. Although they target inflation mostly, GDP and unemployment data have a big effect on the decisions the policy makers make.

If inflation goes above 2%, the European Central Bank may signal a hiking of the interest rate to the public to tighten the eurozone’s economic expansion and bring down inflation. If unemployment numbers are increasing and the economy is slowing down, the bank may have to make the decision to decrease interest rates, to stimulate the economy and job growth. A period of rising inflation and increasing unemployment will require the policy makers to weigh the pros and cons of tightening the economy to reign-in inflation or stimulate the economy to produce jobs.

Join our central bank webinar to watch our senior currency strategist discuss and analyze current central bank trends.

Financial Stability

The European Central Bank also plays a large role in keeping the eurozone’s financial system stable. In times of a crisis they can do this by adding liquidity to the system, either by buying bonds on the open market or decreasing the interest rate to extremely low levels to help distressed debt holders pay back their obligations.

If the European Central Bank does not add liquidity in times of a crisis, the entire financial system could collapse.

How ECB interest rates affect the Euro

Interest rate impact on the Euro

The European Central Bank can affect the value of the Euro through changes in interest rate expectations. Traders should understand that currencies tend to appreciate when interest rate expectations increase, not just from increases in the nominal interest rate.

For example, if the European Central Bank keeps interest rates unchanged but issues forward guidance (tells the market) that they expect more interest rate hikes in future, the value of the Euro tends to appreciate.

A q uantitative easing program (QE) has a similar effect to interest rates on the Euro. Quantitative easing is the buying of securities on the open market by a Central Bank in order to stimulate the economy and add liquidity to the financial system. Historically it has only been done in times of a financial crisis. Increased quantitative easing reduces the value of the Euro because it increases the amount of money in supply.

Interest rate impact on the economy

The European Central Bank lowers interest rates when it is trying to stimulate the economy (GDP) and increases interest rates when it is trying to contain inflation caused by an economy operating above potential (overheating).

Lower interest rates stimulate an economy in a few ways:

  1. Businesses can borrow money and invest in projects that will receive more than the risk borrowing rate.
  2. When interest rates are lower the stock market is discounted at a lower rate, leading to an appreciation in stock market values which causes a wealth effect.
  3. People invest their money into the economy (stocks and other assets) because they can earn more in these assets than at currently low interest rates.

How to trade ECB interest rate decisions

The table below displays the possible scenarios that come from a change in interest rate expectations. Traders can use this information to forecast if the currency is likely to appreciate or depreciate and how to trade it.

Market expectations Actual Results Resulting FX Impact
Rate Hike Rate Hold Depreciation of currency
Rate Cut Rate Hold Appreciation of currency
Rate Hold Rate Hike Appreciation of currency
Rate Hold Rate Cut Depreciation of currency

Let’s look at an example, EUR/USD, where the European Central Bank ended its long-time program of quantitative easing. Ending the quantitative easing program means that the central bank would no longer be adding more money to the system. On December 13, 2018 the European Central Bank announced an end to its quantitative easing program, which led to an appreciation in the Euro because it signalled that less money than expected would be in the economy.

European central bank ends quantitative easing program

Top Takeaways of the ECB and Forex Trading

  • The European Central Bank is fundamental to the value of the Euro.
  • The Euro tends to appreciate or depreciate depending on changes in interest rate expectations, not just on actual changes.
  • Quantitative easing has a similar effect to changes in interest rates. Changes in expectations of quantitative easing will have an effect on the Euro.
  • Rising inflation does not mean the European Central Bank will increase interest rates, it depends on the balance between economic growth and inflation. The ECB will raise rates if inflation is close to, at, or above target – the ECB’s primary mandate is to maintain price stability (inflation).

USD/JPY keeps the red around 133.00 mark amid bank crisis fears, softer USD

USD/JPY keeps the red around 133.00 mark amid bank crisis fears, softer USD

The USD/JPY pair struggles to capitalize on the overnight late rebound from the 132.20 area, or a one-month low and attracts some sellers for the second successive day on Thursday. The pair, however, manages to rebound a few pips from the daily low and trades around the 133.00 mark during the early European session, still down nearly 0.40% for the day.

Despite the positive development surrounding the Credit Suisse saga, concerns about fresh turmoil in the global banking sector continue to drive haven flows towards the Japanese Yen (JPY) and exert pressure on the USD/JPY pair. The troubled Swiss bank announced that it will exercise an option to borrow up to $54 billion from the Swiss National Bank (SNB) to shore up liquidity. Investors, however, remain worried about a broader systemic crisis in the wake of the collapse of two mid-size US banks – Silicon Valley Bank and Signature Bank. This is evident from the prevalent cautious market mood and benefits traditional safe-haven currencies.

Apart from this, a modest US Dollar weakness turns out to be another factor acting as a headwind for the USD/JPY pair, though the prospects for further policy tightening by the Federal Reserve help limit losses. Investors still expect the US central bank to deliver at least a 25 bps rate hike at its upcoming policy meeting on March 21-22. In contrast, the Bank of Japan (BoJ) is expected to stick to its dovish stance to support the fragile domestic economy. In fact, the incoming BoJ Governor Kazuo Ueda recently stressed the need to maintain the ultra-loose policy settings and said that the central bank isn’t seeking a quick move away from a decade of massive easing.

The aforementioned fundamental backdrop warrants caution before placing aggressive bearish bets around the USD/JPY pair and positioning for an extension of last week’s rejection slide from the 200-day Simple Moving Average (SMA). Traders now look to the US economic docket, featuring the release of the usual Weekly Initial Jobless Claims, the Philly Fed Manufacturing Index, Building Permits and Housing Starts. Apart from this, the European Central Bank (ECB)-inspired volatility could provide a fresh impetus.

China’s Commerce Ministry: Willing to discuss basic issues that concern Australian-Sino trade

China’s Commerce Ministry: Willing to discuss basic issues that concern Australian-Sino trade

When asked if China will recommence the import of beef and barley from Australia, Shu Jueting, a spokesperson at China’s Commerce Ministry, said at a regular news conference that “China is willing to discuss basic issues that concern both nations.”

When asked if restrictions on the import of Australian coal have been lifted, he said “they can apply for coal import license normally.”

Additional comments

“Will continue to push for the relaxation of market access for foreign investment.”

“Will steadily expand institutional openness.”

“Local govts and firms say less orders remain the biggest challenge for 2023 trade development.”

Market reaction

AUD/USD has picked up fresh bids in early European trading, rising above 0.6650. The pair is adding 0.64% on the day.

Forex Market Today: Another U-turn in markets as focus shifts to ECB

Forex Market Today: Another U-turn in markets as focus shifts to ECB

Here is what you need to know on Thursday, March 16:

Following Wednesday’s intense flight to safety that was triggered by renewed fears over Credit Suisse collapsing after failing to receive additional financial support, market mood seems to have started to improve early Thursday. The European Central Bank (ECB) will announce its policy decisions later in the day and the US economic docket will feature February Housing Starts, Building Permits and the Federal Reserve Bank of Philadelphia’s Manufacturing Survey for March.

ECB Preview: Banking jitters give arguments for doves.

Bloomberg reported early Thursday that Saudi National Bank’s, Credit Suisse’s biggest investor, Chairman, Ammar Al Khudairy said the panic surrounding Credit Suisse was unwarranted. Al Khudairy added that regulators were ready to “plug holes when they appear” while noting that the bank was unlikely to need more capital. More importantly, the Swiss National Bank (SNB) and the Swiss Financial Market Supervisory Authority (FINMA) came out with a statement late Wednesday, saying that Credit Suisse met the capital requirements imposed on banks and that they will provide liquidity if necessary. After having lost over 3.5% on Wednesday, Euro Stoxx 50 was up more than 1% in the pre-market trade. Furthermore, Credit Suisse shares are reportedly indicated more-than-20% higher opening on Swiss exchange.

In the meantime, the US Dollar Index, which rose more than 1% on Wednesday, stages a technical correction and trades in negative territory at around 104.50. The benchmark 10-year US Treasury bond yield is up more than 1% on the day following Wednesday’s sharp decline. Finally, US stock index futures are up marginally in the early European session.

EUR/USD lost more than 150 pips on Wednesday and came within a touching distance of 1.0500 before staging a rebound. At the time of press, the pair was trading a few pips above 1.0600, adding 0.3% on the day.

GBP/USD fell toward 1.2000 during the American trading hours on Wednesday but managed to erase a portion of its daily losses before the end of the day. The pair stays relatively quiet early Thursday and trades in a tight range below 1.2200.

Despite the broad-based US Dollar strength, USD/JPY closed in negative territory as the Japanese Yen found demand as a safe haven. Early Thursday, the pair stays on the back foot and fluctuates in negative territory at around 133.00.

In the Asian session, the data from Australia showed that Employment Change was +64.6K in February, better than the market expectation of +48.5K. The Unemployment Rate declined to 3.5% from 3.7% and the Participation Rate improved modestly to 66.6% from 66.5%. Other data revealed that Consumer Inflation Expectation in March ticked down to 5% from 5.1% in February. AUD/USD gained traction after these data and was last seen rising 0.5% on the day at around 0.6650.

XAU/USD capitalized on plunging global bond yields on Wednesday and gained nearly 1%. Gold price edges lower amid recovering yields early Thursday and was last seen trading below $1,920.

Bitcoin snapped a three-day winning streak and lost more than 1% on Wednesday. BTC/USD seems to have regained its traction early Thursday and was last seen rising 1.3% at $24,700. Ethereum fell nearly 3% on Wednesday but managed to shake off the bearish pressure in the European morning, recovering toward $1,700.