

NATURAL GAS TECHNICAL OUTLOOK: BULLISH
Natural gas prices are holding above strong support, raising the prospect of at least some consolidation / minor rebound as the downward momentum is fading.
Market diversity as measured by fractal dimensions appears to be low as natural gas retests multi-month lows. Fractal dimensions measure the distribution of diversity. When the measure hits the lower bound, typically 1.25-1.30 depending on the market, it indicates extremely low diversity as market participants bet in the same direction, raising the odds of a price reversal. For natural gas, the 65-day fractal dimension fell below the threshold of 1.25, flashing a red flag. See “Natural Gas Price Action Setup: Is the Slide Overdone?”, published February 21 for more on the topic.
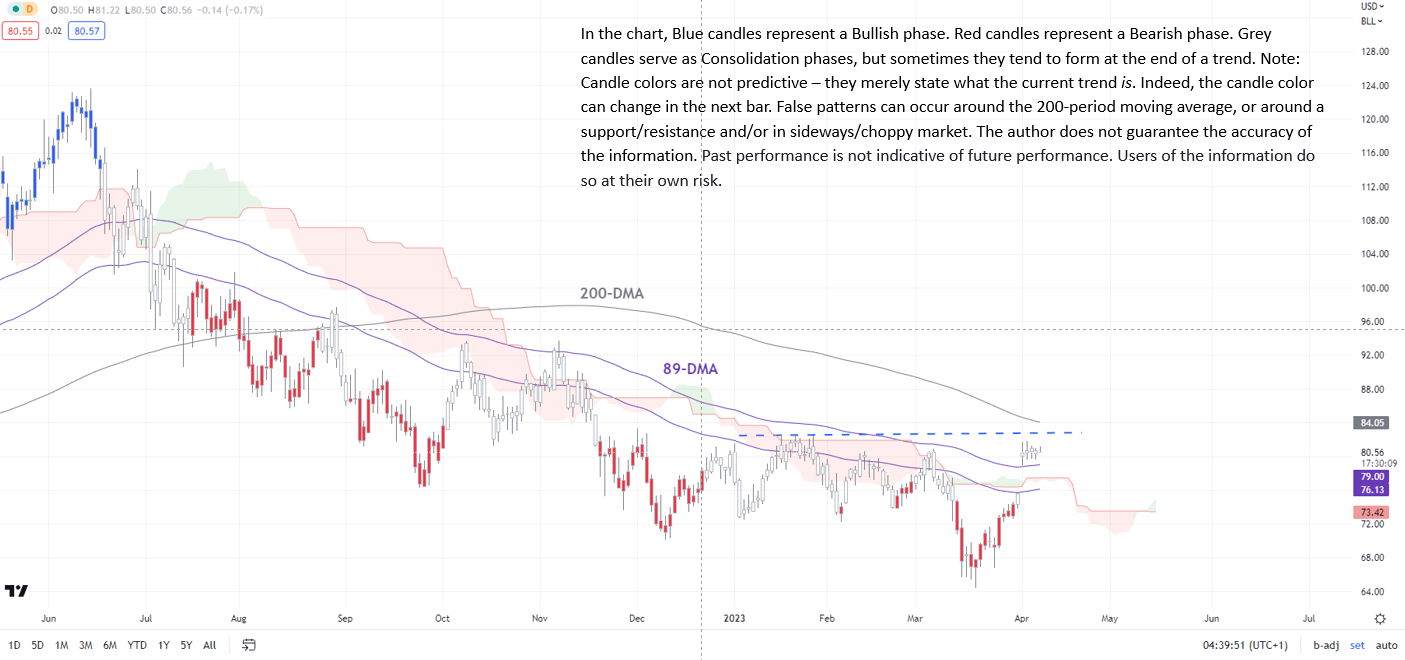
Natural Gas Daily Chart
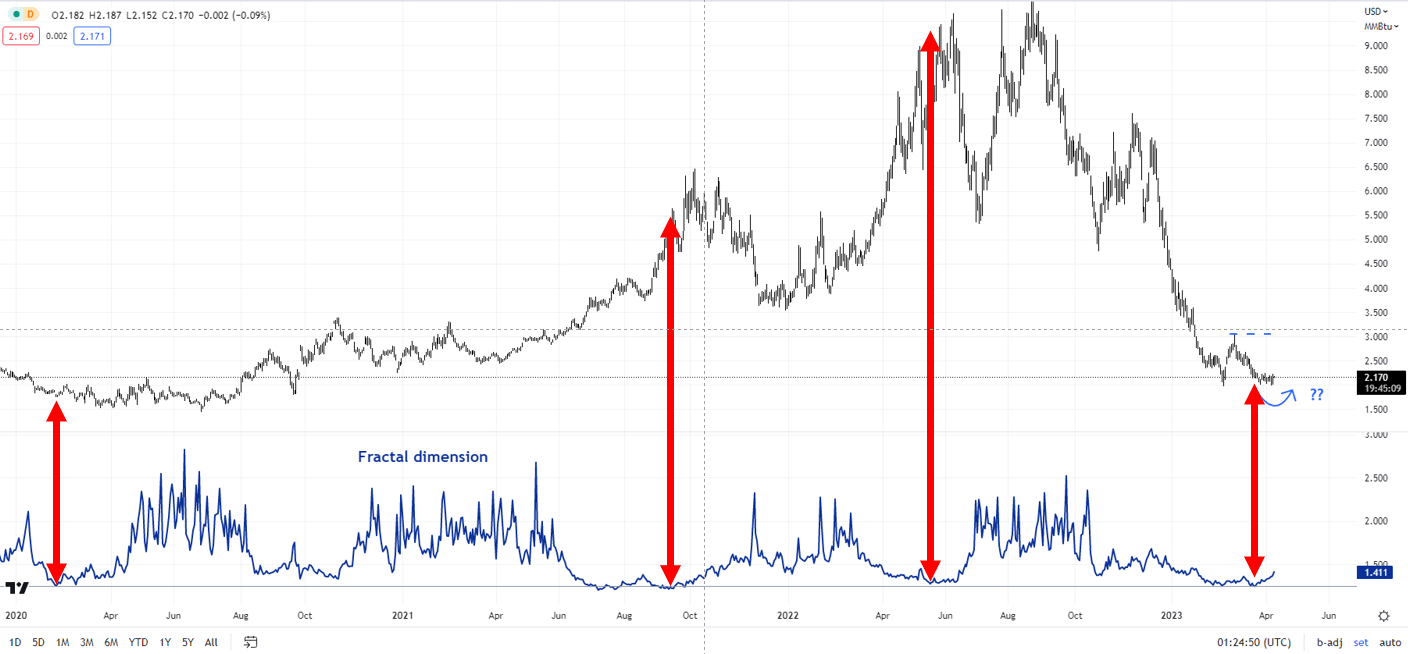
Chart Created by Manish Jaradi using Tradingview
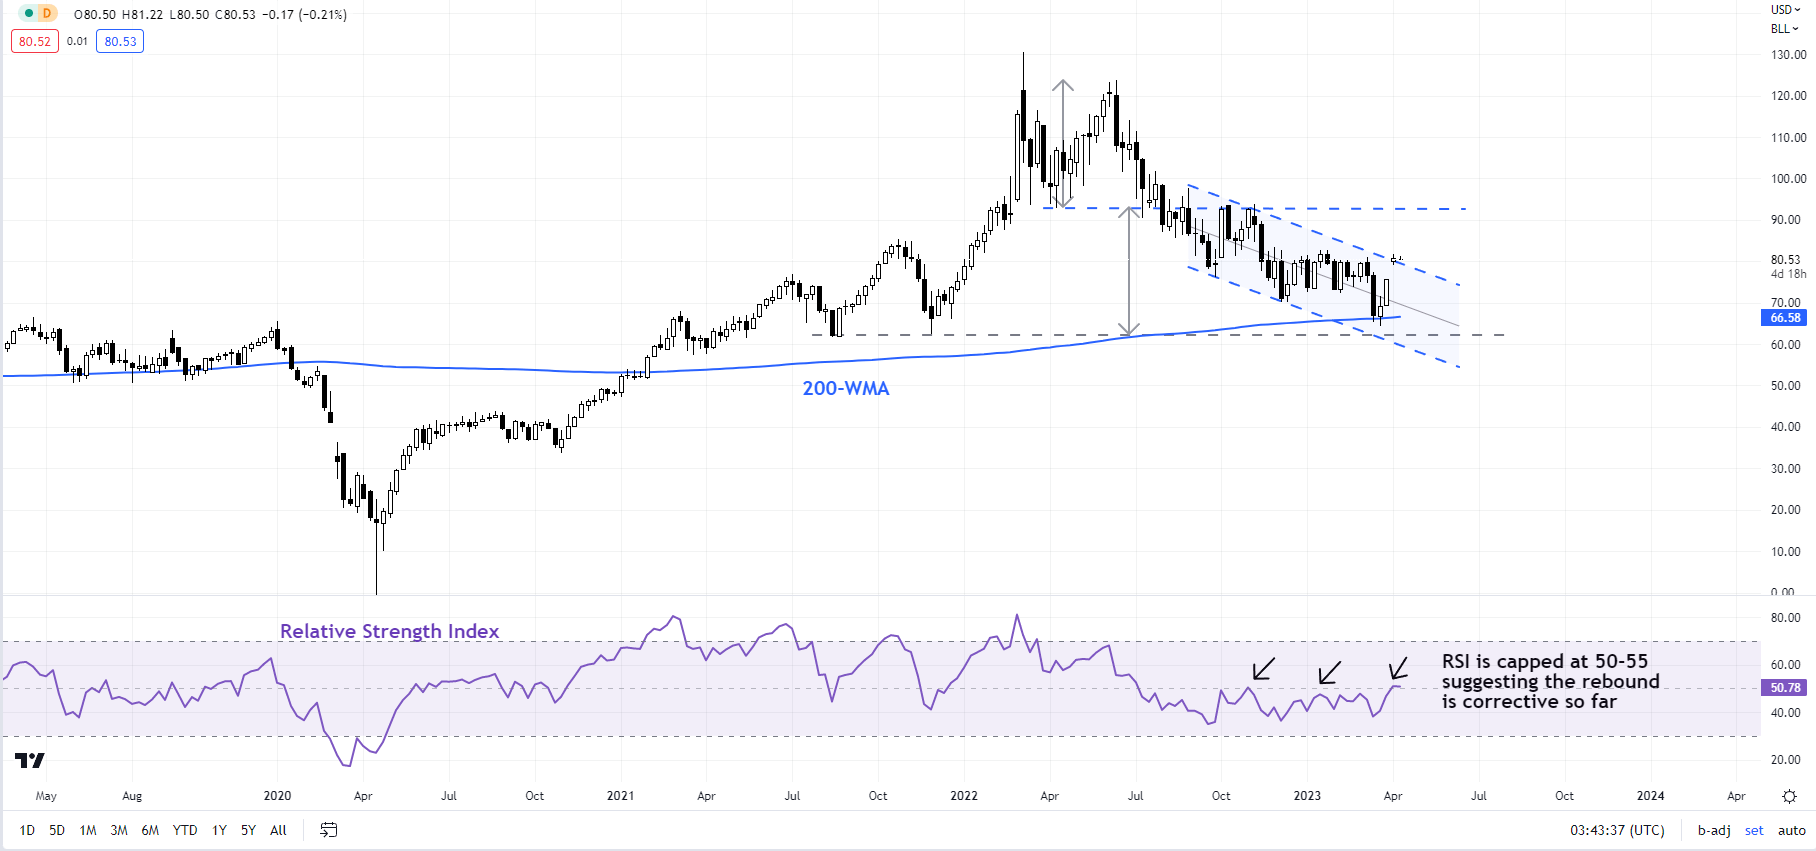
A positive momentum divergence on the daily and weekly charts (ascending Relative Strength Index associated with a double bottom in natural gas) is a sign that the eight-month-long slide is losing momentum. Moreover, speculative short positioning has reduced sharply since March even as natural gas prices are hovering around 2.5-year lows.
So far, natural gas is holding above strong support at the February low of 1.97. Furthermore, the colour-coded daily candlestick charts show the most recent leg lower (from early March) is consolidation within the downtrend, and not the start of a fresh leg lower.
Natural Gas Daily Chart

Chart Created by Manish Jaradi using Tradingview
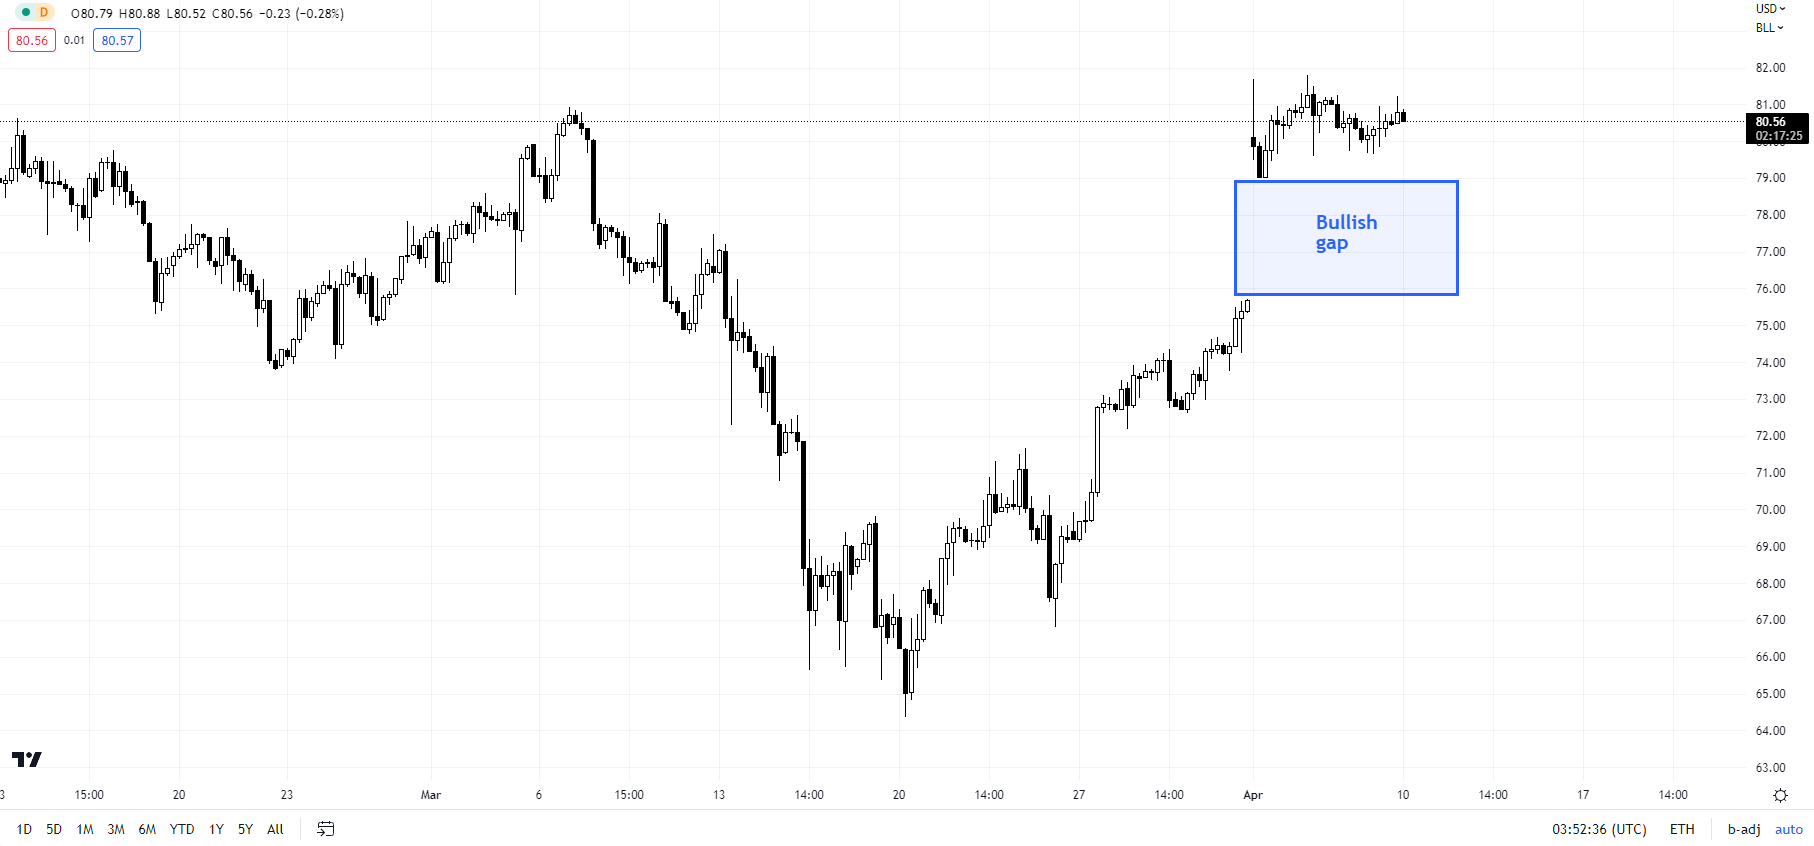
This suggests that the conditions for at least a short-term consolidation/minor rebound are getting ripe. To be fair, natural gas needs to clear the crucial resistance area around 2.25-2.40, including the 89-period moving average, the 200-period moving average, and the upper edge of the Ichimoku cloud on the 240-minute charts. A move above the resistance would raise the odds of a retest of the March high of 3.03. Any break above 3.03, would trigger a double bottom (the February and the March lows), potentially opening the way toward 4.00.
Natural Gas 240-minute Chart
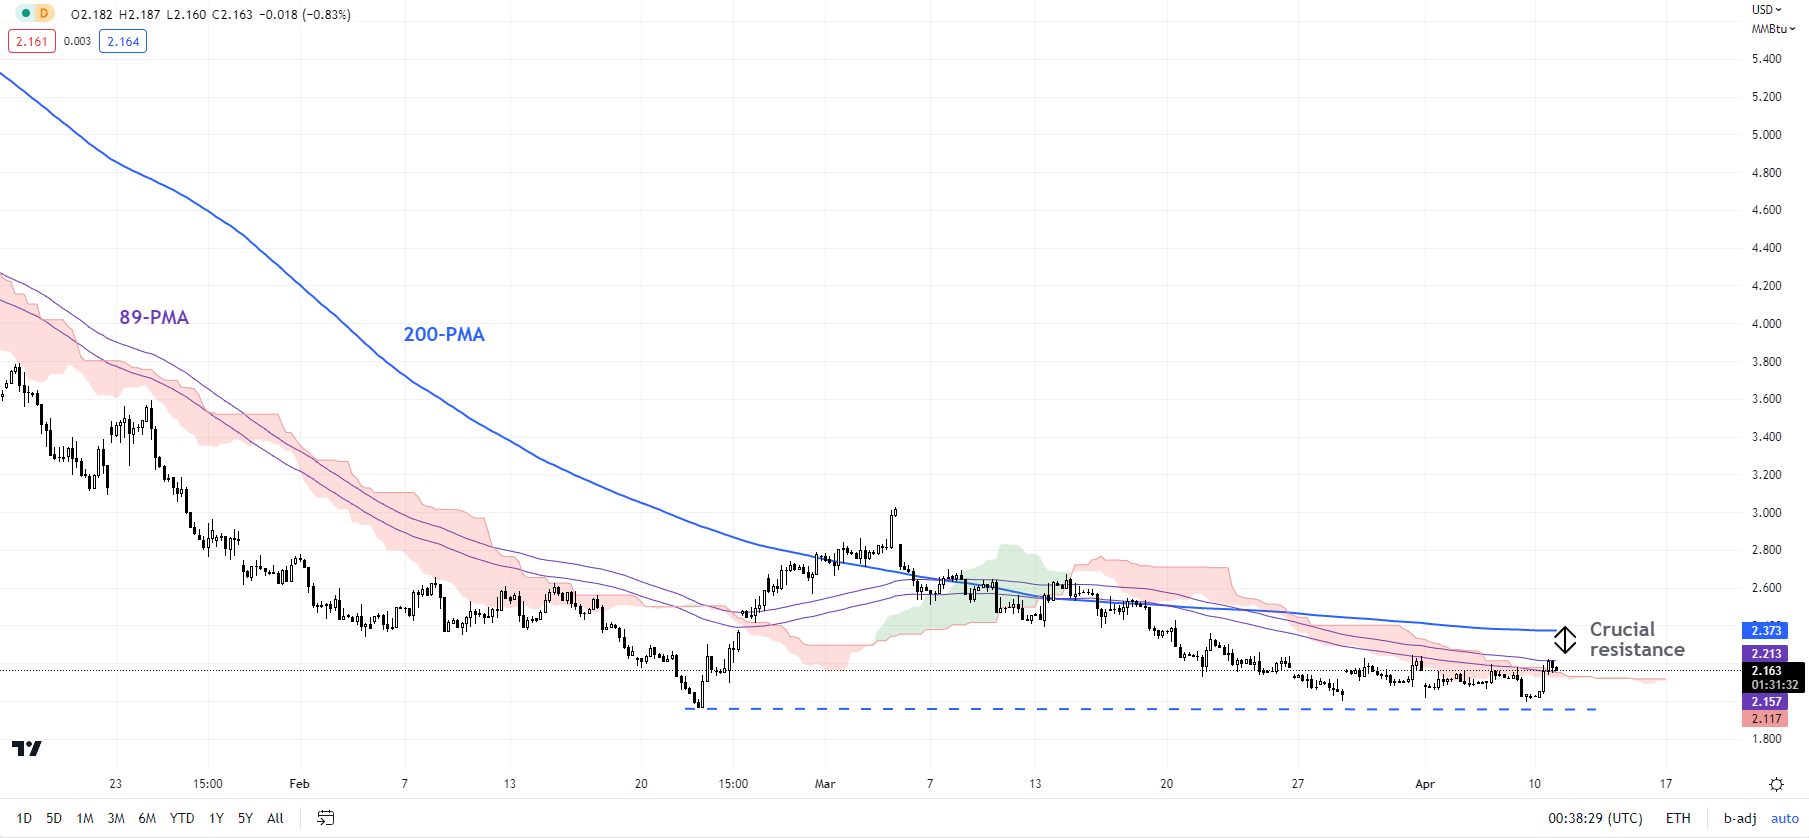
Chart Created by Manish Jaradi using Tradingview
On the downside, a drop below 1.97 could pave the way toward the 2020 low of around 1.45, also the target of a major double-top pattern (the 2022 highs) triggered at the end of last year.

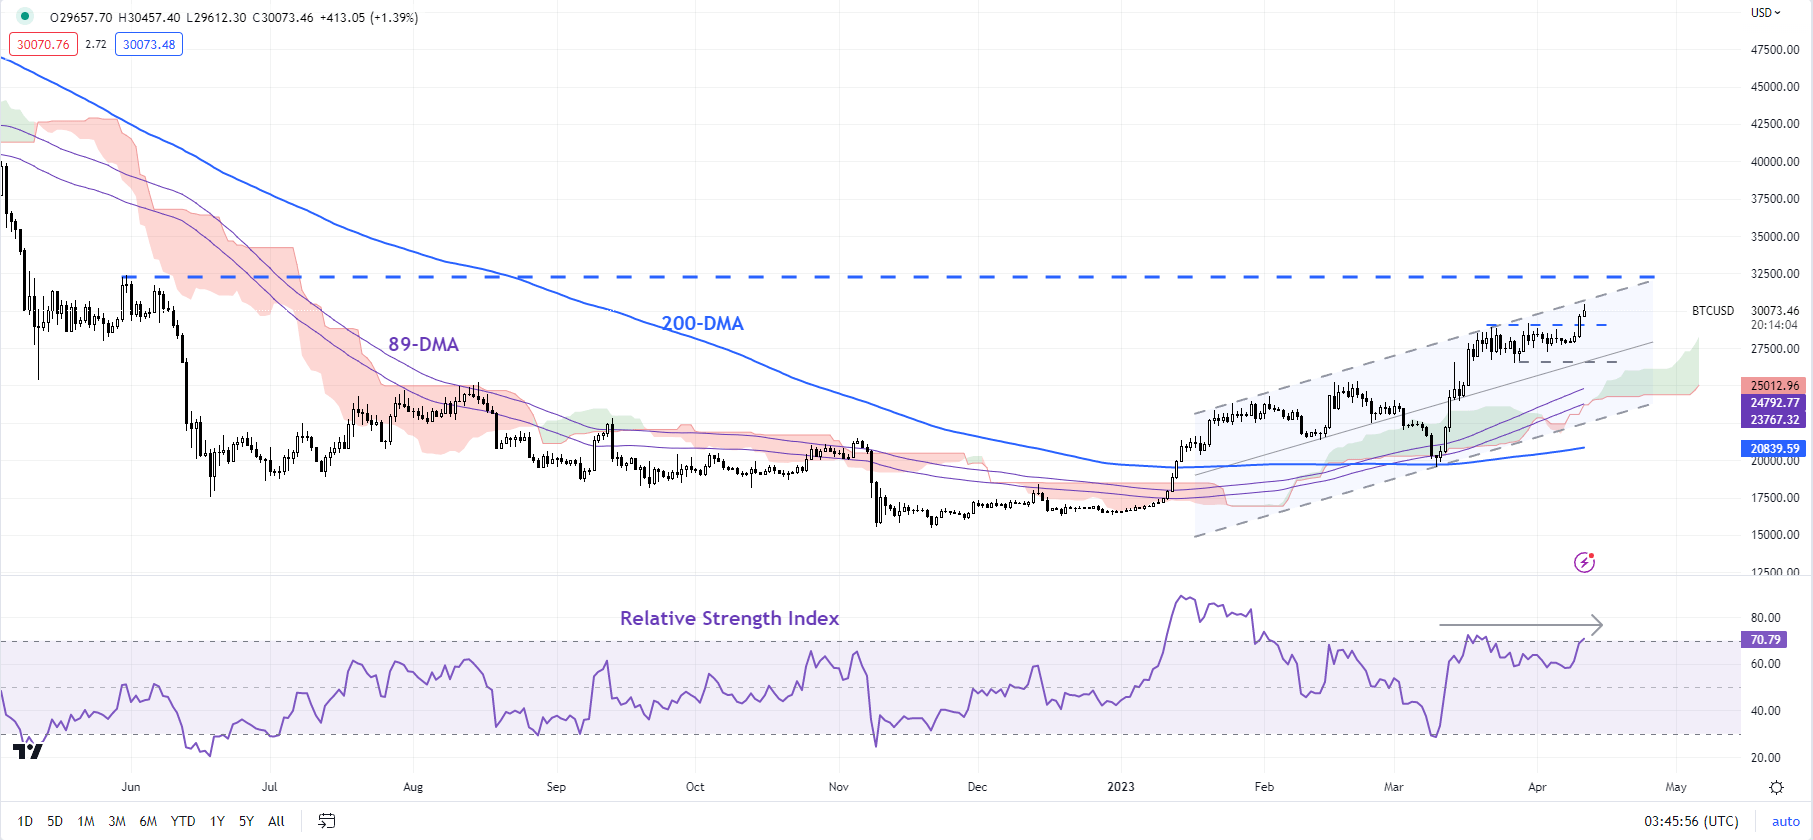


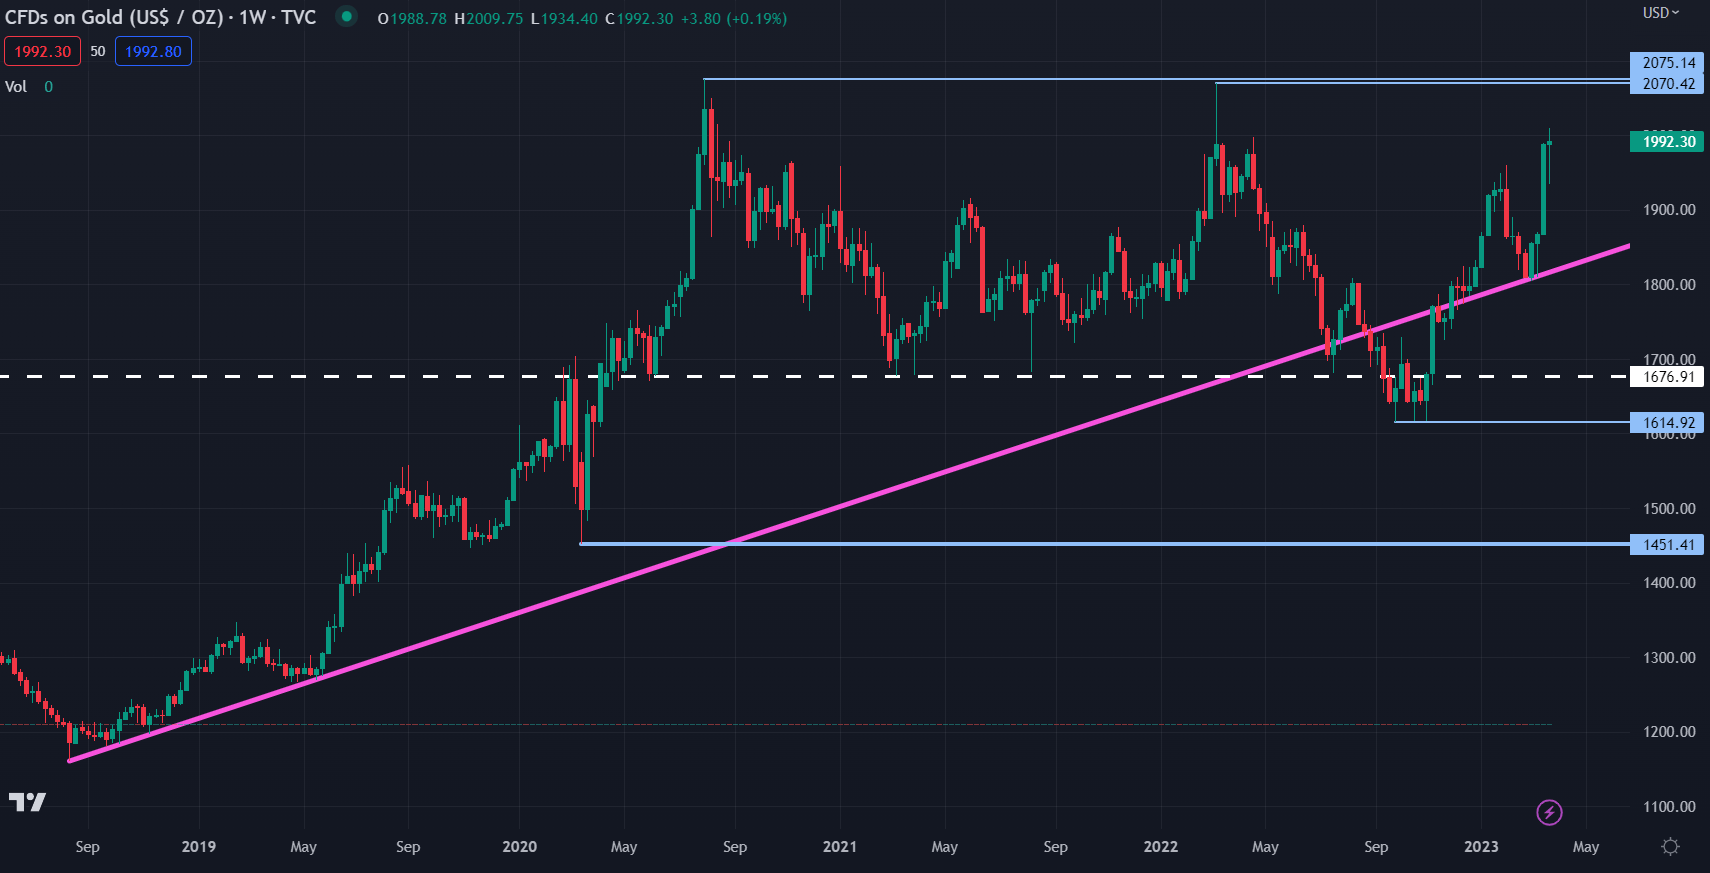
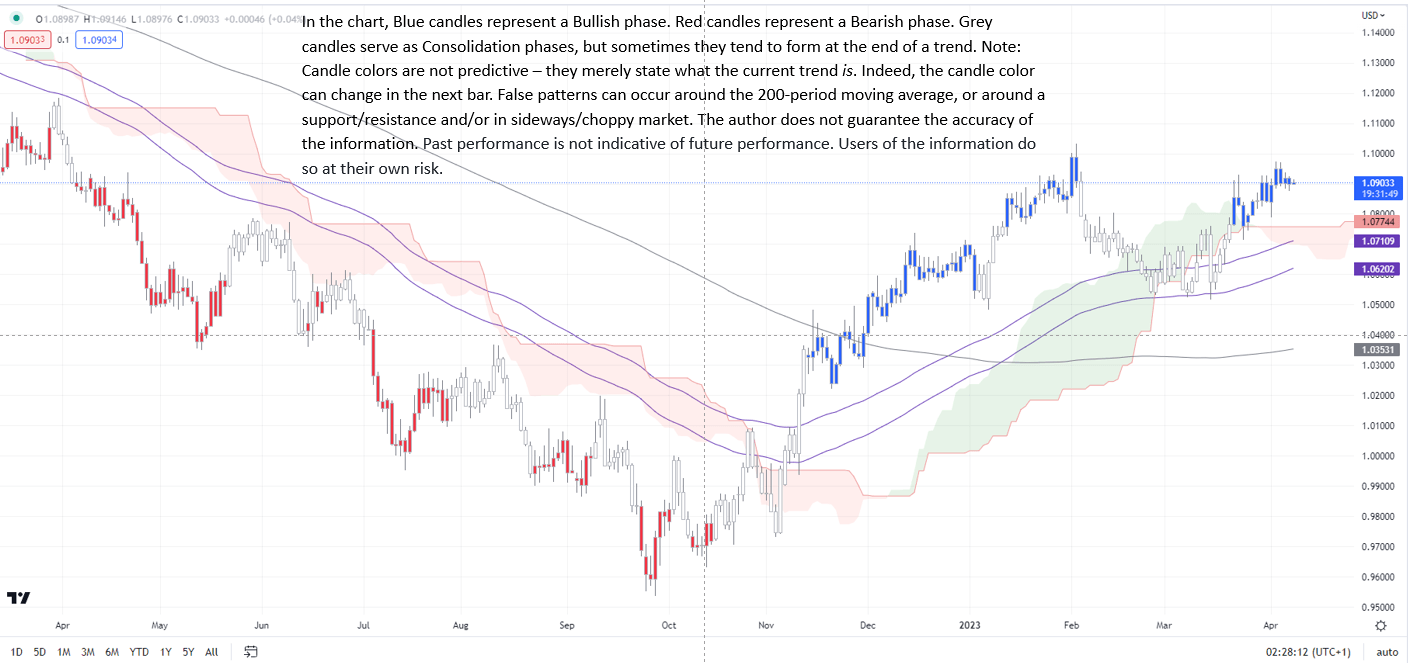
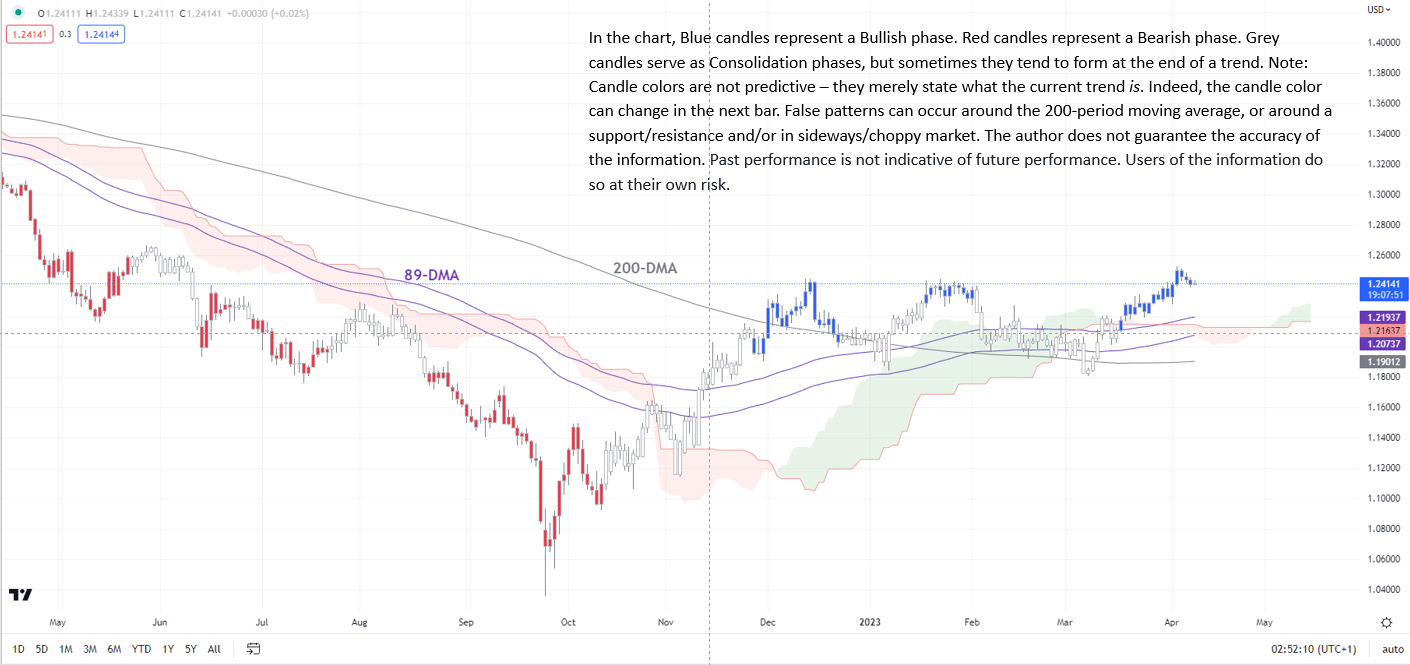
 However, elevated volatility from this uncertainty can be seen across several asset classes. This scenario has seen ranges build over time and often break to one side before either establishing a new range or folding back inside the prior range.




 Chat now!