Gold Prices Crushed by Resurgent Yields & Strong Dollar, Bullish Outlook in Peril

Gold Prices Crushed by Resurgent Yields & Strong Dollar, Bullish Outlook in Peril

Gold prices suffered a major setback on Thursday, falling for a third consecutive session and reaching their lowest level since the beginning of April. In early afternoon trading in New York, XAU/USD was down 1.4% to $1,960, dragged down by U.S. dollar strength and rapidly rising bond yields following encouraging macro data and news that the U.S. Congress is making progress in negotiations to raise the debt ceiling.

Focusing on today’s catalysts, unemployment claims corresponding to the previous week and the Philadelphia Fed’s manufacturing production for May were much less negative than anticipated, reinforcing the view that business activity remains remarkably resilient despite numerous headwinds, such as tightening lending standards, sticky inflation and non-stop recession talk in financial media.

With the economy holding up better than expected, the market is gradually pricing out the aggressive easing that had been discounted for the second half of 2023 in the immediate aftermath of the U.S. banking sector turmoil that erupted in March. Although with some qualms, it seems traders are starting to position for a “higher for longer” interest rate regime again, a key risk for precious metals.

Optimism over the prospect of an agreement to raise the U.S. borrowing cap and avoid a federal default also appeared to hurt safe-haven assets, including gold. For context, sentiment took a turn for the better after House Speaker Kevin McCarthy said that the lower chamber of Congress could vote on a deal as soon as next week, a sign that discussions are moving in the right direction.

Although fundamentals remain somewhat constructive for gold, the situation could change. For example, if the U.S. economy manages to stabilize and dodges a recession, rates could remain elevated for longer than initially contemplated. This scenario would undercut non-yielding assets, boosting the U.S. dollar in the process. For this reason, traders should keep a close eye on incoming data in the weeks and months ahead.

GOLD PRICES TECHNICAL ANALYSIS

After breaking below cluster support at $1,975, gold prices accelerated their retreat, falling to their weakest point in more than a month on Thursday.

While the recent decline seems to be a corrective move within a medium-term uptrend, the outlook could turn negative if bears manage to keep the pressure on the market.

In the event of a larger pullback, initial support appears near $1,920, the lower limit of a rising channel in play since September of last year. Bulls do not want to see prices breach this floor, otherwise sellers could make a try on $1,895, the 38.2% Fib retracement of the September 2022/May 2023 rally.

On the flip side, if bulls regain control of the price action and spark a rebound, technical resistance lies at $1,975, followed by the psychological $2,000 mark.

GOLD PRICES TECHNICAL CHART

A picture containing screenshot, text, line, diagram  Description automatically generated


US Dollar Eyeing Best 2-Week Performance Since September, Eyes on Resistance

US Dollar Eyeing Best 2-Week Performance Since September, Eyes on Resistance

US Dollar Back in the Spotlight as Treasury Yields Rise

The US Dollar roared higher on Thursday, extending a recent winning streak. Over the past 2 weeks, the DXY Dollar Index is up about 2.2%. That is the best 10-day performance since September 2022. Let us take a closer look at the past 24 hours and what to expect into the end of the week.

Unsurprisingly, the 2-year Treasury yield has rallied over 8.5% over the past 2 weeks, marking the best performance over such a period since September 2022 as well. Rising near-term bond yields can be seen as a sign of rising confidence in the US economy.

During Thursday’s Wall Street session, reports crossed the wires that Congressmen on Capitol Hill are creating plans to vote in the short term on a bipartisan deal to raise the debt ceiling, opening the door to averting a default.

Meanwhile, timely data on the labor market showed signs of improvement. Initial jobless claims unexpectedly fell to 242k last week. Economists were eyeing a 251k increase. Still, both numbers are below the previous +264k print.

As a result, financial markets continued pricing out near-term rate cuts from the Federal Reserve amidst a still-tight labor market and sticky underlying inflation. Since last Wednesday, almost 2 rate cuts were taken off the outlook in one-years’ time.

This is likely why the US Dollar rallied. Heading into the remaining 24 hours, all eyes turn to a speech from Chair Jerome Powell and former Chair Bernanke during a policy panel. If the former continues cooling near-term Fed rate cut bets, USD could add momentum to its impressive rally.

US Dollar Technical Analysis

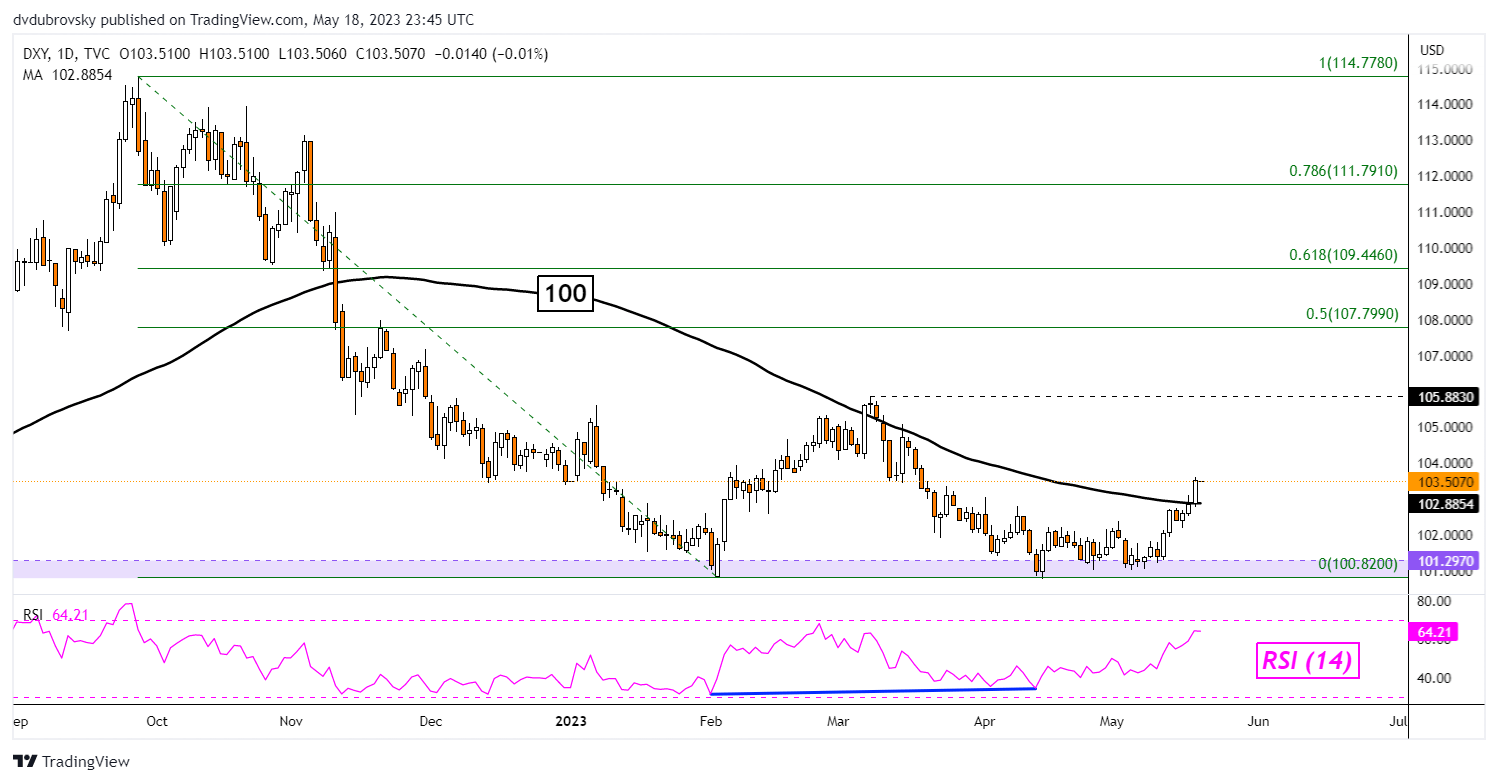
On the daily chart, DXY has broken above the 100-day Simple Moving Average (SMA). That has exposed the March high of 105.88. Given upside confirmation, this could open the door to extending higher in the near term. Key support is the 100.82 – 101.79 range below.

DXY Daily Chart

DXY Daily Chart


US Stocks: S&P 500 Tags New Yearly High on Debt Ceiling Optimism

US Stocks: S&P 500 Tags New Yearly High on Debt Ceiling Optimism

US Stocks Edge Higher Despite Stronger Dollar, Higher Yields

Sentiment has taken a large stride forward this week as news emerged about a possible deal at the end of this week or sometime next week regarding the raising of the US debt ceiling. Markets no longer appear to be pricing in the possibility of a US default, which would have unthinkable ramifications not just for the US but for the wider market as a whole.

As concern around the debt ceiling wanes, markets are left to contemplate the rising probability of another 25-basis point hike form the Fed early next month as inflation shows little sign of improvement. According to the CME FedWatch tool, markets price in more than a 30% chance of a rate hike, up from 28.4% yesterday and 15.5% last week.

image1.png

US yields, mainly the 2-year and 10-year treasuries continue to rise, elevating the dollar in the process. However, this has not appeared to weigh on the index but could serve to cap S&P 500 upside as the index briefly tagged a new yearly high.

Additionally, Fed speakers this week expressed an openness to another hike should the data deem it necessary. Later today (16:00 UK time) Fed Chairman Jerome Powell is due to speak at a Fed hosted conference titled ‘Perspectives of Monetary Policy’.

S&P 500 Technical Levels to Consider

The index’s recent bullish momentum had catapulted it to a new high for 2023, trading above 4200 and the February high of 4008.50. The latest move is significant given the previous inability to break into territory above 4200 for more than a day. Should the index head into the weekend clear of 4200, further upside resistance comes in at 4311.75, the 61.8% Fibonacci retracement of the major 2021 – 2022 selloff. Immediate support comes rests at 4208.50 followed by 4180 and lastly, 4110.

S&P 500 E-Mini Futures (ES1!) Daily Chart

image2.png


Debt Ceiling Blues, Part 79. What Happens if the US Defaults?

Debt Ceiling Blues, Part 79. What Happens if the US Defaults?

There’s a particular long-running piece of political theater with which the United States rather ghoulishly entertains itself and, increasingly, the wider world. A farce in seventy-eight acts (so far), since 1960. It’s called “Raising the Federal Debt Ceiling”.

Technically there is a limit on how much money the US government is allowed to borrow. This idea was baked only vaguely (if at all) into the Constitution but, as time went on, it became codified in various public debt acts and their numerous amendments. Of course, while there is a borrowing limit, Congress has always in the past simply raised it, often just in time, before the government runs out of money without the legal means to borrow any more.

Even the most partisan political show-ponies realize that debt default, the alternative to ceiling-raising, would swiftly turn farce into tragedy.

You may have spotted by now that the ceiling is in effect an executive fiction, one that the world is by and large happy to believe in.

For the US Dollar has long been the world’s reserve currency and by far the most-used unit in international commerce. It overcame all rivals to reach that dizzy height, displacing Sterling at the top of global trade back in the 1930s. It has since seen off all possible comers since, from the one-time contender Japanese Yen to bold upstarts like the Euro and Chinese Yuan. All sorts of global markets, contracts and derivative products are benchmarked against the Dollar, usually far more than all other comparable products put together.

image1.png

The Dollar Has No Plausible Rival

There’s simply nothing that can match the depth and liquidity of US markets, to the point where it’s quite legitimate to talk about a “Dollarized” world financial system. The deepest pools of capital for everything from stocks and bonds to oil and gold are all in the Dollar.

US debt is also supposed to be the world’s pre-eminent ‘risk free’ investment. Why so? Well, because the United States federal government never defaults on its debt.

So, make no mistake, on some level, the US debt ceiling affects us all.

And now the seventy-ninth act is upon us. For the US hit its debt ceiling this week. The thing currently stands at $31.4 trillion dollars and that’s where we are. So, the federal government now finds itself legally unable to borrow more money until Congress decides to suspend or raise the ceiling.

And what has happened seventy-eight times before (three of them in the last six months) is that the ceiling has simply been raised. But now Republicans control the House of Representatives and they want spending cuts which the Democrats in the Senate and, of course, the White House, say they won’t permit.

This gridlock has raised serious concerns that this time farce could morph into tragedy, potentially leading to the first intentional debt default in the history of the Republic.

Sadly, there’s still room for political brinkmanship because the US Treasury can manage the situation at least temporarily. In the past this has included steps like suspending investments it’s meant to make into retirement and health benefits for federal employees, only to top them up once the ceiling has been raised. Treasury Secretary Janet Yellen has announced a package of such measures. She thinks that could keep the government above water until around June.

Now, despite the current impasse, it’s overwhelmingly likely on all past evidence that the two main parties will eventually come together and raise the ceiling.

The Dollar Has No Plausible Rival

Data Source: Bank of International Settlements

So, What Happens If Congress Can’t Agree?

But what if they don’t? What would happen if the unthinkable occurs and the US does in fact default on its debts?

The practical, domestic consequences would be bad enough, with federal salaries unpaid, along with military ones, medical care payments and a host of other outlays usually deemed essential, not least those interest repayments on the national debt.

The United States credit rating would be downgraded, with the government obliged to pay higher interest rates to get its bonds sold. Of course, Washington would remain “investment grade” but the global bond market would have seen its anchor slip for the first time. And that would be a hugely uncomfortable experience.

But the horrors of debt default would soon break free of their homeland and ripple out into the wider world. Other reserve currencies such as the Euro and Yen would see a huge influx of funds at the expense of a tanking Dollar. And don’t forget, many currencies operate within a “Dollar peg” system which explicitly links them to the US currency. They would all experience significant dislocation should the US default.

US import prices would likely also rise extremely sharply, reigniting inflation just when it looked to be cooling down.

The timing would be appalling too. Clearly there’d never be a good time for Washington to fail in its obligations. But a world only just recovering from Covid and still chafing under the burdens of inflation and Russia’s invasion of Ukraine really wouldn’t need another huge problem. A US debt default would probably nail on a deep global recession.

Even so, it’s important not to get too dramatic. A debt default arising from political gridlock would be nasty, but that very fact would probably see the impasse broken. Eventually that ceiling would be raised again, and the federal debt train would trundle on. Dollar appetite took years to build. It’s not going to vanish overnight.

But default is a financial nuclear option that would leave the Greenback forever diminished. Some will feel that even a humbled USD has no plausible rival, and they’d have a point.

But in the end, it’s extremely doubtful that Congress will consider a real world test of that point.

Isn’t it?

EUR/USD Forecast: Test of 1.0745 on the cards

EUR/USD Forecast: Test of 1.0745 on the cards

  • Optimism boosts stock markets, but the US Dollar continues to strengthen.
  • Upbeat United States macroeconomic figures weigh on EUR/USD.
  • EUR/USD extends decline below 1.0800, aims to test a critical support level at 1.0745.

The EUR/USD pair remains under selling pressure, trading below the 1.0800 threshold. The Greenback retains its latest strength despite resurgent optimism, as United States (US) authorities are on their way to clinch a deal on extending the debt ceiling. Furthermore, easing concerns about the banking crisis underpin the mood. Bank stocks are up as US Western Alliance reported a rise in deposits, suggesting depositors’ flight receded. Global stock markets maintain the green on Thursday, reflecting the better sentiment, but things are different across the FX board as the US Dollar advances against most major rivals.

The European macroeconomic calendar had nothing relevant to offer, although European Central Bank (ECB) Vice President Luis de Guindos hit the wires, noting that “inflation in services is the most worrying for the ECB,” adding there is still scope to keep raising rates.

On the other hand, the US published Initial Jobless Claims for the week ended May 12, which increased by 242K, beating the 254K expected and decreasing from 264K in the previous week. Also, the May Philadelphia Fed Manufacturing Survey printed at -10.4, improving from -31.3 in April and better than the -19.8 anticipated by financial markets. The US Dollar ticked higher with the news. Later in the American session, the country will publish April Existing Home Sales.

EUR/USD short-term technical outlook

The EUR/USD pair pierced the 1.0800 threshold, and technical readings in the daily chart support a bearish extension in the upcoming sessions. The pair extends its decline below a firmly bearish 20 Simple Moving Average (SMA) while it is currently piercing a mildly bullish 100 SMA. At the same time, the Momentum indicator heads south at fresh two-month lows, while the Relative Strength Index (RSI) indicator hovers around 37, in line with another leg south.

The bearish case is also clear in the near term, as the 4-hour chart shows that technical indicators head south almost vertically without signs of downward exhaustion. In fact, the RSI is currently at 27, suggesting market participants are ready to test the 1.0745 support level, the 61.8% Fibonacci retracement of the 2022 yearly decline. Finally, the pair moves under all its moving averages, with the 20 SMA well below the longer ones and the 100 SMA aiming to cross below the 200 SMA

Japanese Yen Price Setups: USD/JPY, GBP/JPY, EUR/JPY

Japanese Yen Price Setups: USD/JPY, GBP/JPY, EUR/JPY

Improved Risk Sentiment Weighs on the Yen

News of a possible agreement to raise the debt ceiling filtered through to markets yesterday evening and has continued to ease risk sentiment this morning. Updates from both sides of the US political system mentioned that a deal could be done by Sunday and that the framework for a deal has been established. With tensions over a US default subsiding, the Japanese yen appears vulnerable once more.

USD/JPY: Two Forces Combine, Sending the Pair Higher

Taking a look at USD/JPY ahead of Japanese inflation data tomorrow and a speech by Fed Chair Jerome Powell at an event titled ‘Perspectives of Monetary Policy’, it is clear to see the effect of both a stronger dollar and weaker yen at play. The dollar has ticked higher upon recent revelations of entrenched inflation expectations on the part of the US consumer and stubborn inflation. Rising US yields have also emboldened dollar bulls to return to the market after a period of heavy selling.

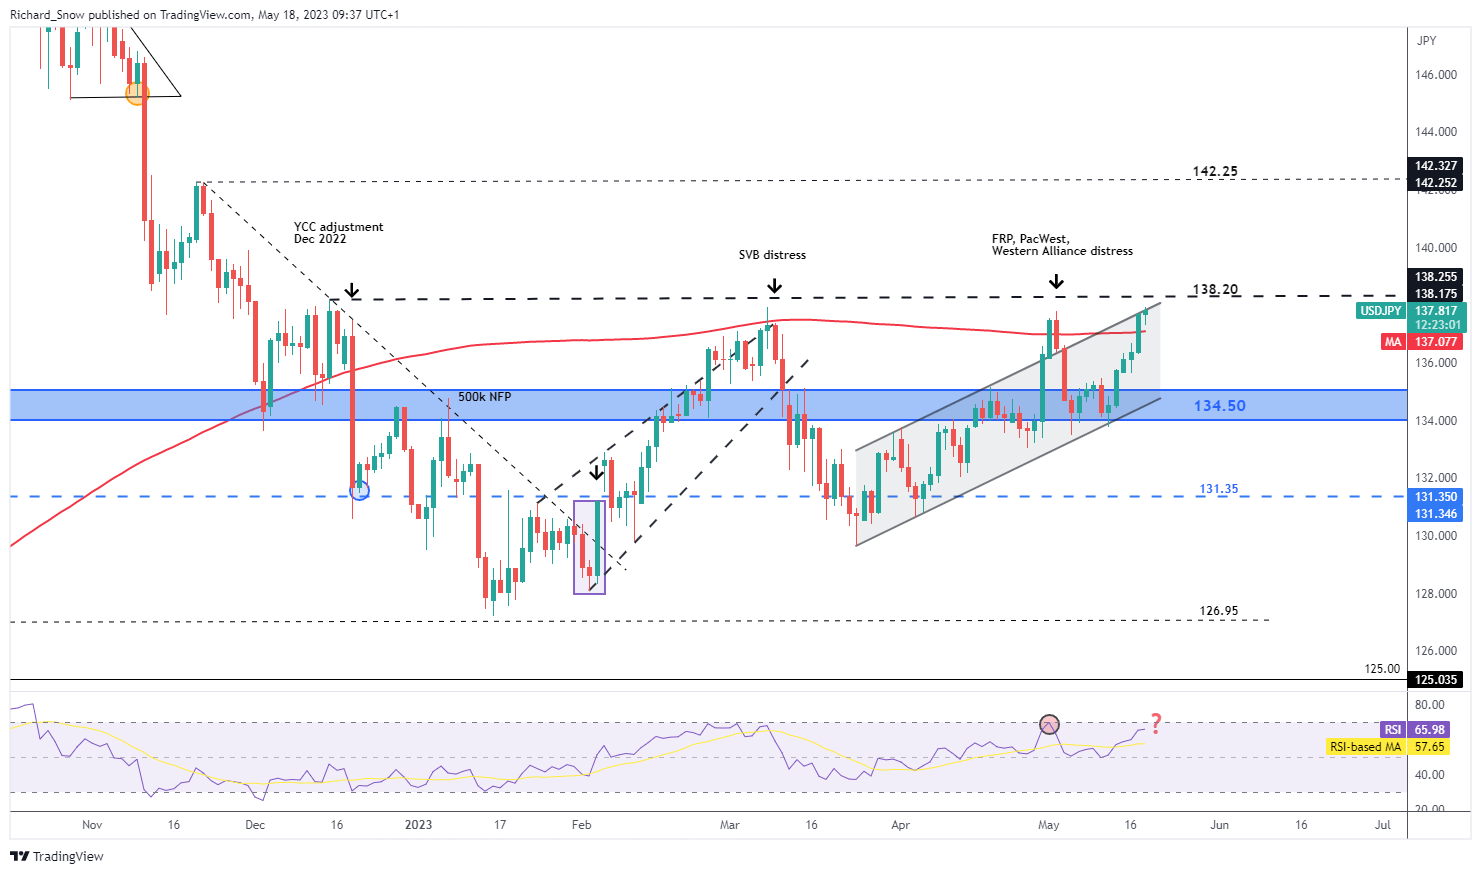
USD/JPY trades on the cusp of the upper side of the ascending channel which has, but for the prior false breakout, contained price action thus far. The pair now trades above the 200 SMA, flirting with the crucial 138.20 level of resistance – a level that has been approached multiple times this year without the needed momentum to trade above. However, given that this move involves both a weak yen and stronger dollar, momentum may be on the side of USD/JPY bulls. A lot will depend on whether an agreement can be reached on the debt ceiling this week.

USD/JPY Daily Chart

image1.png

GBP/JPY: Regrouping Before Attempting Upside Break

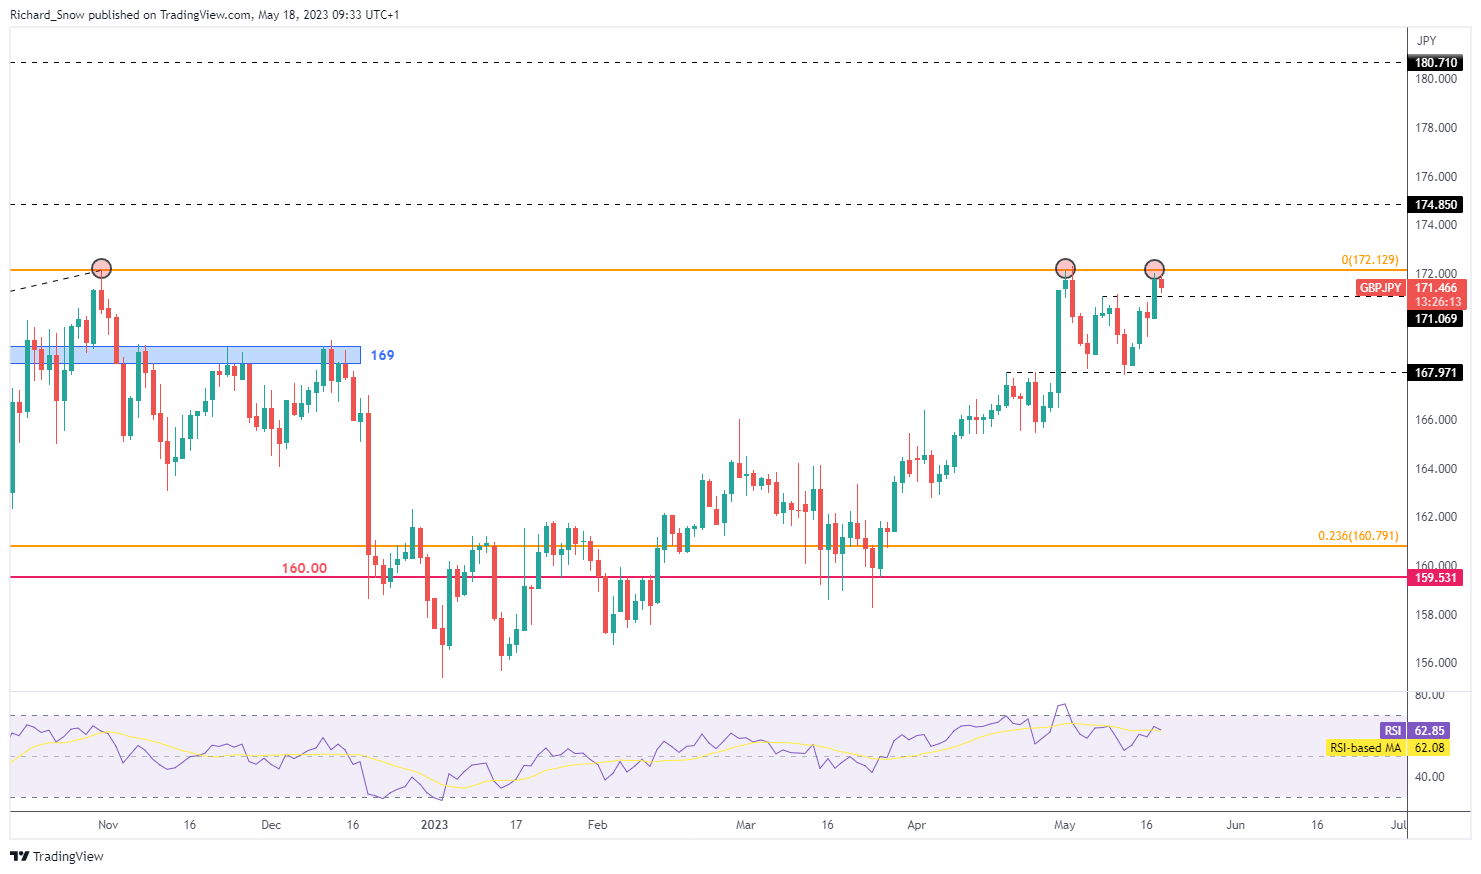
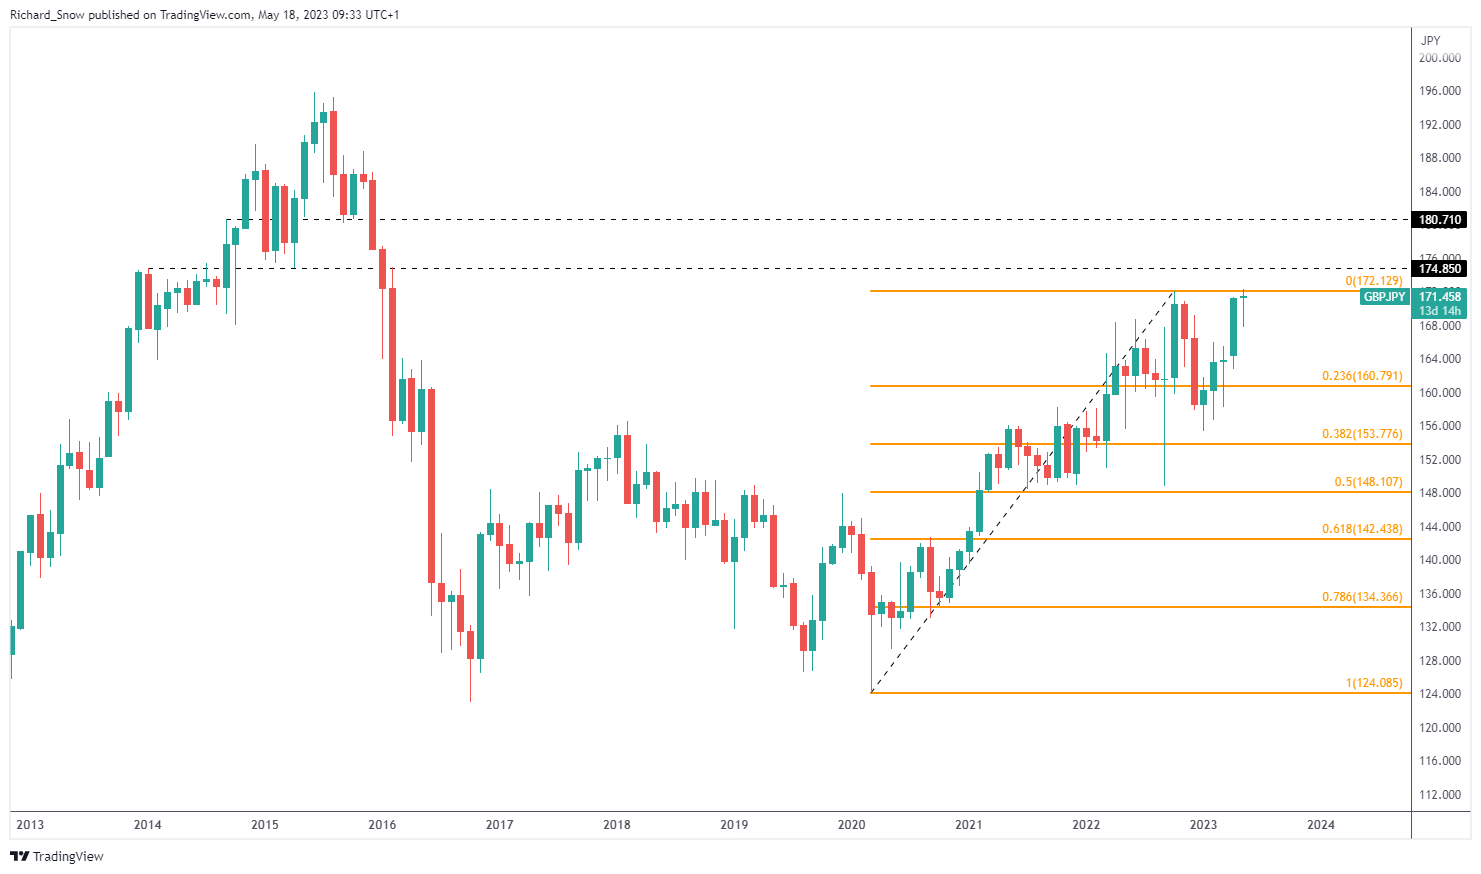
GBP/JPY is at a similar juncture, testing resistance, but has shown indications of an intra-day pullback. The pair approaches the orange line which represents the high of the major 2020 to 2022 bullish advance which can be seen on the monthly chart along with further relevant levels of resistance should the pair clear 172.13. Early indications point towards a pullback towards 171.07 before another attempt at the key resistance level can be considered. The RSI has moved away from overbought territory, suggesting there is still some room left to the upside before a deeper pullback may be on the cards.

GBP/JPY Daily Chart

image2.png

Source: TradingView, prepared by Richard Snow

The monthly GBP/JPY chart shows the relevant Fibonacci levels for the major 2020 to 2022 move to the upside while also revealing the next levels of resistance should the pair break higher (174.85 and 180.70).

GBP/JPY Monthly Chart

image3.png

EUR/JPY: Bullish Move Capped by Prior Swing High

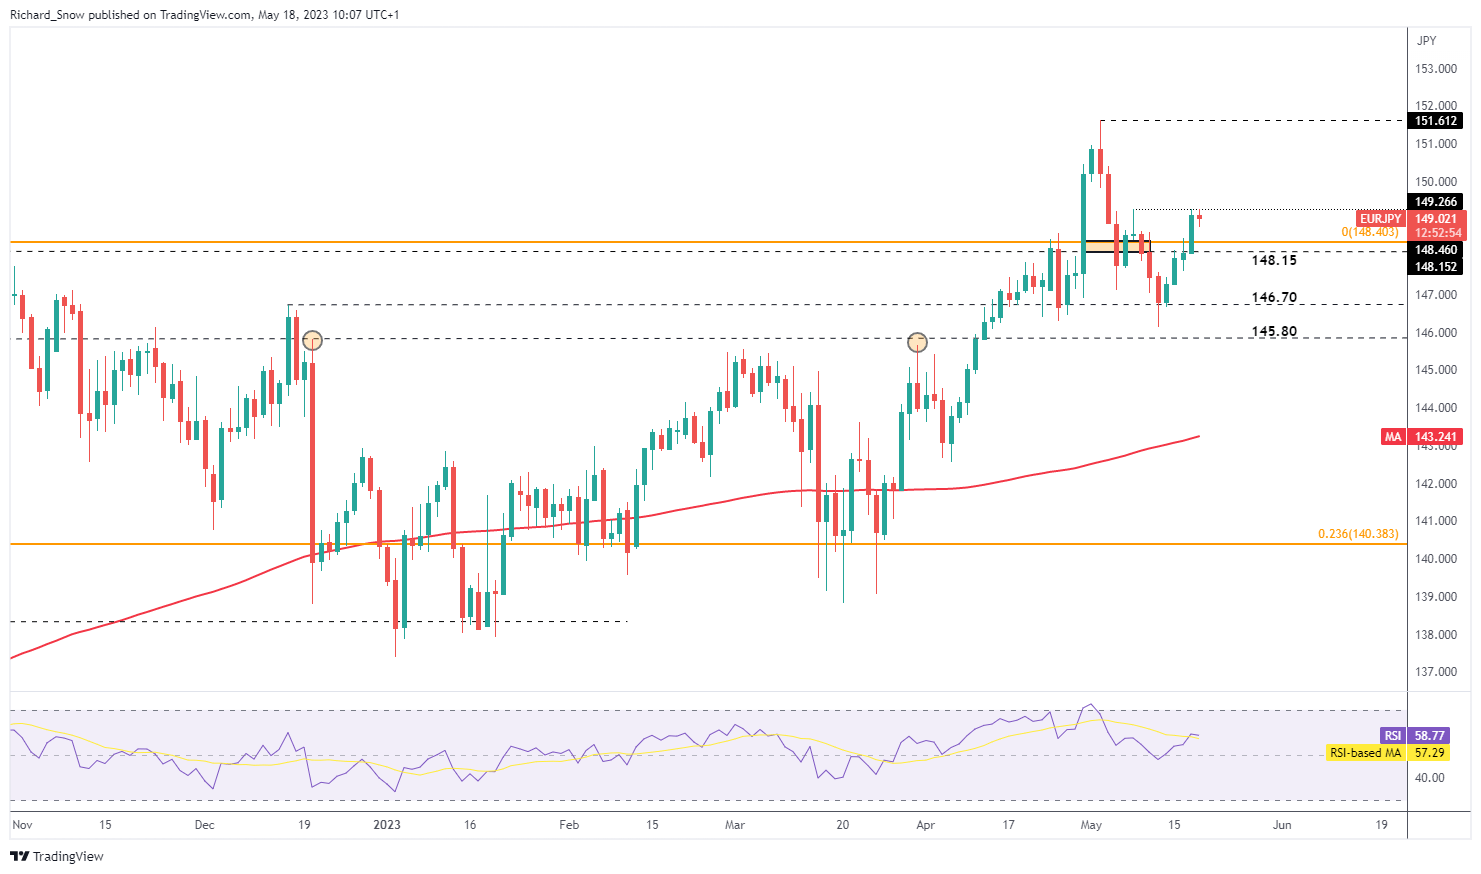
The EUR/JPY daily chart reveals a slowing of bullish momentum at the prior swing high of 149.27 in early European trade. The reemergence of US regional bank fears appears to have subsided, allowing the rising interest rate differential between the two currencies to pull the pair higher.

ECB officials are scheduled to speak on Thursday and Friday, looking to reiterate the need for further tightening to control inflation that is yet to see a meaningful decline, particularly on the core measure (inflation ex food and energy). The RSI eases away from overbought territory suggesting more room to the upside but 149.27 remains the tripwire for a bullish continuation.

EUR/JPY Daily Chart

image4.png

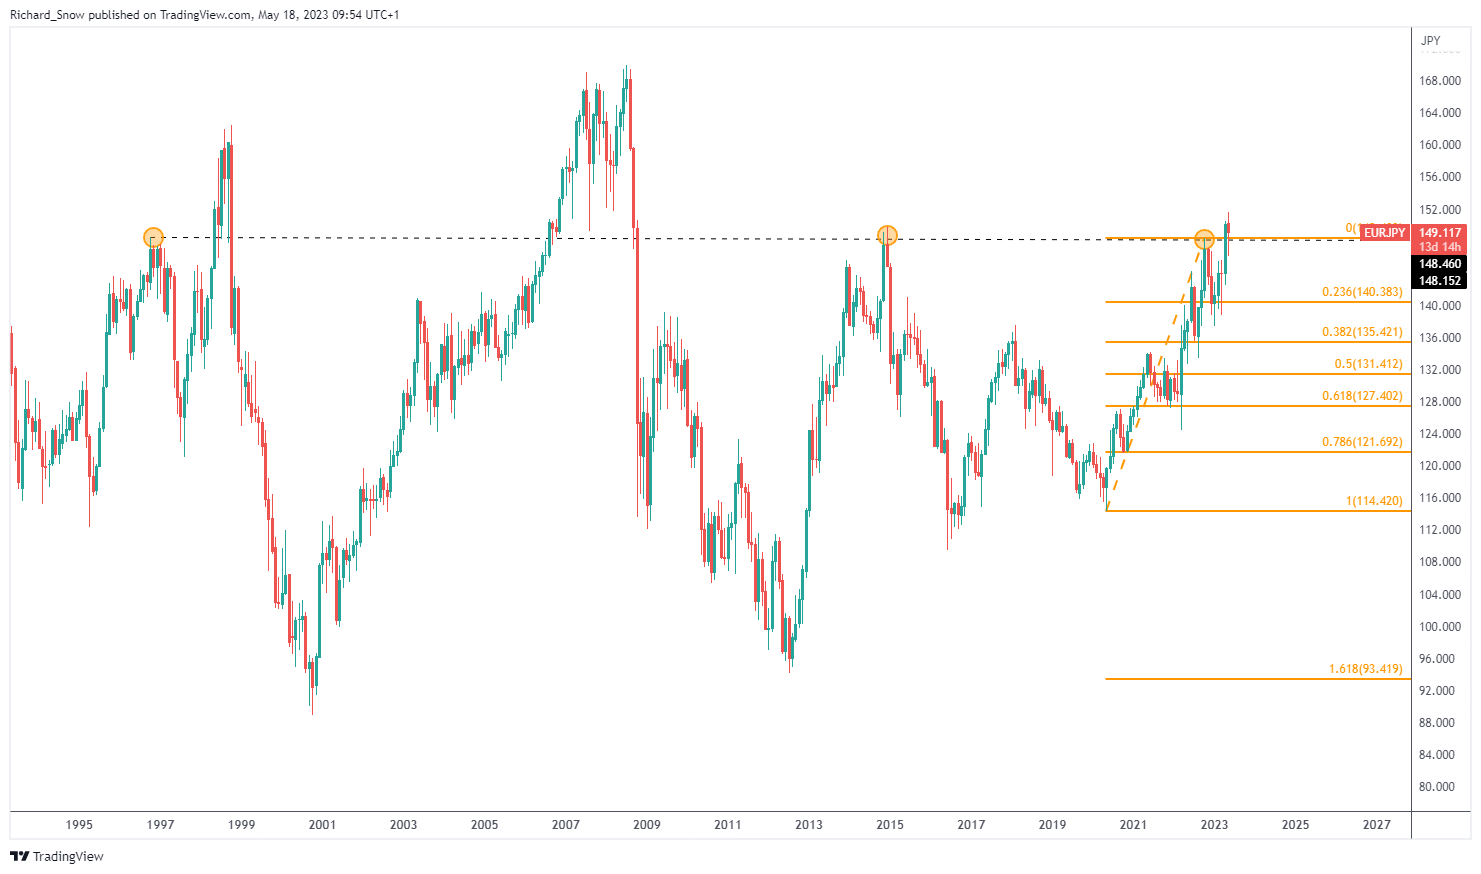
The monthly chart reveals a key long-term level of 148.46, a proven pivot point for major reversals in years gone by. For now, the pair trades above this level but its proximity provides a strong reminder that a sudden shift in sentiment has the potential to reverse the trajectory of the pair.

EUR/JPY Monthly Chart

image5.png

EUR/USD Price Forecast: EUR/USD Eyeing Bounce at Key Confluence Area

EUR/USD Price Forecast: EUR/USD Eyeing Bounce at Key Confluence Area

EUR/USD FUNDAMENTAL BACKDROP

EURUSD has continued its decline this morning back toward support around the 1.0800 level. The US dollar has held onto recent gains despite improving optimism by market participants that a deal will be reached regarding the US debt ceiling.

Currency Strength Chart: Strongest – NZD, Weakest – AUD.

image1.png

As we have a rather muted calendar heading into the weekend all eyes remain on developments around the US debt ceiling which continues to support the US dollar. Positive sentiments were echoed from both sides yesterday with House Rep. Kevin McCarthy stating that an agreement by Sunday may be possible. The US dollar has also benefitted from rather hawkish comments of late from a host of Federal Reserve speakers who have stood firm against the idea of rate cuts in 2023.

European Central Bank (ECB) policymaker have been striking a hawkish note as well, not surprising but thus far having a limited impact on the Euro. This morning we had comments from the ECB’s De Guindos who stated that though most of the tightening is done there is still scope for further hikes. He stressed however that inflation in services remains a serious concern for the Central Bank and will be closely monitored for the rest of 2023.

Another largely lackluster day ahead in terms of economic data releases with the docket loaded with Federal Reserve speakers. We also have some medium impact data out of the US which I do not expect to add any significant volatility to markets in the US session.

image2.png

TECHNICAL OUTLOOK AND FINAL THOUGHTS

Looking at EURUSD as the day progresses and the US debt ceiling is likely to be the key driver for price action. Any further positive comments from either camp should cap any further USD gains and hopefully see a bounce for EURUSD, while any dithering and slowdown in talks could have the opposite effect and favoring continued US dollar strength.

From a technical perspective, EURUSD rests on a knife edge at the moment as we trade right on the 100-day MA and 1.0800 support level. The 100-day MA has proved a significant hurdle in the recent past with the pair having last traded below the MA in November of 2022. The last retest of the 100-day MA occurred in in mid-March right before the extended 500-odd pip rally higher for EURUSD, highlighting the significance of the 100-day MA once more.

Given the key support area at 1.0800 coupled with the MA we could most definitely be in for a retracement back toward the 1.1000 psychological level. There is a chance that we pierce the 1.0800 mark, but I don’t such a move as sustainable with a daily candle close below the 100-day MA the only event that may make me question a bounce to the upside. A bounce lower could find stern support at 1.0740 hence my apprehension around the sustainability of a downside break of the MA and support level at 1.0800.

EUR/USD Daily Chart – May 18, 2023

image3.png


Bitcoin (BTC/USD) Price Latest: Struggling to Reclaim Recent Highs Despite Debt Talk Optimism

Bitcoin (BTC/USD) Price Latest: Struggling to Reclaim Recent Highs Despite Debt Talk Optimism

US President Joe Biden is ‘confident that we’ll get an agreement on the budget’ after talks yesterday with House Speaker Kevin McCarthy on the looming debt ceiling and possible US debt default. Republican McCarthy added to the positive tone of the meeting saying that ‘we’ve already taken default off the table’ and that the ‘structure of how we negotiate has improved’. The more optimistic tone between the two sides boosted risk markets on Wednesday. The US dollar continued its recent push higher, the Nasdaq posted a fresh nine-month high, while the S&P 500 nears levels last seen back in late August.

While the debt ceiling talks gave risk markets, in general, a push higher, Bitcoin was also helped by news yesterday that Tether, the largest asset-backed stablecoin, would invest up to 15% of its net profit into Bitcoin on a monthly basis. Tether recently announced a net profit of around $1.5 billion.

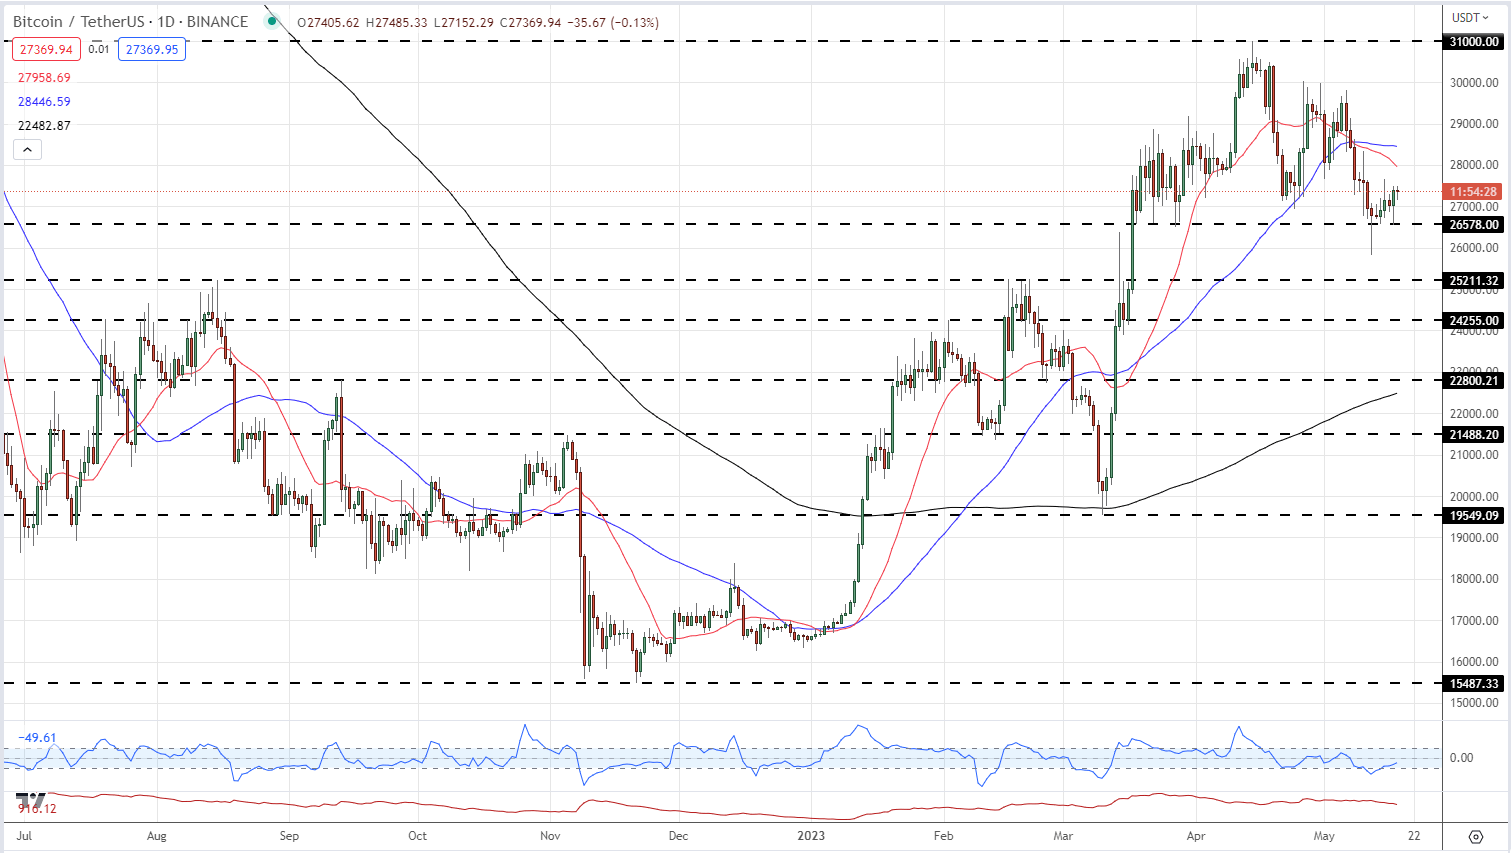
The cryptocurrency market joined the move higher with Bitcoin bouncing off support around $26, 600. The largest cryptocurrency by market cap is currently changing hands around the $27,400 level. While higher prices may be seen in the coming weeks, the latest move higher lacks conviction and remains vulnerable to a short-term sell-off. The previously mentioned support level around $26,600 needs to hold if BTC/USD is to push higher as there is little in the way of any technical support before $24,255 comes into view if selling persists. If the move higher continues, resistance from the 20- and 50-day moving averages, currently at $27, 957 and $28,446 respectively needs to be broken to allow a re-test of the recent $30,000 double-top.

Bitcoin (BTC/USD) Daily Price Chart – May 18, 2023

image1.png

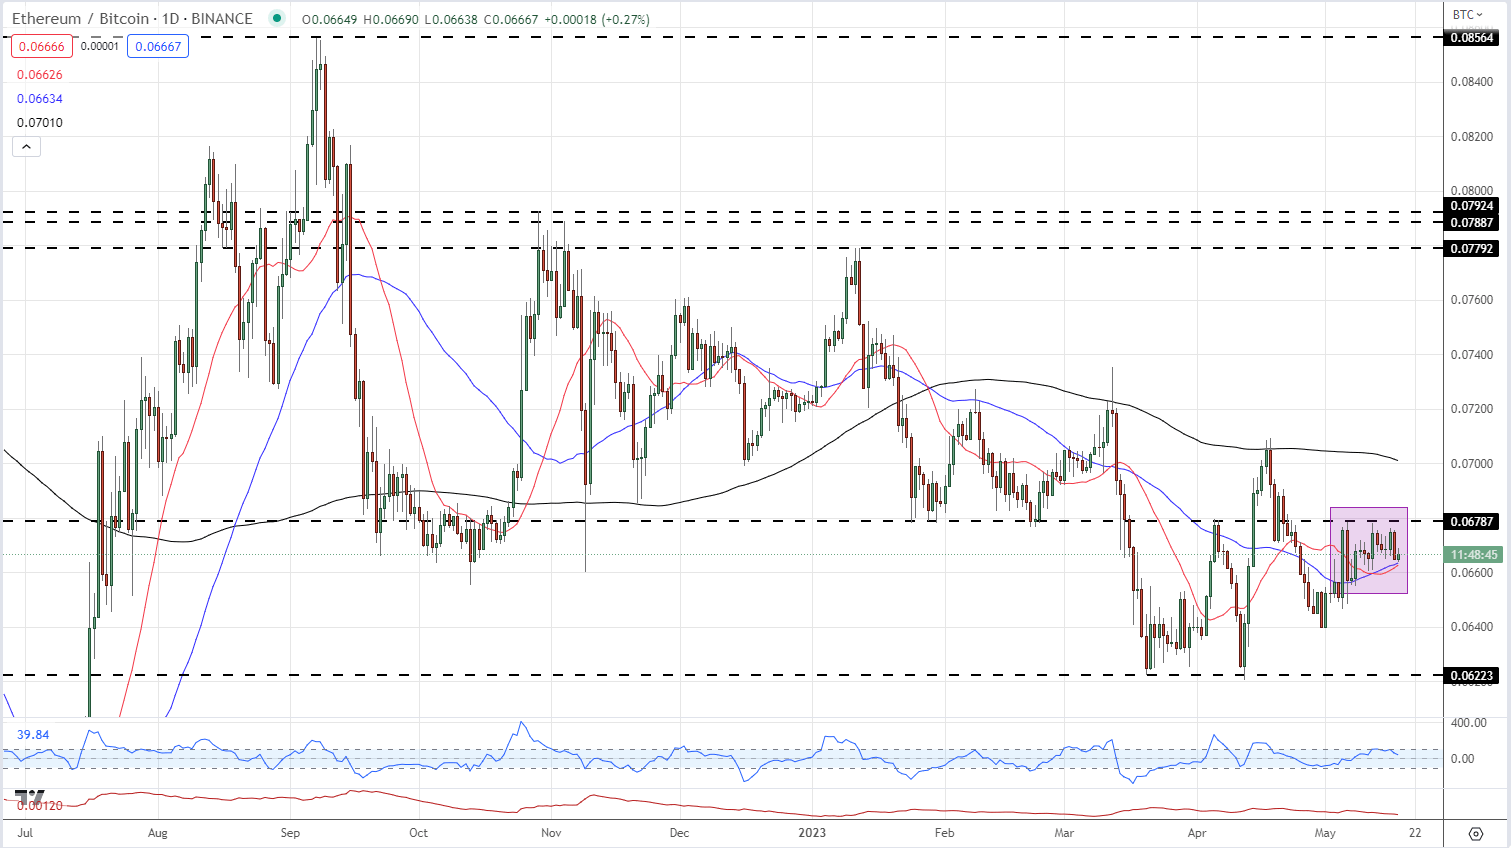
The Ethereum/Bitcoin chart is at an interesting spot with 0.06787 proving difficult to break while the 20- and 50-day moving averages are currently providing support around 0.06630. This narrow range is likely to break soon.

Ethereum/Bitcoin (ETH/BTC) Spread Daily Chart – May 18, 2023

image2.png

Charts via TradingView

What is your view on Ethereum – bullish or bearish?? You can let us know via the form at the end of this piece or you can contact the author via Twitter @nickcawley1.

Crude Oil Price Forecast: Brent & WTI Caught Between Supply & US Factors

Crude Oil Price Forecast: Brent & WTI Caught Between Supply & US Factors

BRENT/WTI CRUDE OIL FUNDAMENTAL BACKDROP

Crude oil prices (WTI and Brent) have rallied on the improved risk sentiment yesterday following on from relatively positive US debt ceiling negotiations. Despite a stronger U.S. dollar and a massive addition to weekly crude oil stocks via the EIA report, debt ceiling optimism has dominated other variables. From a supply chain perspective, fires in the Alberta region (Canada) have extended their devastation revising supply downward and bolstering crude oil prices.

Looking at the economic calendar today, US data has begun the trading day on the front foot with labor data (see below) significantly beating estimates on all metrics thus reinforcing the tight labor market in the US. The initial impact was a stark rally in the Dollar Index (DXY) resulting in a selloff in crude oil markets. The rest of the day will be dominated by Fed speak providing some short-term volatility for oil.

U.S. ECONOMIC CALENDAR (GMT +02:00)

image1.png

Source: DailyFX economic calendar

TECHNICAL ANALYSIS

BRENT CRUDE OIL PRICE CHART (DAILY)

image2.png

Chart prepared by Warren Venketas, IG

Daily Brent crude oil price action is trading within an ascending triangle formation (black) with two unsuccessful attempts by bulls to pierce triangle resistance coinciding with the 77.23 March swing low.

US dollar forecast: No signs of reversal yet

US dollar forecast: No signs of reversal yet

If you look at the rallying global equity markets, investors are evidently very optimistic about the US debt ceiling negotiations and not too worried about the slowdown in China. Yet, the same optimism is not evidenced in FX markets, with the dollar remaining on the front-foot. But is that about to change, will the US dollar forecast turn more bearish moving forward?

Rallying equities not enough for risk-sensitive FX pairs

This morning saw the German DAX index causally rally another 200 points to hit its highest level since January 2022. Elsewhere, the Nikkei has been on a tear, rising 17% from its March low to break the September 2021 peak. The day before, saw the Nasdaq 100 climb to its best level since last August, and index futures were pointing to another higher open on Wall Street today.

But unlike equities, the FX markets are not so cheerful. Admittedly, the JPY crosses have been on a tear along with the Japanese equity markets to suggest it is indeed “risk-on”. But if you look at the US dollar against other currencies, you will get a different picture – for it is also continuing to rise against the more risk-sensitive currencies like the AUD, GBP and EUR.

US data surprises to upside

In terms of economic data, we have just seen the release of jobless claims. Claims surprised on the upside las week but were expected to decline from 264K to 252K. However, if they came better at 242K, thus supporting the dollar further. What’s more, the May Philly Fed came in -10.4 versus -19.8 expected.

Later in the day we have existing home sales data, while Philip Jefferson, Michael Barre and Lorie Logan are among today’s Fed speakers.

China concerns holding back commodity currencies

Global demand concerns have dragged on sentiment towards commodity FX in recent weeks, following the release of a number of disappointing data pointers from China in April. Among other things, these include most recently retail sales and industrial production. We also saw a big drop in imports while house prices fell again, extending the decline to 11 consecutive months. China’s property sector is key for the economic growth outlook as it accounts for around 20% of the country’s GDP.  As well as the AUD and NZD, we have also seen the yuan slump to lift the USD/CNH pair to levels not seen since November.

US dollar forecast: Will the greenback weaken again?

In the US, interest rates are already at a peak and inflation is on a downward trajectory. There is a possibly that the economy is going to weaken in the months ahead, allowing the Fed to pivot by as early as September.

In the short-term, the potential weakness for USD could arise from a potential rebound in foreign currencies, should improving risk appetite make its way into risk-sensitive currencies. President Joe Biden and House Speaker Kevin McCarthy’s rhetoric have narrowed, and both are optimistic about achieving a deal by Sunday.

Will major FX pairs rebound?

So, are we going to see the risk-on trade make its way into the FX markets today and see the likes of the EUR/USD, GBP/USD, AUD/USD and CAD/USD rebound?

US dollar forecast

Well, if you look at the GBP/USD and EUR/USD, they are both testing some interesting technical levels of around 1.24ish and 1.08ish, respectively. The AUD/USD remains in the lower half of its tight 200-pip range between 0.66 to 0.68. There’s a similar pattern on the NZD/USD pair. But the USD/CAD has started to trend a little lower, closing lower on Wednesday, potentially providing the first indication that the USD might be about to turn lower against other currencies, too.

But as traders, we must act on what’s in front of us and right now the dollar bears are not getting the signal they are looking for. Therefore, if you are looking for potential long setups on the majors, some confirmation must first be observed.